Introduction
The prevention of metallic corrosion phenomena is vital, and must be accomplished with inorganic or organic inhibitors. However, the usage of some of them has been restricted, due to their toxicity and insufficient IE%, at low dosages 1-6. The efficiency of corrosion inhibitors depends on environmental conditions, and on their interaction with metal surfaces, which is related with their structure, including their number of adsorption active centers, charge density and molecules size 7),(8.
MS enjoys wide application in industries, due its superior mechanical and physical characteristics. However, it is prone to quick corrosion in most service environments. Small amounts of inhibitor molecules may increase MS resistance to corrosive solutions, when they adsorb onto the metal surface and form a barrier that inhibits its active sites. The inhibitor molecular structure, different MSs and electrolytes have an impact on its adsorption 9-11.
Among the alternative corrosion inhibitors, organic compounds have been reported to effectively control MS dissolution in acidic media, especially those containing: N, O, P and S atoms; π bonds; and functional groups, such as NH-, -C = N-, -CHO and R-OH 12),(13. N-heterocyclic compounds, which are the most synthesized ones, are known to be excellent inhibitors for metallic corrosion 14),(15. Recently, more studies have shown that IE% against MS corrosion in acidic solutions is enhanced by several organic compounds containing N 16. It was shown that such compounds have protective properties that depend upon their ability to reduce W values, and that they are enhanced at higher electron densities around the N atoms 17-19.
On the other hand, it has been reported that ionic salts, with positively charged N+, are important corrosion inhibitors in HCl and H2SO4. The effect of concentrations, functional groups and halide ions on Fe and steel corrosion has been extensively studied. The synergistic effect between organic cations and halide anions is considered to be an important factor in their inhibiting action on metallic corrosion 20-22.
Particular attention has been devoted to quaternary imidazolium salts that possess unique physical properties and chemical reactivity. From a chemical point of view, imidazolium and benzimidazolium derivatives can be considered as ionic N-heterocyclic salts. So, it has been considered of interest to investigate the inhibitory effect of these compounds on metallic corrosion.
The main objective of this work was the synthesis and IE% evaluation of the two azolium salts on MS corrosion in a 0.5 M H2SO4 medium. We incorporated other groups in the inhibitors structures, such as aromatic rings, and the hydroxyl function. We expected to obtain a wider surface adsorption and an excellent corrosion inhibitor. To further understand the corrosion IE%, theoretical investigations were made, and the temperature effect was studied. WL experiments, PDP measurements, EIS techniques and quantum chemical calculations were carried out in this work.
Experimental
Solutions
The aggressive solutions of 0.5 M H2SO4 were prepared by dilution of analytical grade 98% with distilled water. The concentration range of the employed inhibitors was from 0.1 to 5 mM (0.1 to 5 mmol/L).
Inhibitors
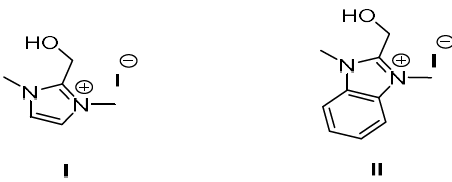
Compounds I and II were synthesized (Fig. 1), by treating one equivalent each of (1-methyl-1H-imidazol-2-yl) methanol and (1-methyl-1H-benzimidazol-2-yl) methanol, respectively, with 3 equivalents of methyl iodide in refluxing CH3CN. The white solids were filtered off, and then washed with CH3CN. Suitable crystals of the compounds I and II were obtained through aqueous and CH3CN/MeOH solutions evaporation, respectively. The X-ray crystallographic analysis of I and II single crystals confirmed their structures (Fig. 2).
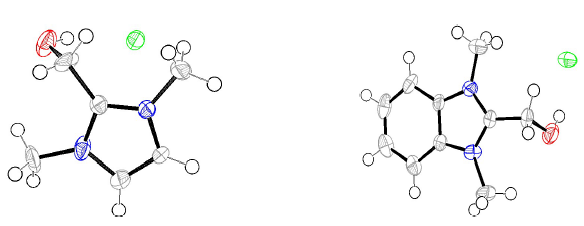
Figure 2 ORTEP plots of the X-ray crystal structures of inhibitors I and II. Displacement ellipsoids were drawn at 50% probability level. 23),(24.
WL experiments
WL experiments were performed on MS samples with the percentage composition of: 0.001 C; 0.242 Si; 0.628 Mn; 0.354 Na; 0.182 Al; 1.339 Cr; 0.149 Mo and Fe balance. The samples, with a rectangular shape of 13 × 10 × 0.5 mm, were represented in weight percentage (wt.%). Prior to the measurements, they were abraded by a series of emery papers (grades 120, 400 and 2000), washed with distilled water, degreased with ethanol, and finally dried at room temperature. After being accurately weighed by an analytical balance with a sensitivity of ±0.1 mg, the MS samples were immersed in a beaker containing 25 mL of an acidic solution, without and with inhibitors, at different concentrations. The temperature was controlled, at 298 K, by a water thermostat. The aggressive solutions were exposed to air. After immersion for 4 h, the corrosion products were completely removed. The samples were rinsed with distilled water, dried, and then re-weighed, in order to determine WL. W and IE% values were calculated according to the following equations:
where Δm (mg) is the weight loss, S (cm2) is the area, t (h) is the immersion period, and W0 (mg/cm-2/h-1) and W (mg/cm-2/Vh-1) are the MS corrosion rates, without and with inhibitors, respectively.
Electrochemical measurements
The electrochemical measurements were carried out in a conventional three-electrode cylindrical glass cell. The WE, in the form of a disc cut from MS, had a geometric area of 1 cm2. A SC and Pt were used as RE and AE, respectively. The temperature was thermostatically controlled at 298 K. Before measurements, the WE was mechanically polished, degreased with ethanol, rinsed several times with distilled water and dried. The freshly polished electrode was immersed in the test solution, at natural E, for 30 min, until a steady state was reached.
PPD and EIS measurements were performed using a ZRA GAMRY-reference 3000 potentiostat/galvanostat, at a scan rate of 1 mV/s-1, in the E range from -800 to -200 mV. The IE% was determined from the following equation:
where Icorr(0) and Icorr(inh) are the corrosion current densities, with and without inhibitors, respectively, which were determined by the extrapolation of anodic and cathodic Tafel lines to Ecorr. Before all impedance measurements, the WE was immersed for 1 h in the acidic solution. EIS was performed at OCP, over a frequency range from 10 kHz to 10 mHz, with a 10 mV peak-to-peak amplitude, using the AC signal. The IE% for both inhibitors was calculated using the following equation:
where Rct(0) and Rct(inh) are the charge transfer resistance without and with inhibitors, respectively.
Computational studies
The two molecular geometries were fully optimized in the acidic solution, at the DFT level of theory. Theoretical calculations were performed using the ADF 2014.02 program package 25. Electron correlation was treated within the VWN parametrization 26. The hybrid type B3LYP functional was used for all calculations 27),(28. The atomic electronic configurations were described by a triple-ζ STO basis set for H 1s, C 2s and 2p, N 2s and 2p, and O 2s and 2p, augmented with a 3d single-ζ polarization for C, N and O atoms, and with a 2p single-ζ polarization for H atoms. The vibrational frequency calculations were performed on all the optimized geometries, so as to verify that these structures corresponded to true minima on the MS surface E energy 29),(30.
The solvent effect, using COSMO-RS, which was developed by Klamt and co-workers 31, was studied. Representations of the orbitals and molecular structures were done using the ADF GUI 25. To compare the chemical reactivity of inhibitors I and II, some quantum chemical parameters were calculated, such as: HOMO; LUMO; ∆E; µ; χ; IP; ղ; σ ; and ∆N from the inhibitors to the metal surface 32.
Results and discussion
WL
The effect of the tested inhibitors, with different concentrations, in 0.5 M H2SO4, on MS corrosion was studied by WL, at 298 K, after 4 h of immersion. The corresponding MS W and IE% values are shown in Table 1.
Table 1 MS WL data and corresponding IE%, in different concentrations of compounds I and II, at 298 K.
| Inhibitors | Cinh (mM) | W (mg/cm-2/ h-1) | IE % |
| Blank | 0 | 1.15 | - |
| Inhibitor I | 0.1 | 0.87 | 24.34 |
| 0.2 | 0.81 | 29.54 | |
| 0.5 | 0.67 | 41.73 | |
| 1 | 0.50 | 56.52 | |
| 2 | 0.45 | 60.86 | |
| 5 | 0.29 | 74.78 | |
| Inhibitor II | 0.1 | 0.87 | 24.34 |
| 0.2 | 0.85 | 26.08 | |
| 0.5 | 0.58 | 49.56 | |
| 1 | 0.52 | 54.78 | |
| 2 | 0.25 | 78.26 | |
| 5 | 0.18 | 84.34 |
As shown in Table 1, in an uninhibited solution, W value was 1.15 mg/cm-2/h-1. However, after adding compounds I and II, W values were greatly decreased with an increase in both inhibitors concentration, from 0.1 to 5 mM. Consequently, the inhibitors adsorption onto the MS surface, and its coverage, also increased, which enhanced their IE%. 33. The maximum and minimum IE% values for inhibitor II were estimated to be 84.34 and 24.34%, at concentrations of 5 and 0.1 mM, respectively. On its turn, the compound I exhibited IE% values of 74.78 and 24.34%, at 5 and 0.1 mM concentrations, respectively. Therefore, both compounds I and II inhibited MS corrosion in 0.5 M H2SO4. However, compound II was found to be slightly more effective than I, probably because it had the benzene ring that encouraged a stronger interaction between it and the metal, resulting in its better adsorption.
OCP
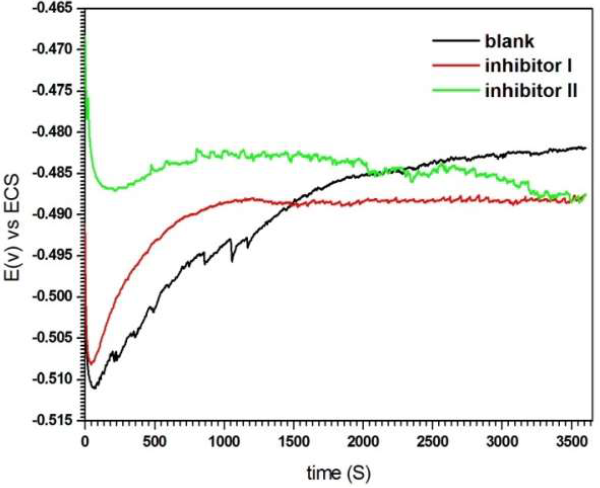
Fig. 3 shows OCP evolution, as a function of time, for the solutions without and with compounds I and II, at the concentration of 5 mM.
In the solutions with inhibitors, the steady state was achieved in about 10 min, while in the blank solution it was achieved in approxim. 30 min. The electrode E finally became stable, which suggests the accomplishment of the steady state, where a dynamic equilibrium exists between the corrosion product deposition on the MS surface and its dissolution. It should be noted that OCP has shifted to more negative values in the inhibitors presence (-488 mV vs. SC electrode).
Polarization curves measurements
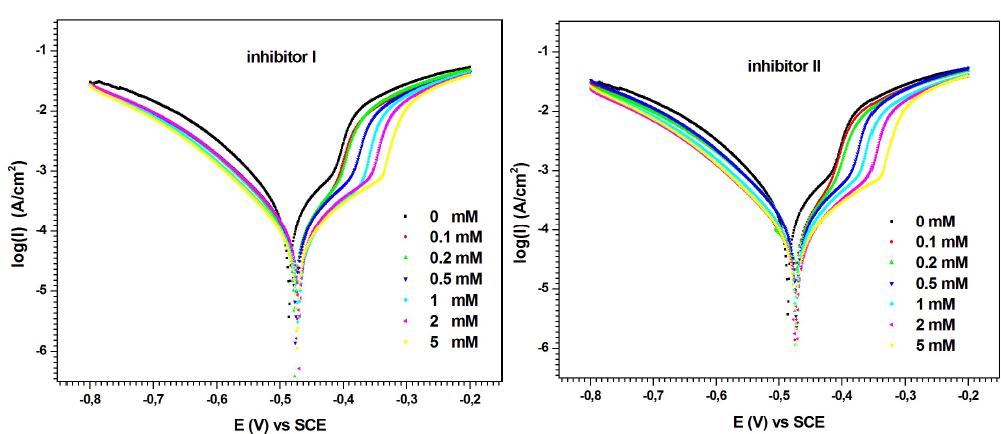
MS anodic and cathodic polarization behavior with and without inhibitors I and II, in 0.5 M H2SO4, at 298 K, for 30 min, is shown in Fig. 4. Various corrosion parameters, such as Icorr, Ecorr, βa, βc and IE%, are given in Table 2.
Table 2 shows that Icorr decreased with increased concentrations of compounds I and II. Its lower value was obtained at 5 mM of both inhibitors.
Table 2 Studied MS electrochimical parameters at various concentrations of inhibitors I and II, in 0.5 M H2SO4, at 298 K.
| Cinh (mM) | E corr (mV) | I corr (μA/cm-2) | βa (mV./dec-1) | βc (mV/ dec-1) | IE (%) | |
| Blank | 0 | -485 | 362 | 119.2 | 144.2 | - |
| Inhibitor I | 0.1 | -474 | 185 | 104.3 | 140.8 | 49.17 |
| 0.2 | -477 | 177 | 104.0 | 138.7 | 51.10 | |
| 0.5 | -475 | 161 | 104.6 | 135.6 | 55.52 | |
| 1 | -471 | 84.3 | 93.9 | 122.4 | 76.71 | |
| 2 | -472 | 81.3 | 99.9 | 122.0 | 77.54 | |
| 5 | -473 | 78.7 | 108 | 121.1 | 78.25 | |
| Inhibitor II | 0.1 | -475 | 240 | 107.6 | 145.8 | 33.70 |
| 0.2 | -474 | 229 | 107.5 | 147.0 | 36.74 | |
| 0.5 | -472 | 170 | 101.1 | 133.2 | 53.03 | |
| 1 | -474 | 117 | 99.8 | 130.4 | 67.68 | |
| 2 | -472 | 104 | 100.5 | 125.8 | 71.27 | |
| 5 | -472 | 76.7 | 108.0 | 121.1 | 78.81 |
Consequently, the compounds IE% increased with their higher concentrations, which was due to their stronger adsorption onto the corroded MS surface 34.
On the other hand, according to the polarization curves (Fig. 4), the higher concentrations of inhibitors I and II promoted a decrease in both anodic and cathodic Icorr, with a slight Ecorr shift towards the anodic direction. These results show that the inhibitors addition slowed MS half-cells corrosion reactions. However, their impact was more pronounced on the anodic reactions 35),(36. In other words, the studied compounds I and II can be classified as mixed-type inhibitors, with a major control over the metal dissolution anodic reaction.
As seen in Table 2, PDP measurements show that both inhibitors achieved practically the same IE%, at a concentration of 5 mM. However, at lower concentrations (0.1 to 2 mM), compound I was a better corrosion inhibitor than II. For example, at the lowest concentration (0.1 mM), compound I showed an IE above 49.17%, whereas that of compound II was below 33.7%.
EIS
Fig. 5 shows the Nyquist diagrams for MS in 0.5 M H2SO4, without and with compounds I and II, at different concentrations. The electrochemical parameters derived from the Nyquist diagrams are given in Table 3.
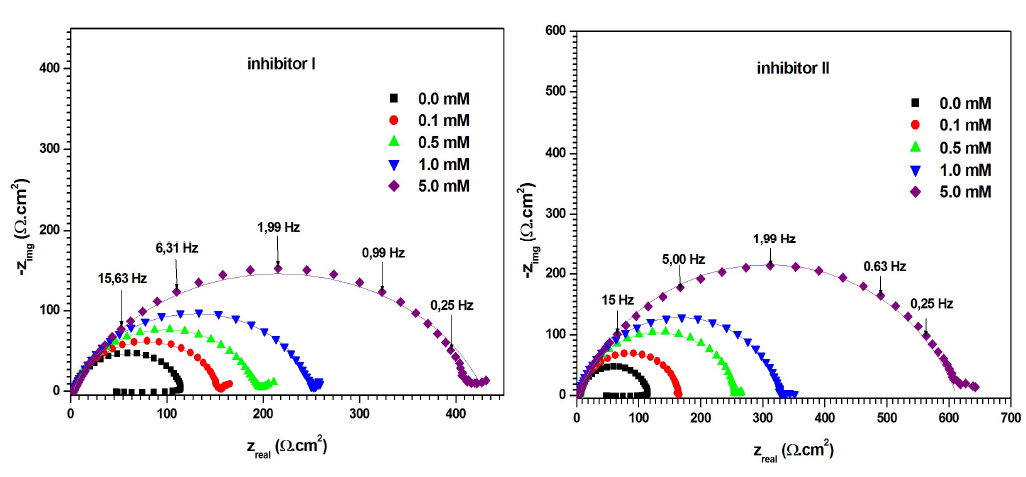
Figure 5 Nyquist diagrams for MS in 0.5 M H2SO4, without and with inhibitors I and II, in different concentrations, at 298 K (solid lines show fitted results).
Fig. 5 shows that the Nyquist diagram obtained for the blank solution consists of a capacitive loop, with a large diameter at high frequencies (related to the Cdl behavior, and Rct of the corrosion process), followed by a small inductive loop at a low frequency. As mentioned by Hsu and Mansfeld 37, the low frequency inductive loop may be the result of the relaxation process obtained by FeSO4 adsorption onto the electrode surface. It might be also attributed to the passivated surface re-dissolution at low frequencies 38.
On the other hand, Nyquist diagrams, for inhibitors I and II in H2SO4, contain a capacitive loop at high frequency values, followed by a straight line at low frequencies. The high frequency capacitive loop is related to the corrosion process Rct. The low frequency straight line implies that MS corrosion in the 0.5 M H2SO4 solution was diffusion controlled 39. Clearly, the capacitive loops in the solutions with inhibitors were larger than in those without them, and increased progressively with higher concentrations of compounds I and II. Furthermore, the capacitive loops diameters were larger with inhibitor II than with I.
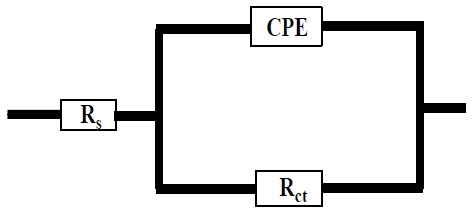
In Fig. 6, CPE 40 was introduced into the circuit, instead of a pure Cdl, in order to give a more accurate fit 41. This impedance element was calculated by the following equation 41:
where Y0 is the constant, j is the imaginary number (j2 = -1), ω is the angular frequency and n is the coefficient. Cdl can be calculated using the following equation 42:
Table 3 shows that Rct increased, while Cdl decreased, at higher inhibitors concentrations.
Table 3 Impedance measurements and IE% for MS corrosion in 0.5 M H2SO4 with various concentrations of inhibitors I and II, at 298 K.
| Cinh (mM) | R s (Ω.cm 2 ) | R ct (Ω.cm2) | n | Y0 (Sn.cm-2. Ω - ) | C dl (μF.cm-2) | EI % | |
| Blank | 0 | 3.481 | 113.8 | 0.8779 | 546 | 371 | - |
| Inhibitor I | 0.1 | 3.388 | 154.3 | 0.8581 | 422 | 268 | 26.2 |
| 0.5 | 3.272 | 194.9 | 0.8595 | 381 | 248 | 41.6 | |
| 1 | 3.76 | 251.1 | 0.836 | 316 | 192 | 54.6 | |
| 5 | 3.357 | 424.8 | 0.7669 | 341 | 189 | 73.2 | |
| Inhibitor II | 0.1 | 3.988 | 162.1 | 0.8955 | 316 | 223 | 29.7 |
| 0.5 | 4.893 | 254.6 | 0.8719 | 260 | 174 | 55.3 | |
| 1 | 4.050 | 327.7 | 0.8543 | 230 | 147 | 65.2 | |
| 5 | 3.868 | 614.0 | 0.7842 | 213 | 121 | 81.4 |
The increase in Rct may have been due to the formation of a protective film on the MS/H2SO4 interface. The higher Cdl value (371 μF/cm-2) without inhibitor may indicate that the MS surface was fully covered with H+. However, the decrease in Cdl values, with inhibitors, can be attributed to the increase in the electrical double layer thickness and/or to a reduction in the local dielectric constant, indicating that the inhibition mechanism functioned by adsorption onto the metal surface 43-45.
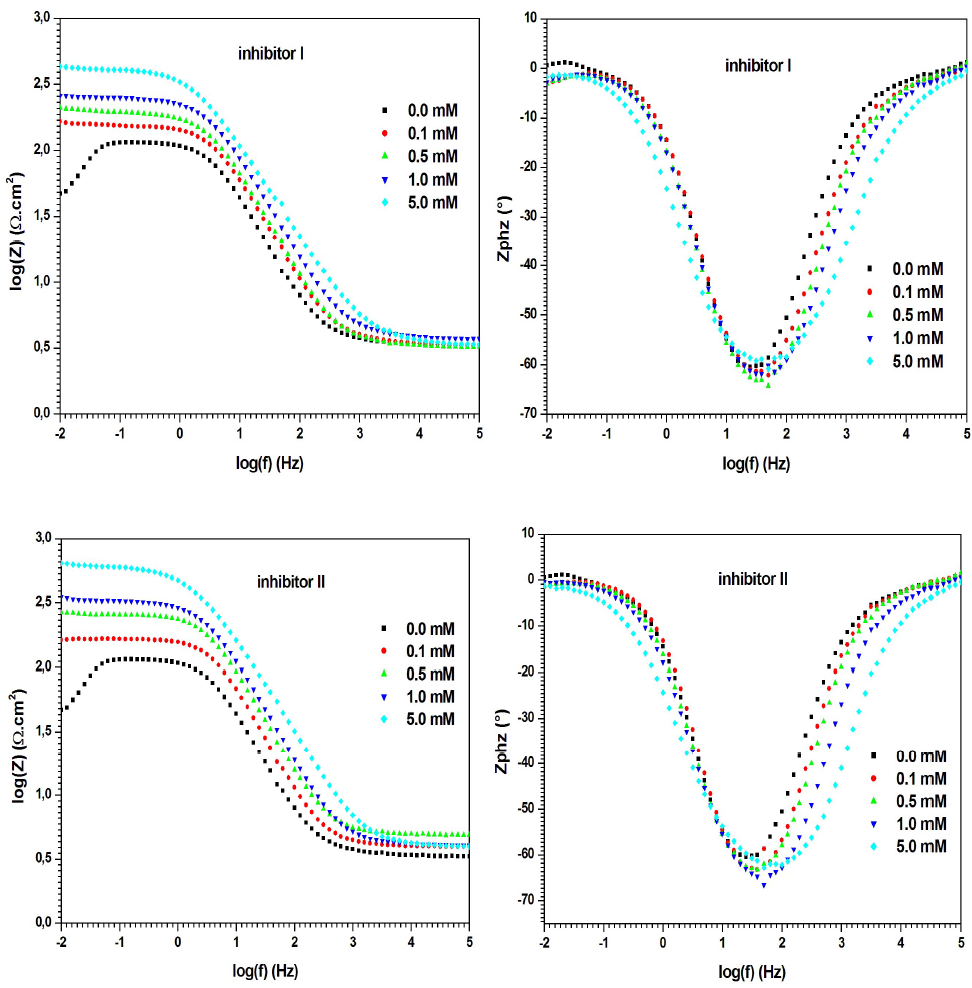
On the other hand, according to the Bode plots of the evaluated inhibitors (Fig. 7), Zmod rose when their concentrations increased, which indicates better IE% 46.
EIS recorded higher corrosion IE% for inhibitor II (81.4%) than that of I (73.2%), at their higher concentrations (5 mM), in 0.5 M H2SO4. These results are in good agreement with the ones obtained from PDP measurements.
Adsorption isotherms
The adsorption isotherms can give valuable information on the interaction between inhibitor and metal surface. In order to clarify the adsorption nature and strength, attempts were made to fit experimental data to various isotherms, including Frumkin’s, Langmuir’s and Temkin’s.
Plots of Cinh/θ against Cinh (Fig. 8) gave a straight line with a correlation close to 1, for inhibitors I (r = 0.9994) and II (r = 0.99899), suggesting that their adsorption onto the MS surface obeyed Langmuir’s adsorption isotherm, which can be expressed by the following equation 47:
where C inh is the inhibitors concentrations and θ is the surface coverage, which was determined from Tafel plot.
The K values were calculated from the straight lines intercepts with Cinh/θ axis, and are 7.604 × 10³ and 2.295 × 10³ M-1, for inhibitors I and II, respectively. These values reflect the formation of stable adsorbed inhibitors layers, and their strong interaction with the metal surface.
ΔG0 ads, onto the MS surface, is related to K in the following equation:
where R is the universal gas constant, T is the absolute temperature and 55.5 is the water concentration in the solution, expressed in moles 48.
Literature shows that ∆G° ads values: around ˗20 kJ/mol-1 or lower (more positive), indicate the inhibitor molecules electrostatic interaction with MS (physical adsorption) 49),(50; and below ˗40 kJ/mol-1, involve charge sharing between the inhibitor molecules and MS (chemisorption). Therefore, the calculated ∆G° ads values (-32.1 and -29.1 kJ/mol-1, for inhibitors I and II, respectively) indicate that the inhibitors adsorption onto the MS surface probably took place via both chemical and physical adsorptions.
Temperature effect on corrosion electrochemical parameters
The temperature effect on corrosion electrochemical parameters was determined from 298 to 328 K, without and with 1 mM of compounds I and II in 0.5 M H2SO4, using PDP measurements. Ea for MS corrosion in 0.5 M H2SO4 without and with 1.0 mM inhibitors was calculated using Arrhenius equation:
where k is the Arrhenius pre exponential factor and R is the gas constant. According to the data in Table 4, the plots of ln(Icorr) versus 1/T (Fig. 9) have almost straight lines, and all the r values are close to 1.
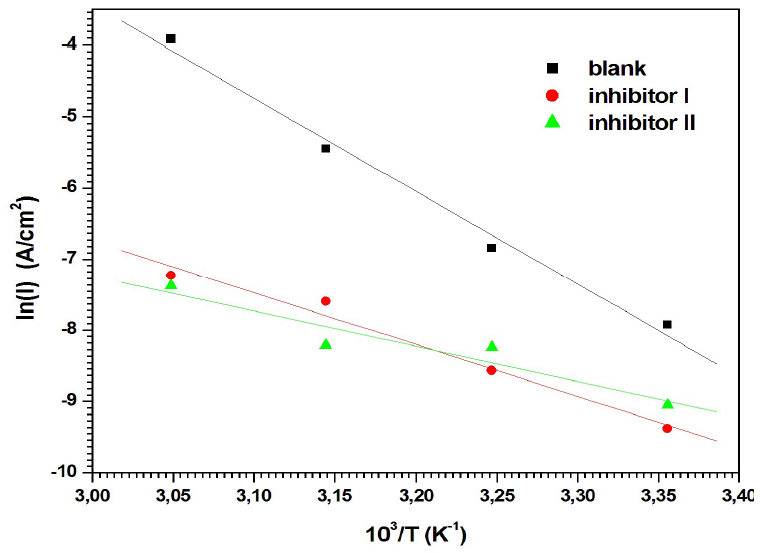
Figure 9 Arrhenius plots of ln(I) vs 103/T for MS corrosion in 0.5 M H2SO4 with inhibitors I and II.
Table 4 shows that Ea values, which were calculated from the slopes of the straight lines, were lower with inhibitors I and II than those without them. It is well recognized that the increase in the corrosion IE% with temperature corresponds to an apparently lower Ea value than that without inhibitors 51. This demonstrates that both inhibitors were adsorbed onto the metal surface, forming strong chemisorption bonds 52. The decrease in Ea value can be ascribed to the slow rate of the inhibitors adsorption onto the MS surface, with a resultant closer approach to equilibrium, during the experiments at higher temperatures 53.
Table 4 Temperature effect on corrosion electrochemical parameters in 0.5 M H2SO4, without and with inhibitors I and II, at a concentration of 1.0 Mm.
| T (K) | E corr (mV) | I corr (μA/cm-2) | IE % | E a (kJ/mol) | |
| Blank | 298 | -485 | 362 | - | 108 |
| 308 | -478 | 1072 | - | ||
| 318 | -478 | 4300 | - | ||
| 328 | -481 | 19900 | - | ||
| Inhibitor I | 298 | -471 | 84.3 | 76.79 | 60 |
| 308 | -478 | 190 | 82.27 | ||
| 318 | -477 | 502 | 88.32 | ||
| 328 | -477 | 724 | 96.36 | ||
| Inhibitor II | 298 | -474 | 117 | 67.67 | 41 |
| 308 | -479 | 268 | 75.00 | ||
| 318 | -484 | 271 | 93.69 | ||
| 328 | -479 | 625 | 96.85 |
Computational studies
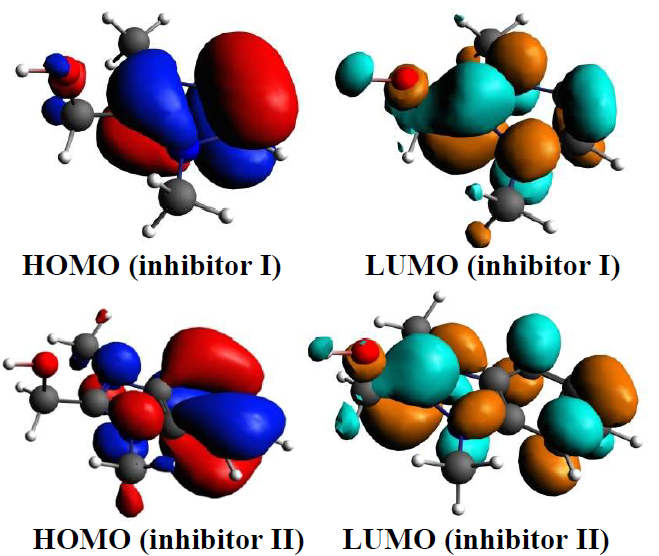
The quantum chemical parameters, such as EHOMO and ELUMO, ∆E and μ, have been determined for establishing possible relations between the structures of compounds I and II and their IE% (Table 5). The inhibitors optimized structures, HOMO and LUMO are shown in Fig. 10.
Table 5 Inhibitors I and II quantum chemical parameters calculated at DFT level, using the hybrid /B3LYP/TZP basis set obtained in the aqueous solutions.
| Inhibitors | Total energy (eV) | E HOMO (eV) | E LUMO (eV) | ∆E (eV) | μ (D) | A (eV) | I (eV) | η | σ | χ | ΔN |
|---|---|---|---|---|---|---|---|---|---|---|---|
| I | -129.716 | -7.528 | -1.409 | 6.119 | 20.944 | 1.409 | 7.528 | 3.059 | 0.326 | 4.468 | 0.716 |
| II | -178.125 | -7.167 | -1.988 | 5.179 | 20.702 | 1.988 | 7.167 | 2.589 | 0.386 | 4.577 | 0.747 |
The inhibitor molecules adsorption onto the metal surface was due to interactions between the heterocyclic compound π-electrons and the MS surface atoms vacant d-orbital. Generally, EHOMO is related to the molecules donation of electrons. Its high values indicate the inhibitors molecules strong donation of electrons to the appropriate acceptor, and also facilitate their adsorption (i.e. inhibition action). ELUMO is related to the molecules acceptance of electrons. Lower the ELUMO value, higher is the probability of the metal molecules to accept electrons from the inhibitors molecules. Also, higher ΔE values will provide low reactivity to a chemical species. On the contrary, its decreased values will render good IE%, because the energy to remove an electron from the LUMO will be low.
From Table 5, it is clear that inhibitor II has a higher EHOMO value than that of I. This means that the electrons donating capacity of compound II was higher than that of I. This led to its stronger adsorption onto the MS surface, thus increasing its IE%. Also, the quantum chemical calculations confirm that inhibitor II had ELUMO and ΔE lower values than those of I.
Furthermore, compound II had σ and Eea higher values and η and IP lower values than those of I, which confirms its higher IE%, which is in good agreement with the experimental observations. Also, it is clear that the ΔN values of both compounds were positive; therefore, electrons were transferred from both inhibitors to the metal atoms.
On the other hand, inhibitor II molecular surface area (imidazole is a part of benzimidazole) and weight higher values than those of I enhanced its effective coverage of the MS surface, leading to its stronger IE%.
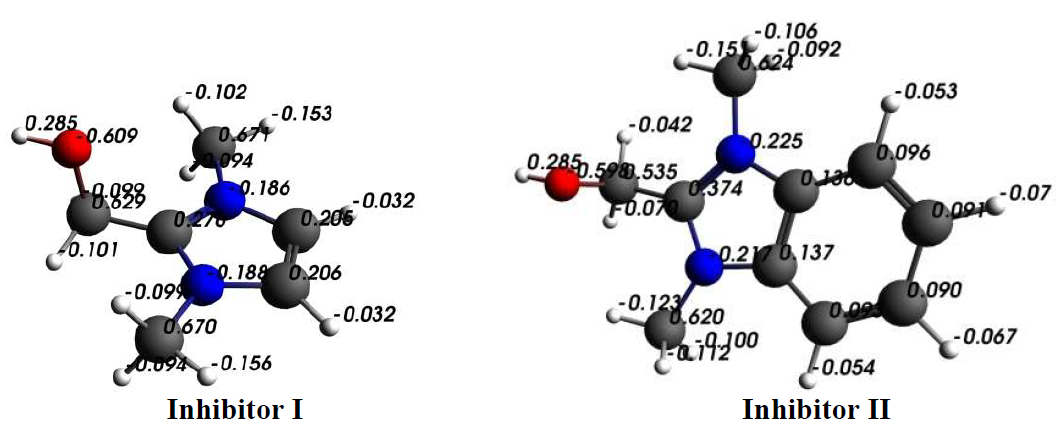
The comparison obtained from the Mulliken charges, on the optimized structure of both inhibitors atoms, shows that the active adsorptive O atoms were more negative (Fig. 11). So, these atoms acted as donors of electrons, and there was an electrostatic attraction between the MS surface and both inhibitor molecules.
Explanation for the inhibition mechanism
At the electrochemical and gravimetric experiments completion, H2SO4 with inhibitors I and II became yellow colored, with elapsed time.
In order to explain the apparition of this color, and the compounds inhibition mechanism, a concentrated H2SO4 solution with inhibitor I was exposed to air, after the experiments. During this period, the transformation of (dimOHmIm)+, I- to/ I- 3 ions occurred, producing a pronounced yellow color in the studied H2SO4 solution, and some crystals, which resulted from water evaporation. The crystals of the compound (dimOHmIm)+, I- 3 were isolated, and their structure was determined by an X-ray crystallographic analysis (Fig. 12).
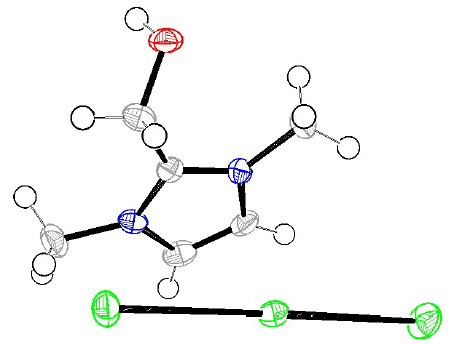
Figure 12 ORTEP plots of the X-ray crystal structure of (dimOHmIm)+, I- 3 Displacement ellipsoids were drawn at the 50% probability level 54.
The isolated compound (dimOHmIm)+ I- 3asymmetric unit contains a 2-hydroxymethyl-1,3-dimethylimidazolium cation and a tri-iodide anion. This compound production is explained by the following equations:
Compound I was ionized in the aqueous acidic solution, as shown in equation (10).
Then, the iodide ion was oxidized by molecular O2 dissolved in the H2SO4 solution, giving an equivalent of iodine that, in turn, formed 2 new moles of I- 3, through the reaction shown in equation 11. Then, I- 3exhibited a yellow color. The overall result of the electrochemical reactions (equations 10, 11 and 12) is expressed by equation 13 55.
The (dimOHmIm)+, I- 3 adsorption and inhibition effect in the H2SO4 solution can be explained as follows:
The I 3 − and/or I- ions are soluble, and gradually cloud-accumulated near the MS/solution interface. After being adsorpted, they created an excess negative charge towards the solution, and favored the (dimOHmIm)+ cation adsorption, through an electrostatic interaction with the negative charged MS surface.
In order to study the counter ion nature influence, and the time effect, on the IE% of compound I, PDP tests were performed using three electrolyte solutions with the inhibitor (5 mM): the first one was freshly prepared; and the second and third ones were aged for 48 and 72 h, respectively, at room temperature, before measurements.
As the solutions aged at room temperature, a yellow color, that characterizes the transformation of I- to I- 3 ions, began to be pronounced. The three solutions IE% are presented in Fig. 13.
It is clear from Fig. 13 that, after 72 h, IE% did not significantly change (78.25 and 76.48%, for the freshly prepared and 72 h aged solutions, respectively).
On the other hand, when (dimOHmIm)+ was adsorbed onto the MS surface, an electron was transferred from the inhibitor polar atom (O and/or N) to the metal surface, forming a coordinate type of bond.
This result means that both physical and chemical adsorption took place, and that there was a combined action between the inorganic anions I- and/or I 3 − and the organic cation (dimOHmIm)+.
Concerning the inhibitor II mechanism, we suggest that it may be the same from that of compound I.
Conclusion
The tested compounds can be effectively used as corrosion inhibitors for MS in H2SO4. The order of the compounds I and II IE%, as given by polarization measurements, is in good agreement with that obtained from EIS measurements and WL. Both inhibitors IE% increased with their higher concentrations. Potentiostatic polarization data indicated that these compounds influenced both cathodic and anodic processes, which means that they are mixed-type inhibitors. The compounds adsorption onto the MS surface obeyed Langmuir’s isotherm, and probably took place via both chemical and physical mechanisms. Quantum chemical calculations were carried out to compare the two inhibitors IE%. The results obtained from all the experimental methods were in good agreement.
Authors’ contributions
Mohamed Elhadi Said: conceived and designed the analysis; collected the data; inserted data or analysis tools; performed the analysis; wrote the paper. Mehdi Bouchouit: inserted data or analysis tools. Abdellah Zaiter: conceived and designed the analysis; inserted data or analysis tools; wrote the paper. Bilel Mezhoud: conceived and designed the analysis; performed the analysis. Sofiane Bouacida: conceived and designed the analysis; collected the data; wrote the paper. Aissa Chibani: conceived and designed the analysis; inserted data or analysis tools; wrote the paper. Abdelmalek Bouraiou: performed the analysis; wrote the paper.
Abbreviations
AC alternating current
ADF Amsterdam density functional
AE auxiliary electrode
-C = N- imine
Cdl double layer capacitance
CH3CN acetonitrile
-CHO aldeyde
Compound I (dimOHmIm)+,I-
Compound II (dimOHmBim)+,I- I- 3
COSMO-RS conductor-like screening model for realistic solvent
CPE constant phase element
(dimOHmBim)+,I- 1,3-dimethyl-2-hydroxymethylbenzimidazolium iodide inorganic anion
(dimOHmIm)+ 1,3-dimethyl-2-hydroxymethylimidazolium organic cation
(dimOHmIm)+,I- 1,3-dimethyl-2-hydroxymethylimidazolium iodide inorganic anion
(dimOHmIm)+, 1,3-dimethyl-2-hydroxymethylimidazolium containing an organic cation and a triiodide inorganic anion
D: Debye
E: potential
Ea: activation energy
Ecorr: corrosion potential
Eea: electron affinity
EHOMO: energy of the highest occupied molecular orbital
EIS: electrochemical impedance spectroscopy
ELUMO: energy of the lowest occupied molecular orbital
FeSO4: ferrous sulfate
GUI: graphical user interface
H2SO4: sulphuric acid
HCl: hydrochloric acid
HOMO: highest occupied molecular orbital
Icorr: corrosion current density
IE%: inhibition efficiency
IP: ionization potential
K: adsorption equilibrium constant
LUMO: lowest unoccupied molecular orbital
MeOH: methanol
MS: mild steel
-NH-: amine
OCP: open circuit potential
PDP: potentiodynamic polarization
r: correlation coefficient
RE: reference electrode
Rct: charge transfer resistance
R-OH: alcohol
Rs: solution resistance
SC: saturated calomel
SEM: scanning electron microscopy
STO: slater-type orbital
VWN: Vosko−Wilk−Nusair
W: corrosion rate
WE: working electrode
WL: weight loss
Zmod: peaking off impedance mode
Symbols definitions:
βa: anodic Tafel slope
βc: cathodic Tafel slope
∆E: gap energy
∆G° ads : standard free energy of adsorption
∆N: fraction of electrons transferred
µ: dipole moment
(: hardness
μF: microfarad
σ: softness
χ: electronegativity


