INTRODUCTION
Swimming is a sport activity with beneficial health effects and distinct characteristics compared to land-based activities (Tanaka, 2009). Apart from a large number of children and adolescents participating in it, swimming is nowadays gaining popularity among adults, who become involved in swimming training for health or even competitive reasons.
Athletes over 35–40 years of age are usually referred to as ‘master', ‘veteran' or ‘senior' athletes and regional, national, and world championship events exist which cater for the full range of athletic disciplines and exercise types (track and field, cycling, weightlifting, swimming) (Lazarus & Harridge, 2017).
The master athletes systematically train and compete. Those athletes can still achieve extremely high levels of performance. This is both because they are usually able to maintain high levels of endurance exercise and because they exhibit a remarkable level of physical and physiological function when compared to their sedentary peers (Tanaka & Seals, 2003; Lazarus & Harridge, 2017). Master athletes require the continued attention of sports scientists and exercise physiologists if their performance limits are extended (Lepers & Stapley, 2016).
Plenty of research has been carried out on performance impairment by master swimmers in the last decade (Donato et al., 2003; Bongard, McDermott, Dallal, & Schaefer, 2007; Tanaka & Seals, 2008; Baker & Tang, 2010; Medic, Young, & Medic, 2011; Medic, Young, & Grove, 2013; Rubin, Lin, Curtis, Auerbach, & Win, 2013; Knechtle, Barbosa, & Nikolaidis, 2019).
However, few studies contemplate the progression of the reality of master swimmers in swimming events. To analyse the competitive level, it is important to analyse these results by calculating some variables, such as the level of global participation in certain distances and its chronometric evolution. Arellano, Pardillo, and Gavilán (2002) and Silva et al. (2007) refer to the importance of the statistical results in terms of variables such as distance, allowing the development of prediction equations between the variables and the final time of proof.
Swimming is advantageous for adult subjects once it is a medically safe and non–weight-bearing activity, enabling the participation of a large array of subjects, even those who may present limitations or other orthopaedic injuries (Rubin et al., 2013).
Based on the 5-year age group (35-39, 40-44, etc.) in which masters athletes compete, Medic, Starkes, and Young (2007) and Medic, Young, Starkes, Weir, and Grove (2009) found that the probability of participating in the U.S. national championships was significantly higher for masters swimmers and track and field athletes who were in their first or second year, on the other hand, was lower when they were in the fourth or fifth year of any 5-year age category. The participation concerning the relative age effect was stronger for males than females and got stronger with age Medic et al. (2009).
Recently, Knechtle et al. (2019) analysed the age-related changes in sex difference in swimming on shorter distances, using the freestyle swimming records over 50 to 1500 m to examine age-related differences and sex difference in performance for age groups from 25-29 to 100-104 years. This study suggested that the age-related performance decline in swimming may be specific to the discipline, the sex and the length of the swimming event.
Thus, this study aims to:
quantify the participation of male master swimmers during ten seasons (2008/2009 – 2018/2019) in the national master summer open championship;
develop a prediction of results for the 2020/2021 season by checking the line of tendency to obtain new national records in the events of 50, 100, 200 and 400 m freestyle.
We hypothesised that there will be an increment of the participation of male master swimmers during these seasons, which will lead to a decrease in the swimming times, namely in the 50 and 100m events in the higher age groups.
METHODS
Participants
A retrospective and prospective observational research of publicly available data on male master swimmers throughout the National Master/Summer Open Championships (from 2008/2009 to 2018/2019) was selected. Swimmers (≥ 25 years-old, yo) were grouped into the age categories that progress in 5-year intervals, as follows:
Only the age groups in which there was no failure in the participation of swimmers were considered, namely, the ranges from A to H, the ranges from I to P were excluded. All participants in the mentioned age groups who finished the tests were included, therefore, 5,368 participations in freestyle events in different editions of national championships were included for analysis.
Procedures
Swimmer's official times between the season 2009/2010 and 2018/2019 in freestyle events (50-m, 100-m, 200-m, and 400-m), and according to each age category were retrieved. The data was obtained from a public and open-access website (Swimrankings, www.swimrankings.com) and analysed using a Microsoft Excel 2003 spreadsheet (Microsoft Corporation, Redmond, WA, USA). All swimming freestyle events were contested in a long course swimming pool (50-m).
The best time was recorded for each race of the selected age groups that took place in the last ten seasons of the National Master/Summer Open Championships (MSC).
All data were converted to seconds, and the polynomial regressions were calculated for each event as reported elsewhere (Silva et al., 2006; Silva et al., 2007). Thus, predictive curves were obtained for the season 2019/2020.
The resulting equation was Equation 1:
With:
y = the rate of increase or decrease in swimming performance;
x = variation depending on the year of events that one intends to estimate for 2021;
x = 13 (in 2020 there was no swimming competition).
RESULTS
Master swimming participation
Table 1 represents the number of participations in the last ten championship seasons in the distances of 50, 100, 200 and 400 m freestyle and the variation between years.
Table 1 Total number of participations in the events of (50, 100, 200 and 400-m) and the variation of participation in the last ten seasons
| 2008/2009 | 2009/2010 | 2010/2011 | 2011/2012 | 2012/2013 | 2013/2014 | 2014/2015 | 2015/2016 | 2016/2017 | 2017/2018 | 2018/2019 | Total | |
|---|---|---|---|---|---|---|---|---|---|---|---|---|
| Total | 317 | 339 | 416 | 330 | 344 | 484 | 602 | 515 | 604 | 701 | 716 | 5368 |
| Variation | 6,94% | 22,71% | -20,67% | 4,24% | 40,70% | 24,38% | -14,45% | 17,28% | 16,06% | 2,14% | 9,93% | |
| Relating to 2009 | 6,94% | 31,23% | 4,10% | 8,52% | 52,68% | 89,91% | 62,46% | 90,54% | 121,14% | 125,87% | 59,34% |
Table 1 demonstrates a very positive evolution in the participation of master swimmers in the last ten seasons in all freestyle events since an increase of 125,8% in the participations from 2008/2009 to 2018/2019 was observed. We can observe that it doubled the participation in all the competitions, being the intermediate category D and F, which have a more significant number of swimmers, in contrast to the categories G and H with less participation.
Table 2 shows that the highest number of participation was in the 2018/2019 season by presenting a total of 716 male swimmers, whereas the year with the least participation was 2008/2009 with 317 male swimmers. The event with the most significant number of participants was the 50 m freestyle in 2019 (221 swimmers), and the event with the least participants was the 400 m freestyle in 2009 (42 swimmers). Furthermore, the D age category presented the highest participation (920 male swimmers), while H was the one that registered the lowest number (324 male swimmers) over the past decade of the National Summer Championships.
Table 2 Number of participants in the last ten seasons of Master / Summer Open national championships (from 2008/2009 to 2018/2019) per event
| 2008/2009 | 2009/2010 | 2010/2011 | 2011/2012 | 2012/2013 | 2013/2014 | 2014/2015 | 2015/2016 | 2016/2017 | 2017/2018 | 2018/2019 | Total | |
|---|---|---|---|---|---|---|---|---|---|---|---|---|
| 50 m | 100 | 108 | 140 | 110 | 115 | 155 | 194 | 173 | 195 | 217 | 221 | 1,728 |
| 100 m | 100 | 107 | 110 | 98 | 97 | 136 | 172 | 157 | 176 | 212 | 217 | 1,582 |
| 200 m | 75 | 75 | 99 | 70 | 76 | 109 | 129 | 100 | 127 | 141 | 150 | 1,151 |
| 400 m | 42 | 49 | 67 | 52 | 56 | 84 | 107 | 85 | 106 | 131 | 128 | 907 |
| Total | 317 | 339 | 416 | 330 | 344 | 484 | 602 | 515 | 604 | 701 | 716 |
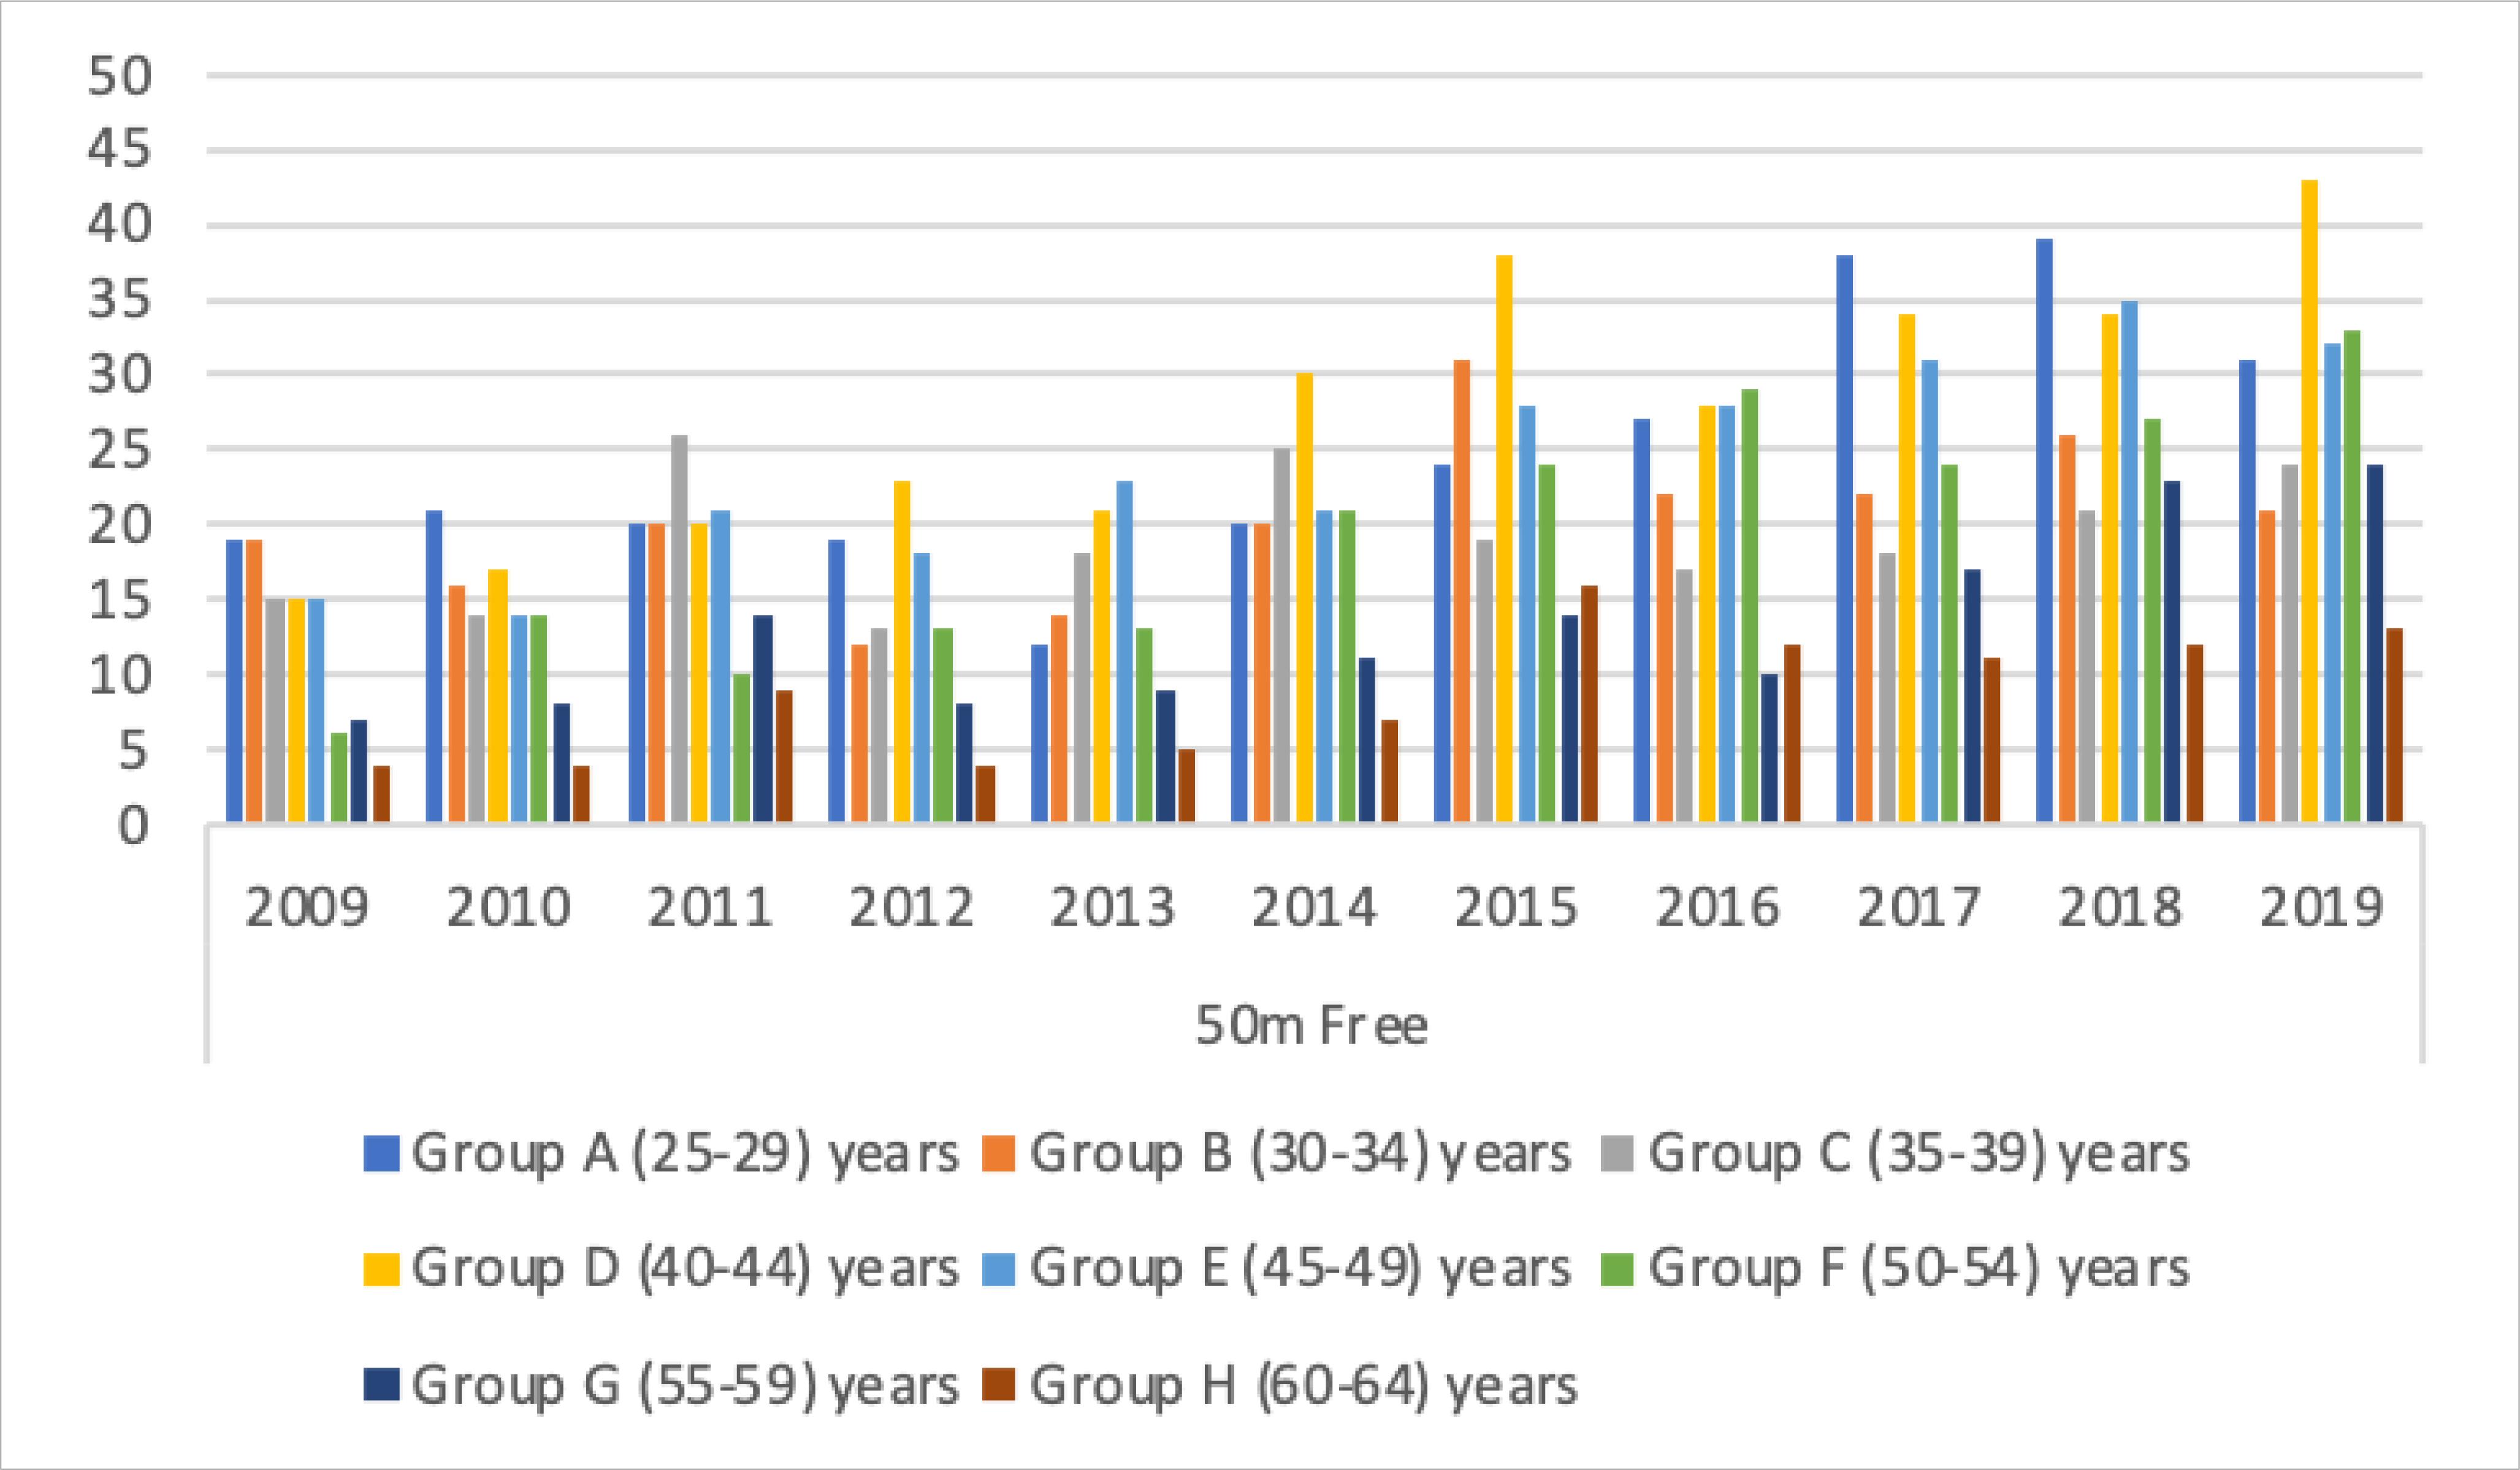
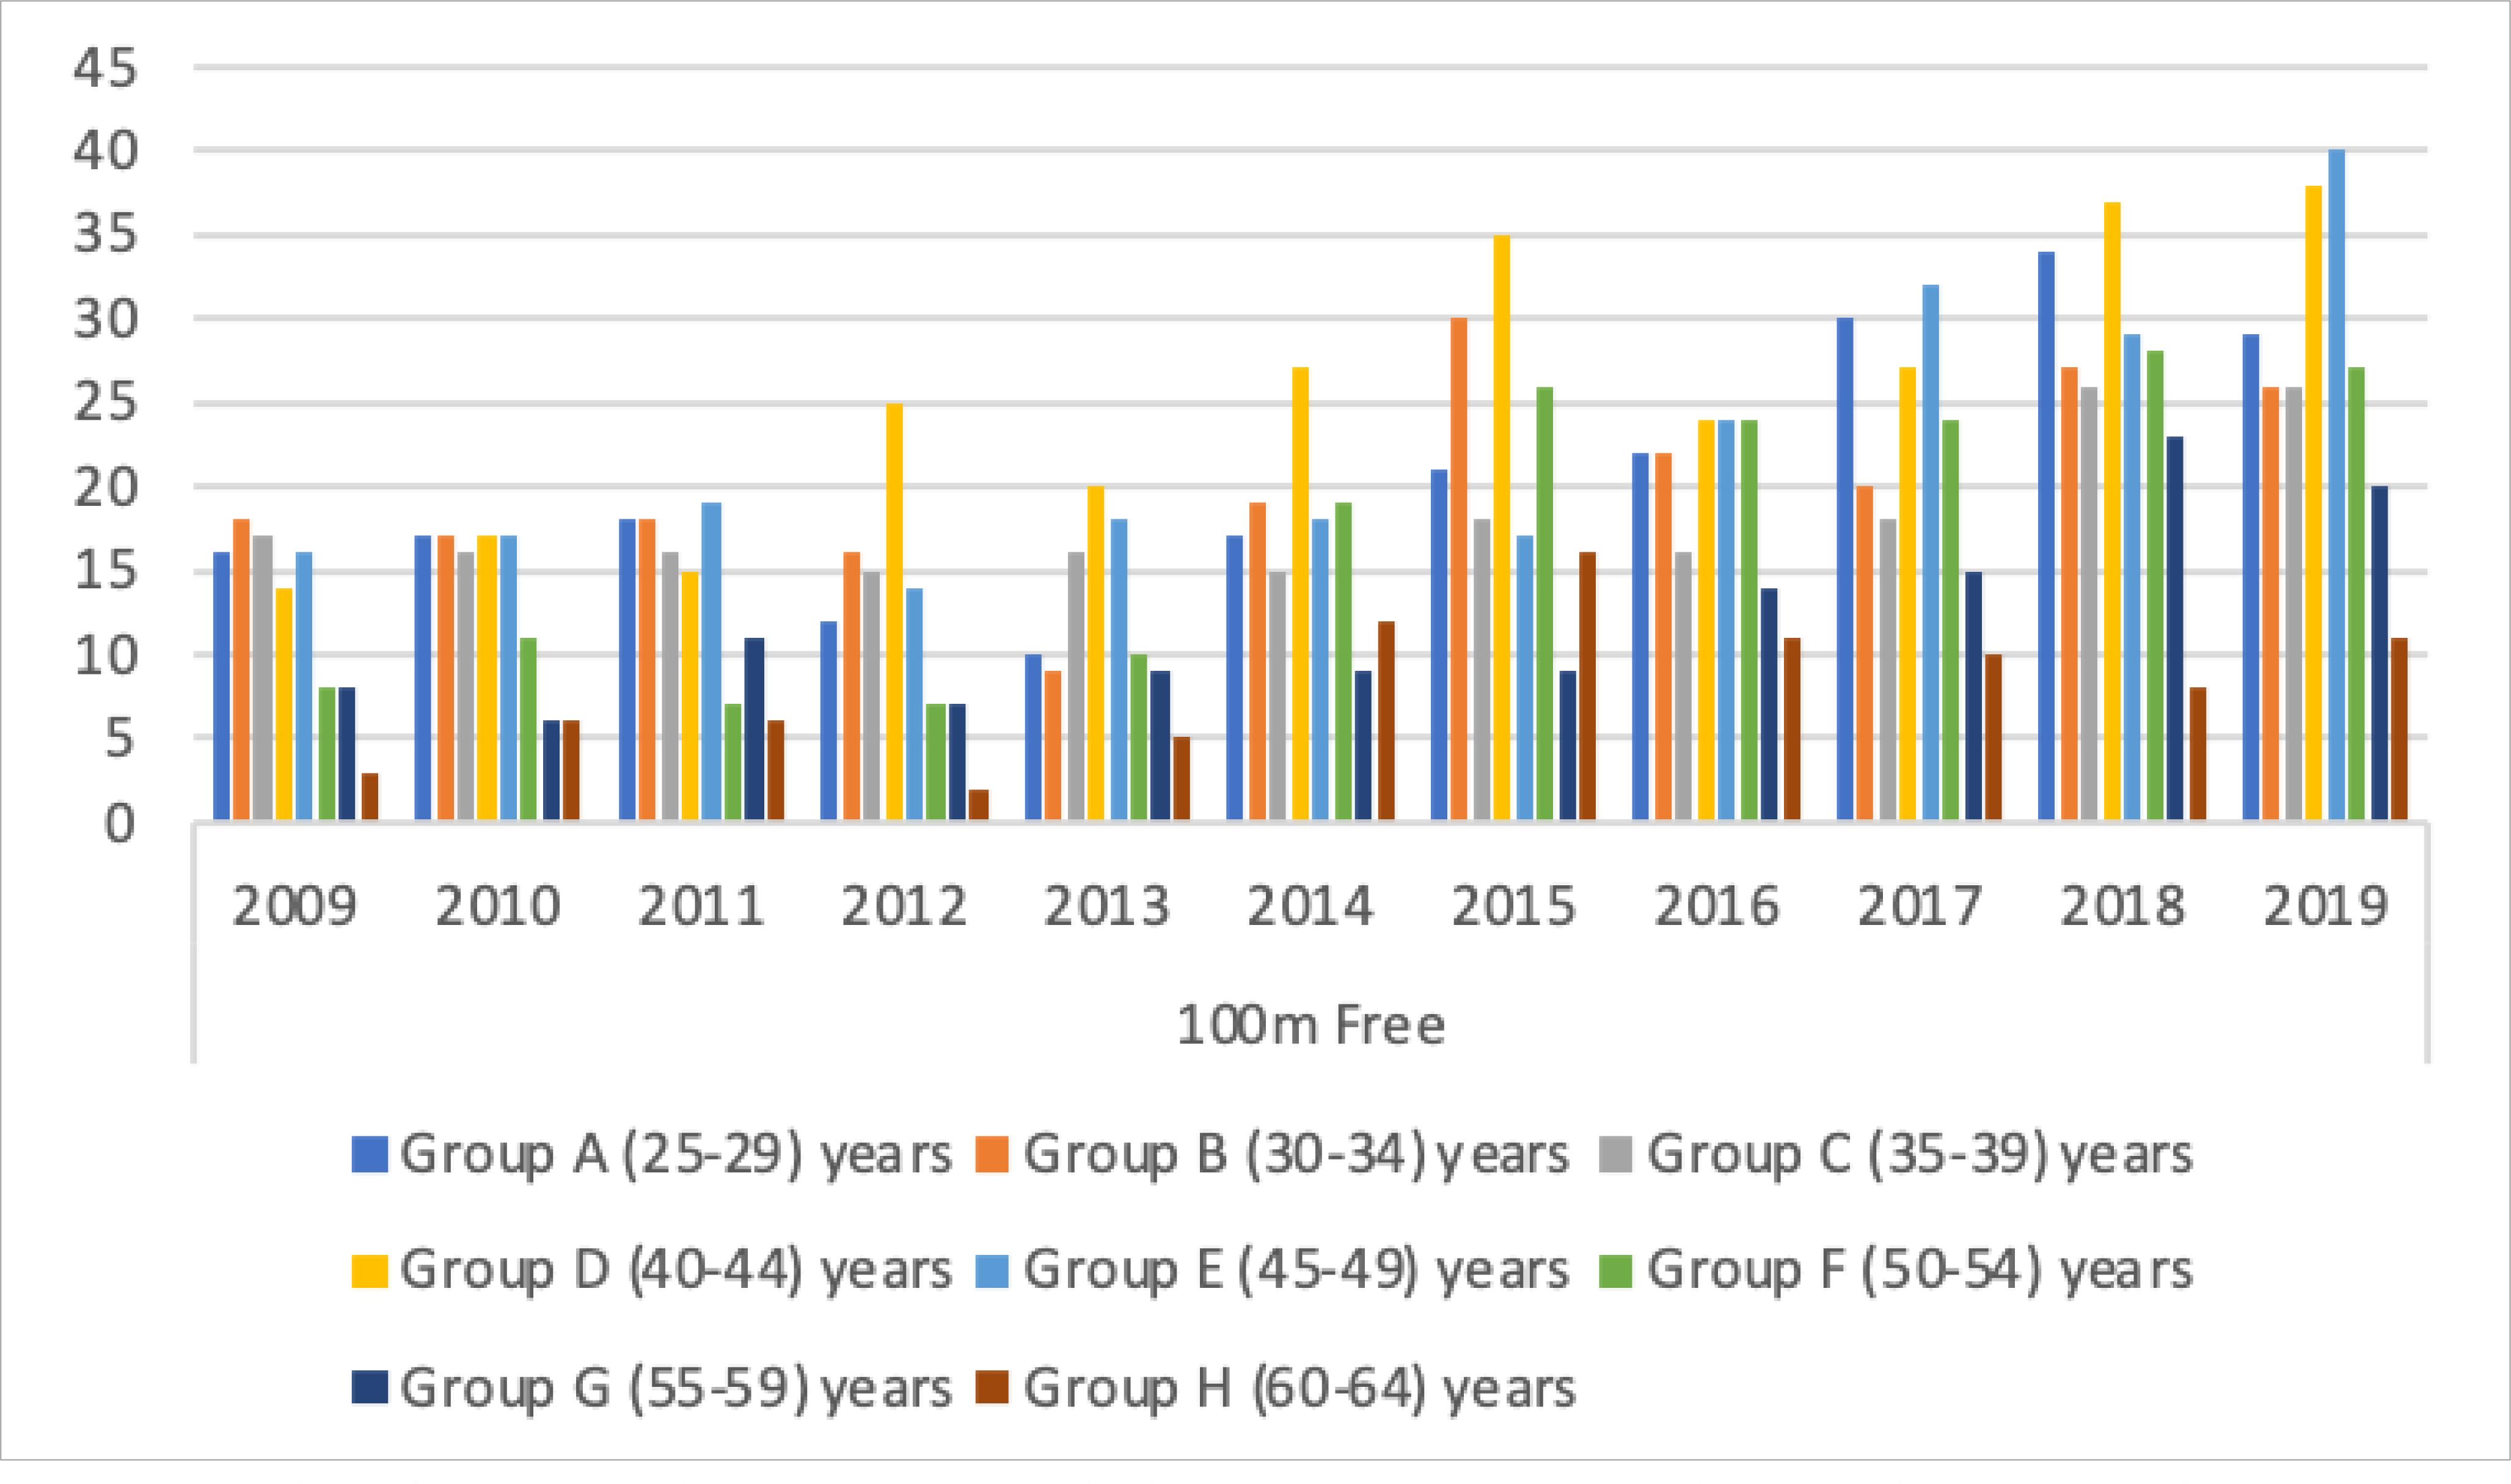
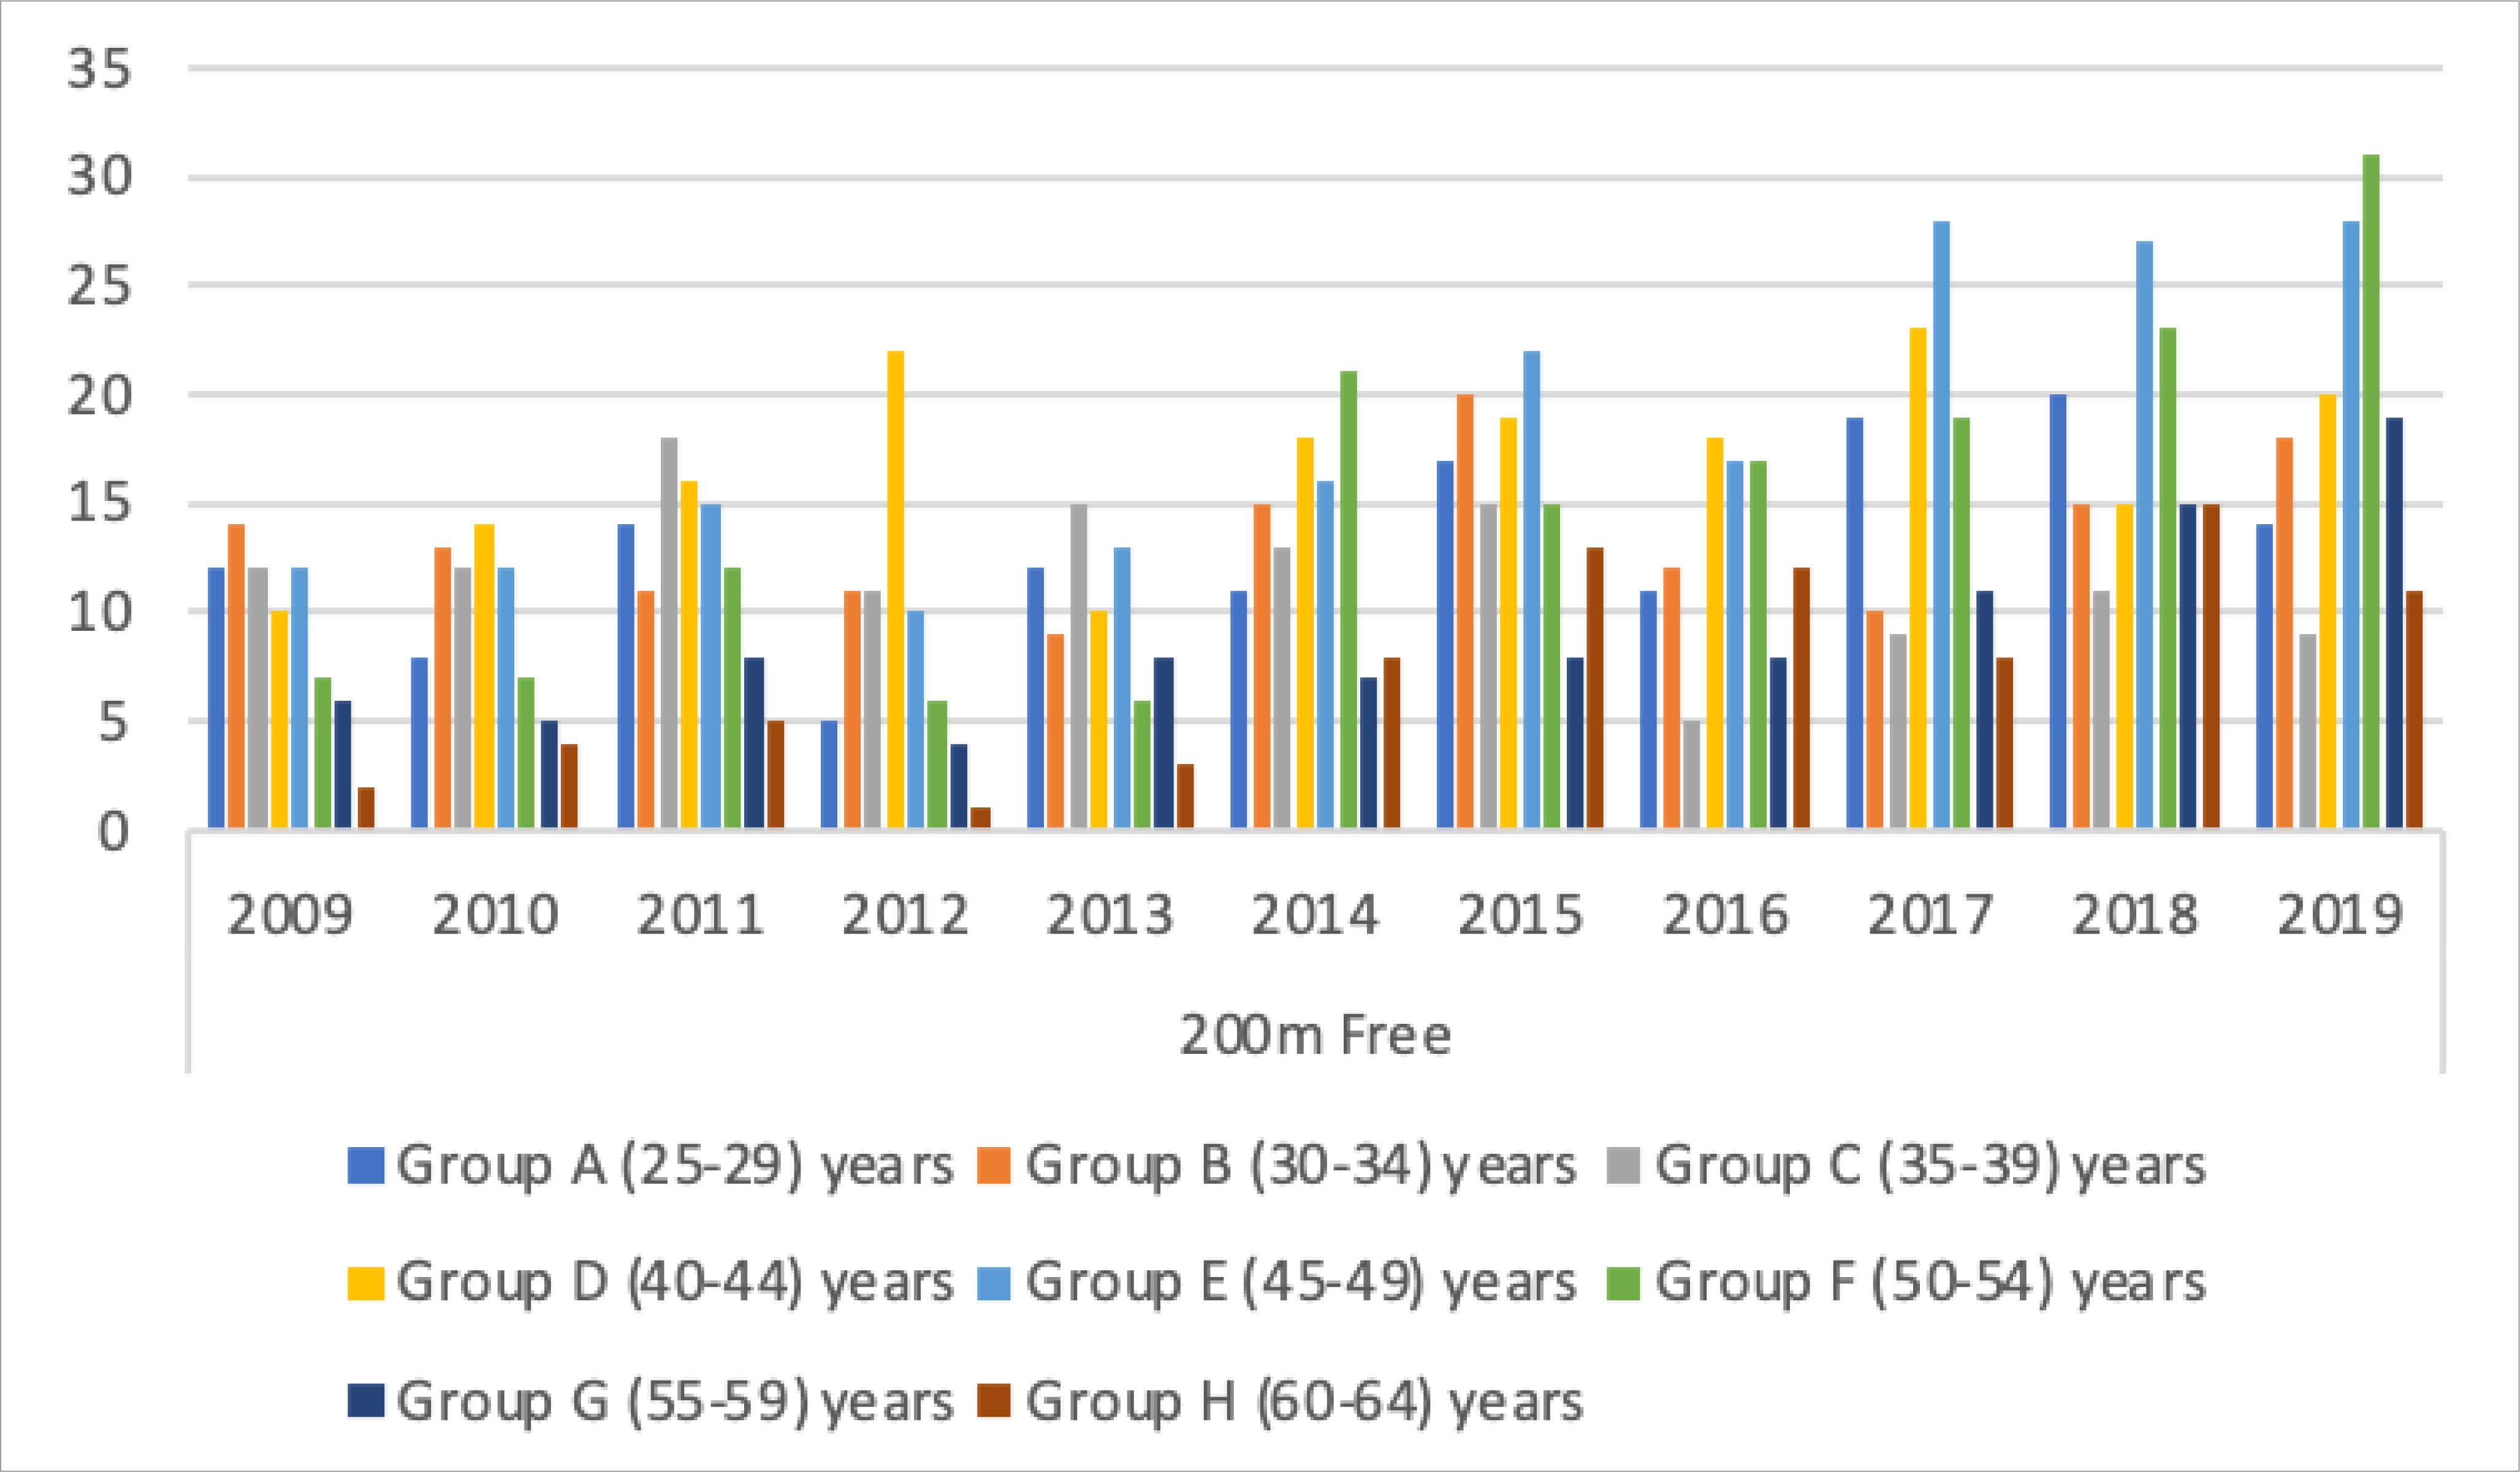
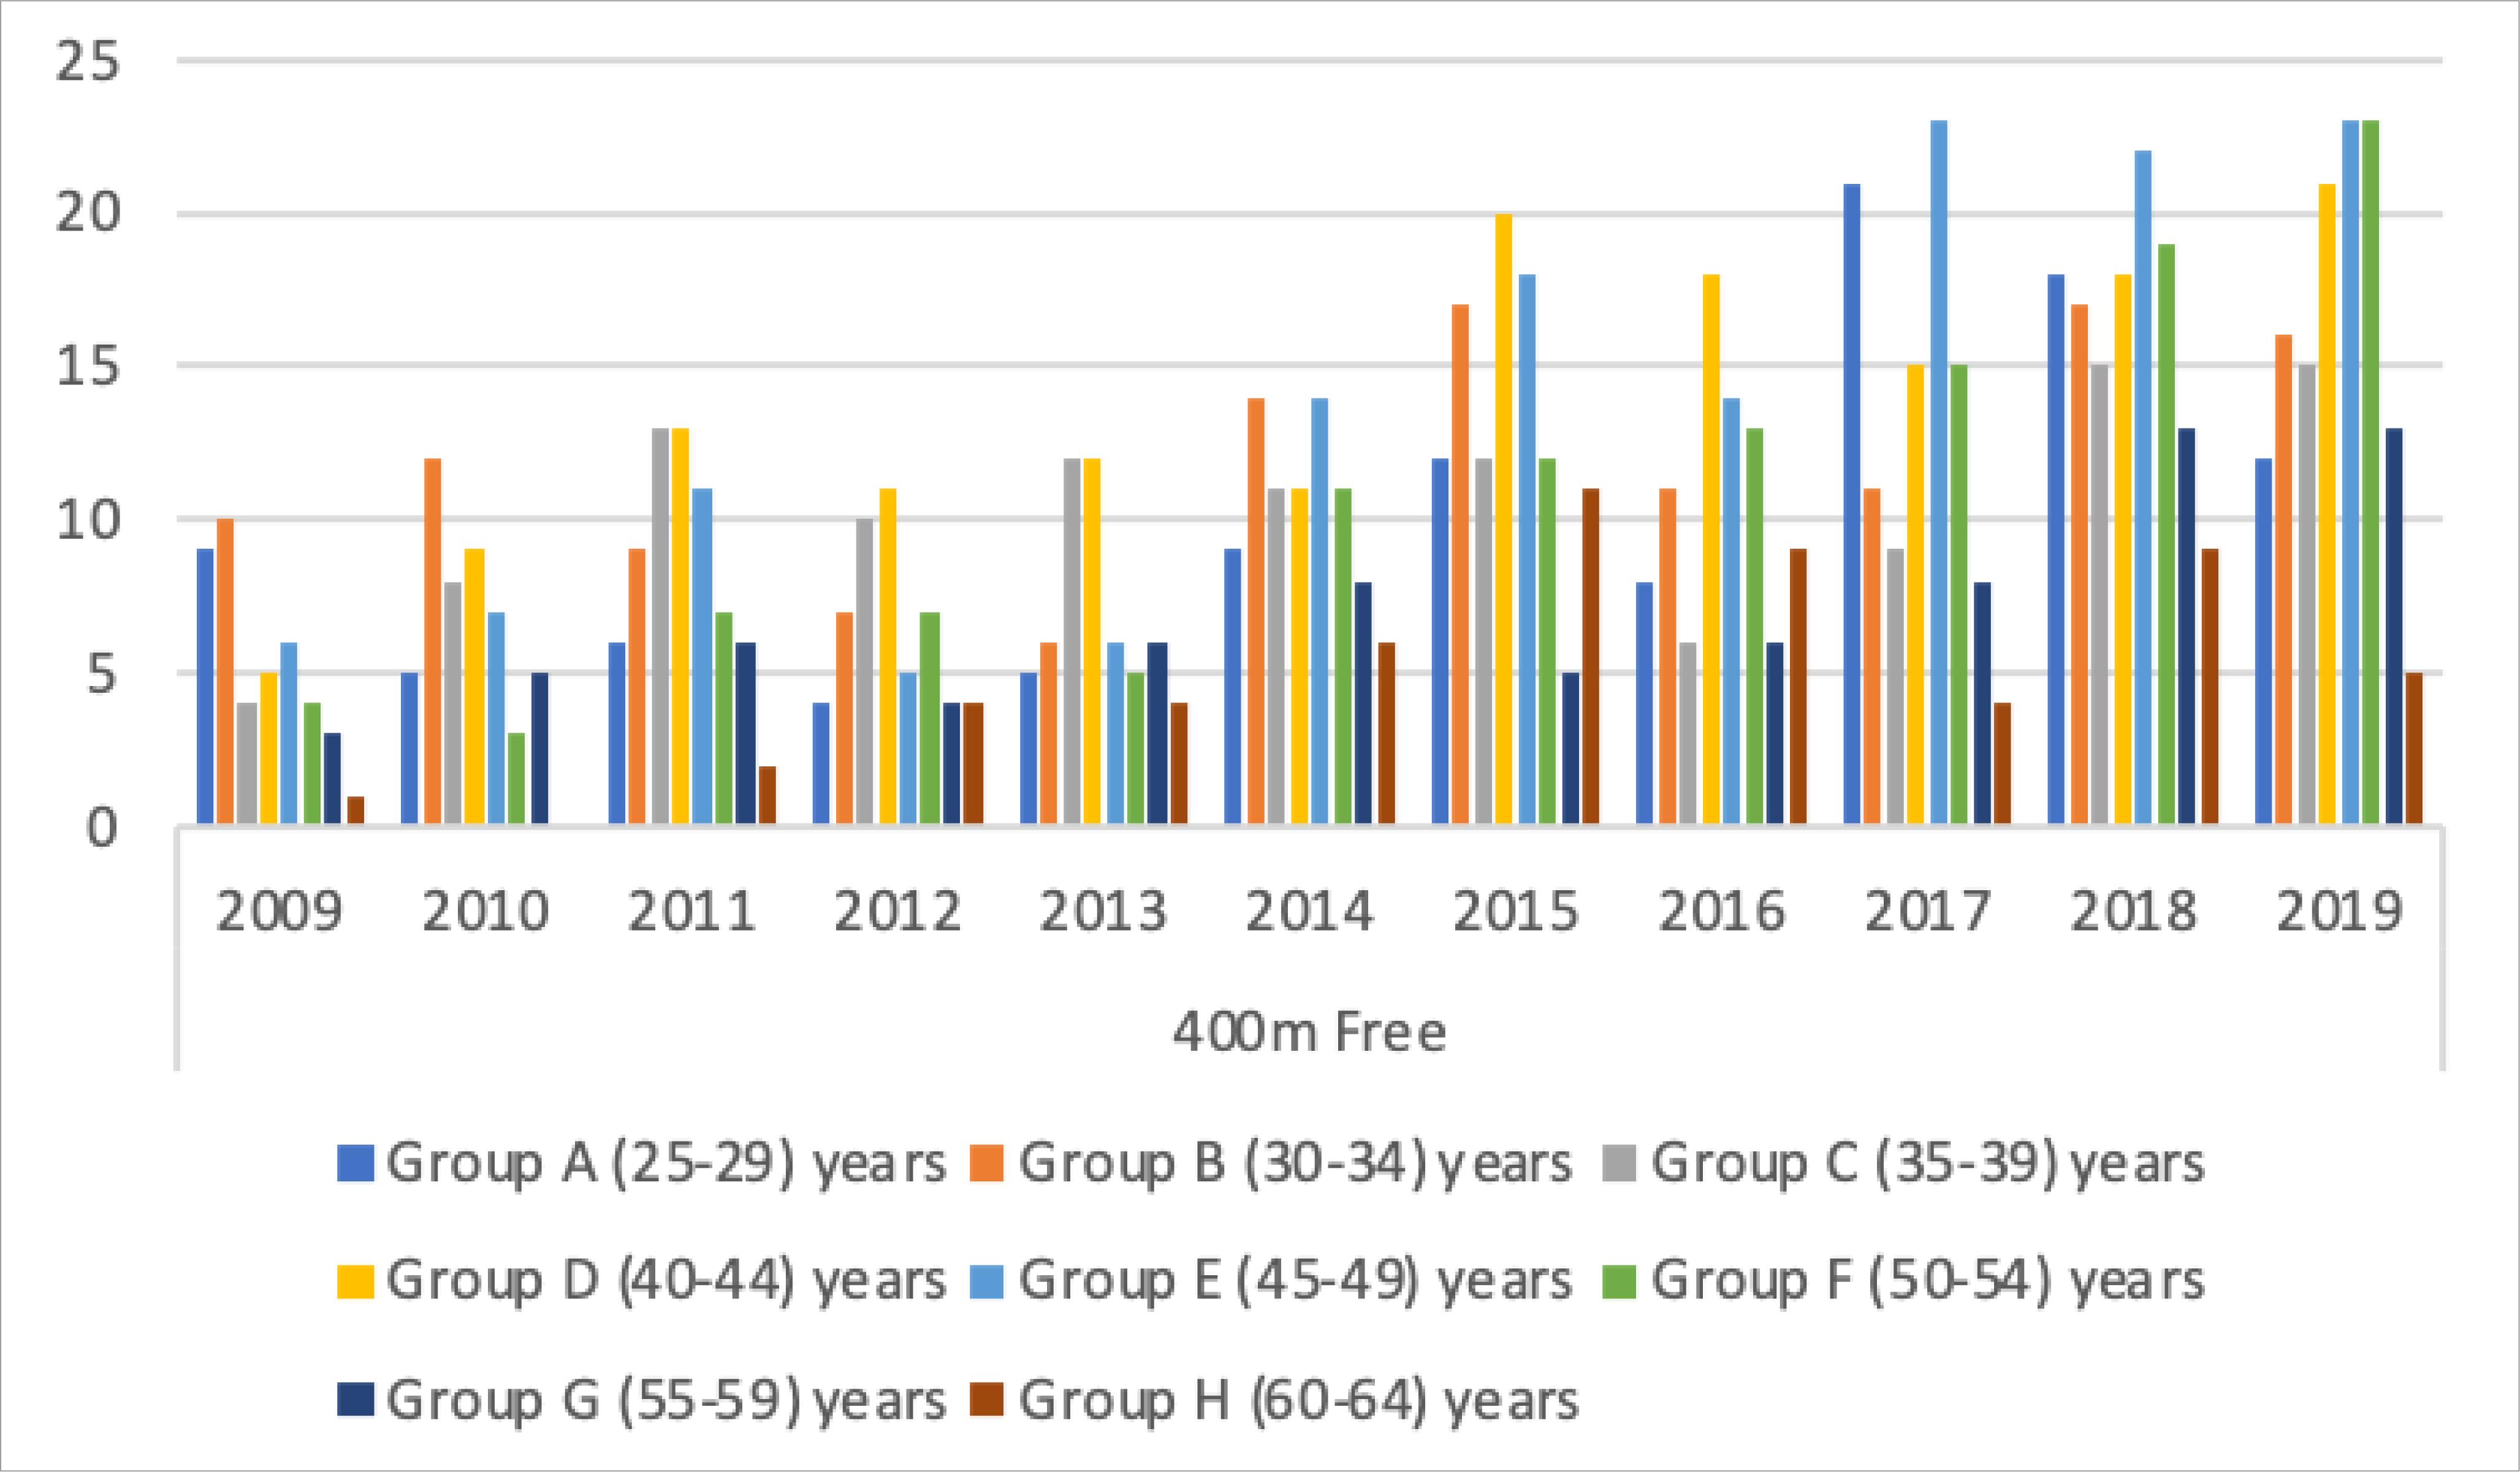
Figure 1 presents the number of participation in the MSC, according to each age category and the freestyle events (50 m, 100 m, 200 m, and 400 m), over the last ten seasons (from 2008/2009 to 2018/2019).

Figure 1 Number of participants by age category in the last ten master swimming championships in 50 m free.
In the 50 m (Figure 1) and 100 m (Figure 2) events, the smallest participation was in 2009 with 100 swimmers since the highest participation value appears in 2019 with 221 swimmers for the 50 m event. In these two events (50 and 100 m), regarding the age groups, the D group of swimmers (40-44 years old) showed higher participation with 303 swimmers, while the H group of swimmers (60-64 years old) showed only 97 swimmers.

Figure 2 Number of participants by age category in the last ten master swimming championships in 100 m free
The lowest participation in the 200 m (Figure 3) and 400 m (Figure 4) events was in 2009, with 75 and 42 swimmers, respectively. We can verify an alteration in the participation number between 50 and 100m events, compared with the relatively longest events of 200 m and 400 m, where the participants are mainly in the older age groups.
Analysis of predictions
The Table 3 show the predictive expressions for all freestyle events and age categories, as well as the trend line of prediction for results in the season of 202.
Table 3 Master prediction of all analysed freestyle events and age categories
| Event | AG | Equation | 2018/2019 | 2020/2021 | Trend |
|---|---|---|---|---|---|
| 50 m | A | y=-0,0127x2 - 0,0907x + 26,73 | X= 12; y= 23,19 | X= 13; y= 22,59 | (-) |
| B | y=-0,0357x2 + 0,2932x + 24,821 | X= 12; y= 23,74 | X= 13; y= 23,40 | (-) | |
| C | y=0,0058x2 - 0,1991x + 27,494 | X= 12; y= 25,94 | X= 13; y= 25,88 | (+) | |
| D | y=0,0315x2 - 0,6496x + 29,146 | X= 12; y= 25,88 | X= 13; y= 26,02 | (+) | |
| E | y=-0,0378x2 + 0,5452x + 25,828 | X= 12; y= 26,92 | X= 13; y= 26,52 | (-) | |
| F | y=0,0748x2 - 1,3121x + 32,466 | X= 12; y= 27,49 | X= 13; y= 28,04 | (+) | |
| G | y=-0,0061x2 - 0,4189x + 33,114 | X= 12; y= 27,20 | X= 13; y= 26,63 | (-) | |
| H | y=-0,061x2 + 0,5905x + 31,53 | X= 12; y= 29,82 | X= 13; y= 28,89 | (-) | |
| 100 m | A | y=-0,1182x2 + 1,0592x + 54,911 | X= 12; y= 50,60 | X= 13; y= 48,70 | (-) |
| B | y=-0,0695x2 + 0,9578x + 55,358 | X= 12; y= 56,83 | X= 13; y= 56,06 | (-) | |
| C | y=-0,2012x2 + 2,6097x + 52,886 | X= 12; y= 55,22 | X= 13; y= 52,80 | (-) | |
| D | y=0,0992x2 - 1,9392x + 66,564 | X= 12; y= 57,56 | X= 13; y= 58,11 | (+) | |
| E | y=-0,1839x2 + 2,3721x + 54,892 | X= 12; y= 56,87 | X= 13; y= 54,89 | (-) | |
| F | y=0,2061x2 - 3,0867x + 71,455 | X= 12; y= 64,09 | X= 13; y= 66,15 | (+) | |
| G | y=-0,0623x2 - 0,7807x + 75,911 | X= 12; y= 57,58 | X= 13; y= 55,23 | (-) | |
| H | y=-0,2162x2 + 2,2861x + 70,593 | X= 12; y= 66,89 | X= 13; y= 64,74 | (-) | |
| 200 m | A | y=0,0978x2 - 1,4534x + 128,62 | X= 12; y= 125,15 | X= 13; y= 126,25 | (+) |
| B | y=-0,57x2 + 7,5832x + 111,91 | X= 12; y= 120,82 | X= 13; y= 114,16 | (-) | |
| C | y=-0,5977x2 + 8,1057x + 111,76 | X= 12; y= 123,11 | X= 13; y= 116,12 | (-) | |
| D | y=0,2425x2 - 4,238x + 150,17 | X= 12; y= 134,16 | X= 13; y= 136,05 | (+) | |
| E | y=-0,3093x2 + 4,902x + 119,26 | X= 12; y= 133,58 | X= 13; y= 130,71 | (-) | |
| F | y=0,711x2 - 9,971x + 167,23 | X= 12; y= 149,96 | X= 13; y= 157,76 | (+) | |
| G | y=0,0328x2 - 4,544x + 179,11 | X= 12; y= 129,30 | X= 13; y= 125,58 | (-) | |
| H | y=-0,6668x2 + 5,4322x + 166,78 | X= 12; y= 136,06 | X= 13; y= 124,70 | (-) | |
| 400 m | A | y=0,234x2 - 2,401x + 277,93 | X= 12; y= 282,81 | X= 13; y= 286,93 | (+) |
| B | y=-1,3272x2 + 17,389x + 242,62 | X= 12; y= 260,2 | X= 13; y= 244,38 | (-) | |
| C | y=-0,8796x2 + 12,217x + 252,08 | X= 12; y= 272,85 | X= 13; y= 262,24 | (-) | |
| D | y=0,3544x2 - 7,951x + 323,74 | X= 12; y= 279,30 | X= 13; y= 280,27 | (+) | |
| E | y=-0,9879x2 + 15x + 248,41 | X= 12; y= 286,41 | X= 13; y= 276,45 | (-) | |
| F | y=1,872x2 - 23,992x + 368,79 | X= 12; y= 350,15 | X= 13; y= 373,79 | (+) | |
| G | y=-1,0333x2 + 2,9034x + 366,47 | X= 12; y= 252,55 | X= 13; y= 229,47 | (-) | |
| H | y=-1,0788x2 + 11,006x + 344,64 | X= 12; y= 321,36 | X= 13; y= 305,40 | (-) |
AG: age categories; A: 25-29 yo; B: 30-34 yo; C: 35-39 yo; D: 40-44 yo; E: 45-49 yo; F: 50-54; G: 55-59; H: 60-64 yo; Equation: x: variation depending on the year of events that one intends to estimate; y: rate of increase or decrease in swimming performance.
Regarding the polynomial trend lines, we can highlight that there will be a tendency to reduce the swim time in the 50m event in the following age categories: A, B, E, G and H. Thus, their prediction reveals a very positive evolution for 2021, meeting the best results of always in these 11 seasons of competition under analysis. Contrarily to the other age groups (C, D and F), no major improvements are predicted for the next year, some of the results being far from the best time seen in the last 11 seasons. Summing up the 50 m event, it is expected a marked improvement in the first and last AG (A) and (H), keeping the intermediate and even more participative AG without major differences in terms of improvements in their future periods. In the 100m event, a very positive evolution is expected for most AG (A, B, C, E, G and H), and several of these classes may have the best times ever for 2020/2021. In the opposite direction, only A, G, D and F appear, which are not expected to have changes in this event.
In summary, in the 100 m event, only two of the eight age categories analysed are not expected to have marked improvements. All the others showed an evolution with a large margin to achieve the best results ever in this distance and race. Regarding the 200 m and 400 m events, in the prediction for 2021, we can observe a very similar approach. So maybe in further seasons for the following AG: B, C, E, G and H, can be a positive evolution with prospects for the best results ever in these events, 200 m and 400 m. For the other half of the AG: A, D and F, no major changes are predicted in the times already achieved, even in some cases well below those already achieved, mainly in the 400 m event.
In summary, in the 200 m and 400 m events, there is a similar behaviour between the results in AG: B, C, E, G and H, predicting evolution in time for the two events. We also analysed in the set of the four distances the AG with the best time in the distance and the relationship between AG and the predicted time. As expected in the 50 and 100m events, the AG- A (25-29 years) appears with the best competition time in all age groups. We would like to point out that between levels, for example, AG C (35-39 years) appears with a better time than the previous AG B (30-34 years). However, in the 200 and 40 0m events, AG B (30-34 years) appears with the best times of the competition. Other cases with lower competitive times in more advanced AG also appear among the results, for example, the AG G (55-59 years) with a predicted time better than two of the previous AG, the F (50-54 years) and E (45-49 years).
DISCUSSION
The aims of this study were to investigate the participation and predict the participation and results of masters swimmers. The main findings of this study were:
increase of the number of participation in middle age groups (35-49 years);
in terms of prediction of results, improvements in results in 21 events for 50 m for AG (A, B, E, G, H), 100 m for AG (A, B, C, E, G, H), 200 m for AG (B, C, E, G, H) and 400 m for AG (B, C, E, G, H), while 11 in events the results do not meet improvements in 50 m for AG (C, D, F), 100 m for AG (D, F), 200 m for AG (A, D, F) and 400 m for AG (A, D, F).
Regarding the master swimmer's participation, there was a significant increase in the number of participations in the different editions (Borges, Reaburn, Driller, & Argus, 2016), the master swimmer's events have a greater number of participations in the middle age groups between 35 and 49 years, that is the peak of participation, and at the beginning, as at the end, there is less participation in the AG (Medic et al., 2007; Medic et al., 2011).
In the first and second AG (A and B), due to the influence of senior competition and possible break from intense training, an exponential decline appears in the older AG after the age of 60 (Weir, Kerr, Hodges, McKay, & Starkes, 2002; Knechtle et al., 2019). Medic et al. (2009) verify that age is directly related to participation in master sports, after the age of 50, the tendency of involvement decreases, this could be due to the limitations of physical capacities, the decline in performance, along with advancing age, (Tanaka & Seals, 2003; Favaro & Lima, 2005; Rubin et al., 2013).
Some studies related to the training of master athletes and their evolution show improvements in performance during middle age and even in older ages, this improvement along with an athlete age, depends on the ability to evolve the swimming technique, the intensity of training and the ability to compete (Tanaka & Seals, 2003; Lazarus & Harridge, 2017). Dionigi, Fraser-Thomas, Stone, and Gayman (2018) noted that psychosocial development does not end in adulthood and may be enhanced in master sport participation. Pollock, Foster, Knapp, Rod, and Schmidt (1987) and Tanaka and Seals (2008) state that this type of training can interrupt the ageing process to a considerable degree. Masters athletes who continue to train shown the benefits of regular long-term exercise in maintaining lean muscle mass (Wroblewski, Amati, Smiley, Goodpaster, & Wright, 2011) and bone mineral density (Leigey, Irrgang, Francis, Cohen, & Wright, 2009), which typically decline in the later decades of life, and confer salutary effects to brain health (Tseng et al., 2013). Tanaka and Seals (1997, 2008) report that at distances of 50 m, the decline in performance is more modest in terms of both age and longer distances, suggesting that it is not uncommon to see master swimmers achieve their best result between 40 and 50 years, being swimming technique the possible best cause (biomechanics).
Regarding the use of linear regressions, the database referring to the times obtained depends on the linear combination of sports resources in the specific case, which was mapped to a value between zero and one by the logistic function (Ye, 2003). Thus, the dependent variables must have a continuous value which, in turn, is a function of the probability of the events that occurred in the different championships (Witten & Frank, 2005). This study presented some limitations, in one hand the coefficients are estimated by the maximum likelihood estimate (Palmer, Jimenez, & Gervilla, 2011), in the other hand, the logistic regression has attracted great attention due to its simple calculations and interpretations, together with reliable results (Kantardzic, 2003).
Practical applications
This study could be an important tool to support coaches and swimmers, which allows a more comprehensive view of swimming performance in a given event and its possible determination. Coul be also a good indicator to the coaches planning the event strategy previously, not only from a global point of view but in a partial way, considering the various components of the swimming event.
CONCLUSION
In the analysis of the participation of male master swimmers in the national summer championships from 2009 to 2019, it was found that there was a more consistent increase in participation. However, the intermediate age groups are more representative than the first and last age groups. It seems that in the coming years, the age group swimmers not analysed due to lack of swimmers will also have participants in all championship competitions. Regarding the prediction of the results of the absolute times of each event, in most of the different age groups, there is the possibility of obtaining times close to new national records or even new national records, which reveals the evolution at the competitive level of the master swimmers.


