Introduction
MS is the most repeatedly used engineering material, due to its low cost and effortless availability for production. However, it is highly vulnerable to corrosion, especially in acidic media [1-4]. MS corrosion is severe in the presence of aggressive media, such as acidic, basic and salty solutions. So, industrial processes, such as acid cleaning, etching, and metal pickling, in which acidic solutions come in contact with MS, require the use of an inhibitor. A number of inhibitors (organic and inorganic) have been synthesized, and are used against MS corrosion in acidic media. Looking at their chemical structures, the most efficient inhibitors are organic compounds having atoms with lone electron pairs, such as nitrogen (N), oxygen (O) and sulphur (S), in their aromatic or long carbon chain systems. These atoms of those inhibitor compounds improve their electron releasing capacity towards the metal. They play an important role in inhibition by adsorption. They consist of electron non-bonded pairs that contribute (physically or chemically) to the inhibitor adsorption onto the metal surface, thus hindering the corrosive medium from attacking the latter. However, the shortcoming of these organic inhibitors is that they are expensive and not environmentally friendly [5-8]. Therefore, there is the need to search for cheap and green inhibitors.
A corrosion inhibitor is a substance which, when added in a small amount to an aggressive environment, effectively reduces the corrosion rate of a metal or alloy [9-11]. Eddy et al. [31] reported that green corrosion inhibitors are biodegradable and do not contain heavy metals or other toxic materials. The successful use of natural substances to inhibit metallic corrosion in acidic and alkaline environments has been reported [12-14]. Plants have been reported to contain many antioxidants, fatty acids and other compounds. These materials can be extracted by effortless methods from diverse parts of the plants, and be useful as corrosion inhibitors in diverse aggressive media. Adsorption, the formation of a protective layer, is the most obvious inhibition mechanism functioning through these organic materials [15]. In this work, we report the use of TM leaves extract, researching its activation and kinetic parameters and adsorption isotherms, for a T range from 303 to 333 K. We have used electrochemical studies to analyze MS surface morphology with and without TM, using FTIR, optical microscopy and GC-MS analyses of the inhibitor.
Experimental
Sample preparation
The used MS sheets were commercially obtained from Makurdi, in Benue State, Nigeria. They were mechanically press cut into 3.0 x 2.0 x 0.1 cm coupons. Prior to the experiment, all the samples were polished with sand paper, washed with water, cleaned with ethanol, degreased with acetone and air dried. TM is a common ornamental plant in Nigeria. Its leaves were collected from Makurdi (Benue State, Nigeria), shade dried and ground with a mortar and pestle, to reduce the surface area, for maximum extraction. The extracts were prepared by refluxing 30 g of the dried leaves powder in 300 mL of 1.0 M HCl, for 3 h, and keeping them overnight. The products were filtered, and the filtrates were taken as the stock solution of each plant. Portions with volumes of 2.0, 4.0, 6.0, 8.0 and 10.0 mL/L of 1.0 M HCl were used as corrosion solutions.
Weight loss measurements
Pre-weighed MS coupons were immersed in duplicates (in order to obtain reproducible results), in 1.0 M HCl solutions without TM and with it, in different concentrations, at 303 K. They were removed at an interval of 24 h, washed in water, cleaned with ethanol, dried with acetone and re-weighed. The experiment was repeated for each of the various TM concentrations, for periods of 24, 48, 72, 96, 120, 144 and 168 h, and the difference in weight was taken. T studies were carried out for 3 h in a thermo-stated water bath, at four different T (303, 313, 323 and 333 K). From the initial and final MS weights, the corrosion rate (gcm-2h-1), IE% and degree of surface coverage (Θ) were calculated using equations 1, 2 and 3, respectively [16].
where CR0 and CRi are the corrosion rates, without TM and with it, at various concentrations, respectively.
Results and discussion
Concentration and temperature (T) effects
From Table 1 we see that MS weight loss decreased with increasing inhibitor concentrations.
Table 1 MS corrosion rate in 1.0 M HCl, without TM and with it, in different concentrations, at 303 K, for 24 h. TM IE% and Θ.
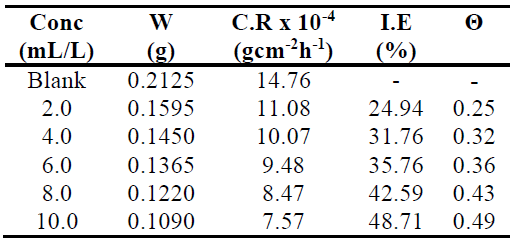
Fig. 1 shows that MS coupons corrosion rates in 1.0 M HCl decreased with increasing plant extract concentrations.
This suggests that, with higher TM concentrations, there was an increase in Θ of the MS coupons, which provided a barrier and disallowed further corrosion, enhancing IE. According to Chahul et al. [12], this phenomenon may be due to an increase in the fraction of the MS surface covered by the adsorbed extracts constituents. The experiments were repeated within a T range from 303 to 333 K, without TM and with it, at concentrations of 2.0, 4.0, 6.0, 8.0 and 10.0 mL/L, in order to investigate the T effect on the corrosion process.
The results obtained for a 3 h immersion period are presented in Figs. 2 and 3. The plot on Fig. 2 shows that MS corrosion rate, without and with TM, increased with higher T, from 303 to 333 K, due to the greater average kinetic energy of the reacting molecules [17, 18], which might have caused an intense vibration of the metal particles at the solution/MS interphase, making them more susceptible to corrosion. However, the corrosion rate was retarded by TM.
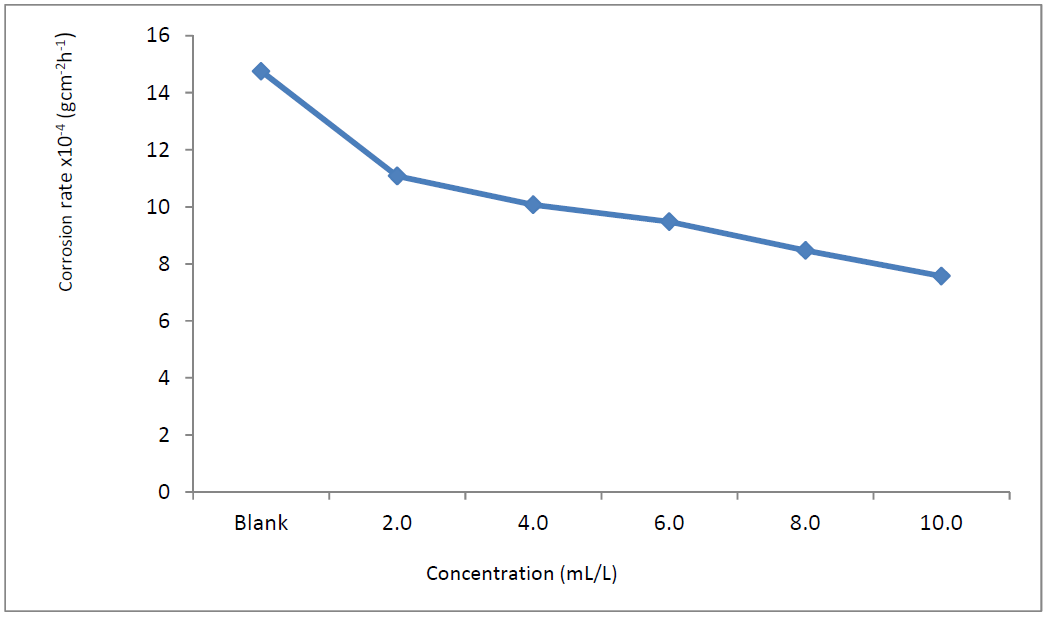
Figure 1 MS corrosion rate (gcm-2h-1) variation with different TM concentrations, in 1.0 M HCl, for 24 h of immersion, at 303 K.
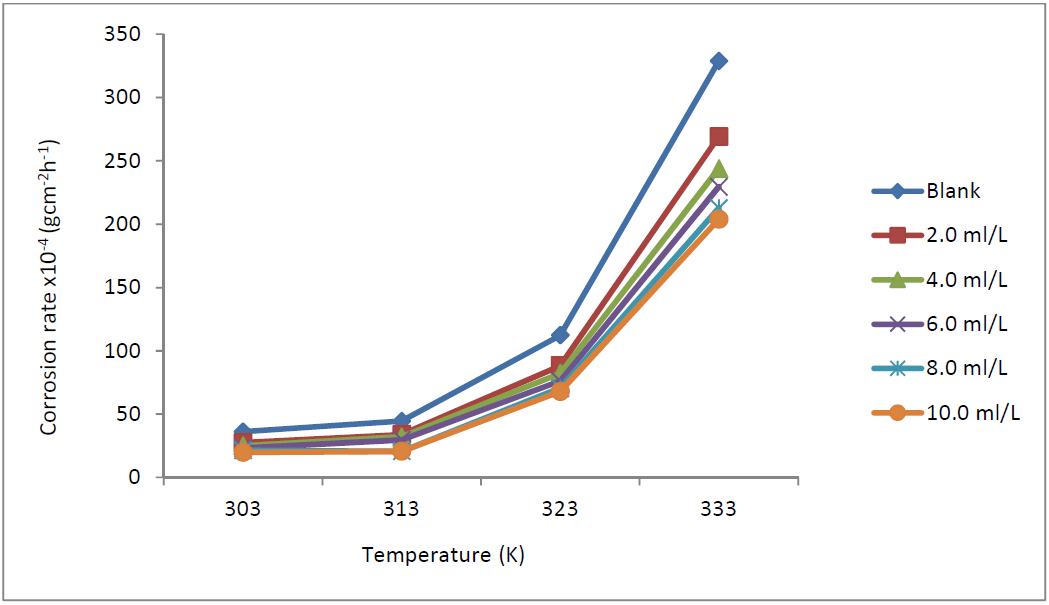
Figure 2 MS corrosion rate variation, x10-4 (gcm-2h-1), with T (K), in 1.0 M HCl, without TM and with it, at different concentrations.
Fig. 3 presents the variation of TM IE against MS corrosion in 1.0 M HCl, for a 3 h immersion period. This table shows that TM EI% decreased with higher T. Olasehinde et al. [13] reported that this phenomenon may be due to the higher solubility of the adsorbed protective inhibitor films on the MS coupons, which, thereby, increases their susceptibility to dissolution in the acidic media. Dependence of MS corrosion rate and TM IE% on the HCl concentrations, at 303 K, was also studied.
Fig. 4 shows that, without or with TM, the metal corrosion rate increased with higher HCl concentrations. This could be due to the higher number of HCl ions that increased the aggressive action of the acidic medium on the MS surface, leading to a decrease in the IE of the adsorbed TM, for its various concentrations [3, 12, 19].
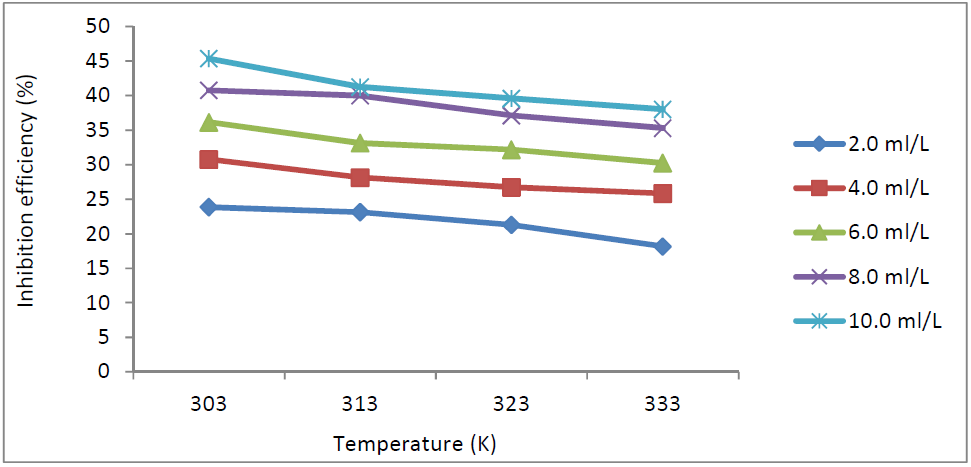
Figure 3 TM IE(%) variation with different concentrations and T (K), against MS corrosion in 1.0 M HCl.

Figure 4 MS corrosion rate (gcm-2h-1) variation with HCl (M) concentrations, without and with TM, in different concentrations, at 303 K.
Thermodynamic studies
Thermodynamic parameters, such as activation energy (Ea) enthalpy change (∆Ha) and entropy change (∆Sa) of the corrosion reaction, were calculated using Arrhenius equation and the transition state theory, which are given in equations 4 and 5 [18].
where A is Arrhenius pre-exponential factor, T is the absolute temperature, R is the universal gas constant, which is 8.314 kJ-1/mol-1 (kilojoule), N is Avogadro’s number (6.022 x 10²³ molecules mol-1) and h is Plank’s constant, which is 6.626 x 10⁻³⁴ joule second (J/s). The logarithmic form of equation 4 is given in equation 6, to obtain the Arrhenius plot.
The Arrhenius plot is given as Log CR against 1 T , which was obtained from equation 6. The slope is equal to −Ea 2.303?? and the intercept is equal to log A.
Equation 7 is obtained by taking the logarithm of both sides of equation 5.
Equation 7 can be plotted as log 𝐶𝑅 𝑇 against 1 𝑇 . The slopes are equal to −∆𝐻𝑎 2.303𝑅 and the intercept is equal to log 𝑅 𝑁ℎ + ∆𝑆𝑎 2.303𝑅 .
Table 2 shows that Ea is higher with TM than without it, suggesting physisorption of its phytochemical constituents, which happens during the first step of the adsorption processes. Sudhish et al. [20] reported that an increase in the Ea is followed by an appreciable decrease in the inhibitor adsorption onto the MS surface, which is caused by higher T. This decrease in adsorption leads to an increase in the corrosion rate, as there is a greater exposed MS surface area towards 1.0 M HCl.
The obtained ∆Ha (kJ/mol-1) values are also presented in Table 2, and they are positive, indicating the endothermic nature of the MS dissolution process.
∆Sa negative values, in TM absence and presence, suggest the formation of an activated complex in the rate determining step, which represents dissociation rather than association, thus suggesting that disorder increases on going from the reactant to the activated complex [13, 20].
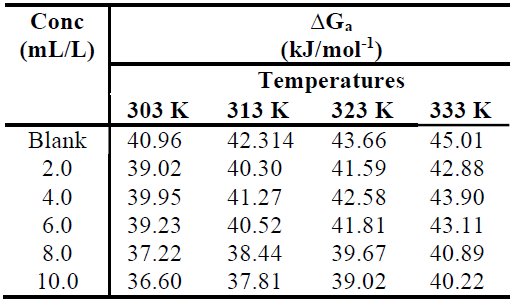
The change in the free energy of activation (∆Ga) of the corrosion process can be calculated at each T, by applying equation 8.
Table 2 Activation parameters for MS corrosion in 1.0 M HCl, without and with TM, at different concentrations.

*correlation coefficients values
The obtained ∆Ga values are listed in Table 3. They are positive, and show almost no change with an increase in T. This indicates that the activation complex is not stable, and that the probability of its formation decreases somewhat with the rise in T. However, ∆Ga values for the inhibited systems reveal that, with higher inhibitor concentrations, the activated corrosion complex becomes less stable than that of uninhibited ones [20].
Table 3 ∆Ga values for MS corrosion in 1.0 M HCl, without TM and with it, at different concentrations and T.
Kinetic model
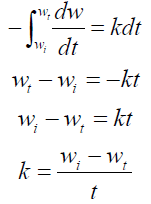
The reaction rate is stated as follows [16]:
Zero-order reaction kinetics
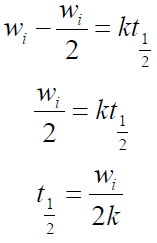
Half-life for the zero-order
Introducing  into equation 10, we have:
It shows that  of the zero-order reaction depends on the MS initial weight [16, 21-22], where w is weight loss, wt is MS weight after immersion at time (t), wi is the initial MS weight loss, k is the rate constant and n is the reaction order. Equation 9 is integrated into equations 10, 13 and 14, for zero, first and second order reactions, respectively. Table 4 shows results obtained for the three order reaction kinetics, at 303 K, and at different times (24, 48, 72, 96, 120, 144 and 168 h), without TM and with it, at two different concentrations (6.0 and 10.0 mL/L).
To verify the suitable reaction order, R2 values shown in Table 4 were best fitted in the case of equation 8 (i.e. zero order kinetic equation).
The reaction rates are also expressed in terms of half-life (t1/2), which is defined as the time taken for the concentration of a reactant to decrease to half of its original value, indicating the reactants stability, i.e., the longer the former, the greater the latter [16, 22].
The rate constant (k) indicates how fast or slow a given chemical reaction occurred, i.e, high and low rate constant values signify faster and slower rates, respectively. Table 4 shows that k values are high in the blank solution, and are lower at increased TM concentrations. This signifies that the inhibitor retarded the MS corrosion rate in 1.0 M HCl.
The t1/2 value was calculated, and is presented in Table 4. It was observed that the t1/2 values increased with higher inhibitor concentrations. This shows that TM raised the t1/2 values, thereby reducing the rate at which MS corroded in the acidic medium.
Adsorption studies
Adsorption isotherms are usually used to describe the adsorption process [22]. The inhibition action of organic molecules has been regarded as a simple substitution process, in which an inhibitor molecule in the aqueous phase takes the place of a y number of water molecules adsorbed onto the metal surface.
Plant extracts are composed of numerous organic compounds capable of either inhibiting or accelerating the corrosion process. The net antagonistic and synergistic action of a plant phytochemical components is what is recorded as its actual IE. These phytochemical components can be adsorbed onto the metal surface through the lone pairs of electrons present on their oxygen, sulphur and nitrogen atoms. The adsorption of such compounds onto the metal surface creates a barrier for charge and mass transfer, leading to a decrease in the interaction between the metal and the corrosive atmosphere. As a result, the metal corrosion rate is decreased [23-24].
Langmuir’s adsorption isotherm
The Langmuir’s adsorption isotherm relates Θ to the inhibitor concentration in the bulk electrolyte, and is given as:
where Kads is the equilibrium constant of the adsorption reaction and C is the inhibitor concentration in the bulk of the solution.
El-Awady’s adsorption isotherm
The El-Awady’s adsorption isotherm is given as:
where y is the number of inhibitor molecules occupying a given active site. Values of 1/y lower than unity imply the formation of inhibitor multilayers on the metal surface; if they are higher than unity, a given inhibitor occupies more than one active site [20].
Kads is related to the standard free energy of adsorption (∆Gads) by the expression in equation 19.
Equation 19 can be expressed as:
where T is absolute temperature and 55.5 is the molar concentration of water in the solution.
Curve fitting of the data to the Langmuir’s adsorption isotherm and the El-Awady’s thermodynamic/kinetic adsorption isotherm gave a straight line, which shows that the experimental data fit them. Kads and ∆Gads values calculated from both isotherm models are presented in Table 5 and 6, with 1/y values calculated from the El-Awady’s isotherm model listed in Table 6. This table shows that 1/y value is higher than unity, indicating that the inhibitor occupies more than one active site on the MS coupons. Kads represents the strength of adsorption between adsorbate and adsorbent. Kads larger values imply a more efficient adsorption and, hence, better IE [25]. Kads decreased with an increase in T, indicating that TM adsorption onto the MS surface was unfavorable at higher T.
∆Gads values presented in Tables 5 and 6 are negative for the inhibitor, indicating the spontaneity of the adsorption process, and the stability of the species adsorbed onto the MS surface [16, 20, 25]. ∆Gads values around -20 kJ/mol-1 or lower have usually been linked with electrostatic interactions between the inhibitor molecules and the charged metal surface (i.e. physisorption), and those of around -40 kJ/mol-1 or above are associated with charge sharing or transfer from the inhibitor molecules to the metal surface (i.e. chemisorption) [12-13, 25]. From Tables 5 and 6, ∆Gads values were lower than -20 kJ/mol-1, indicating that the extract adsorption onto the MS surface followed the physisorption mechanism.
The thermodynamic model of MS corrosion, with TM, can be further described using the enthalpy of adsorption ( ) and the entropy of adsorption (
 ), which can be calculated from the integrated Von’t Hoff’s equation [13, 20].
 and
and  can be calculated by plotting
  against
  . The obtained graphs are linear, with a slope equal to
  and an intercept equal to
 .
.
 and
and  values obtained from the Langmuir’s and El-Awady’s adsorption isotherms are presented in Table 7. It can be observed from Table 7 that the values obtained for
  and
and  are negative for the tested adsorption isotherm models.
  negative value indicates that the TM molecules adsorption onto the MS surface was an exothermic process.
  values lower than 40 kJ/mol-1 and higher than 100 kJ/mol-1 indicate physical adsorption (physisorption) and chemisorption, respectively [26]. It is clear from Table 7 that
  value is lower than 40 kJ/mol-1, suggesting physical adsorption of the inhibitor molecules.
  and
and  negative values reveal that TM molecules adsorption onto the MS surface was spontaneous at all T [13, 20, 26].
Electrochemical studies
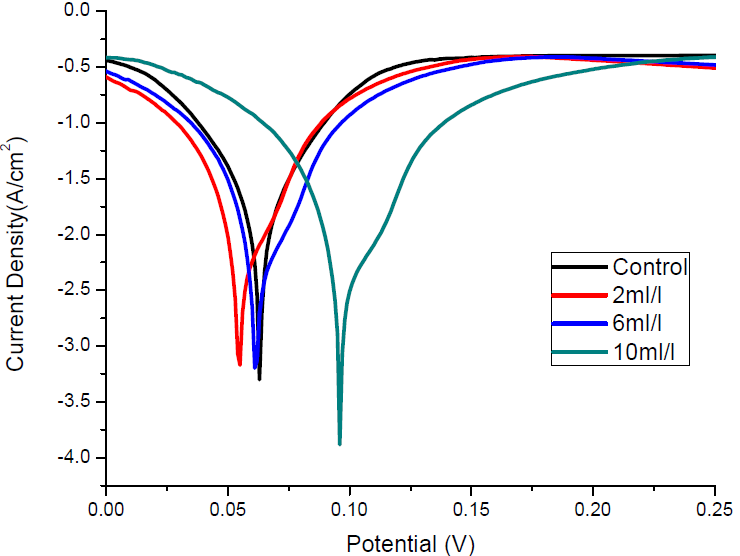
Polarization measurements were undertaken to investigate MS electrodes behaviour in 1.0 M HCl solutions, without and with TM, in order to understand the possible effect of the addition of different inhibitor concentrations on the metal anodic dissolution, and the corresponding cathodic reduction of the hydrogen ion in the corrosion process. From the Tafel plots, it is clear that both the cathodic and anodic curves showed lower current density (I) values with TM than those recorded without it. This confirmed the inhibitor phytochemicals adsorption onto the MS/acid solution interface, which caused the corrosion process inhibition. Fig. 5 shows the electrochemical linear polarization plots in 1.0 M HCl, with and without TM.
TM corrosion IE% was calculated from the linear polarization data in equation 22:
where Icorr(0) and Icorr(1) are the MS corrosion current densities without and with inhibitor, respectively, of which obtained values are given in Table 8, with the highest IE of 92.35%. It is observed that the Icorr values are much lower in the solution with TM than in that without it, and are the lowest at the highest inhibitor concentration (10.0 mL/L).
Table 8 Linear polarization parameters for MS corrosion in 1.0 M HCl, without TM and with it, at various concentrations.

Ecorr shifted towards more negative (i.e, cathodic effect) and more positive potentials (i.e, anodic effect), at TM lower and higher concentrations, respectively. These effects became more prominent at higher TM concentrations. This means that the extract acted as a mixed-type inhibitor, with a predominant anodic effect [18, 27].
Valarmuthi et al. [14] and Saranya et al. [28] reported that, if the shift in Ecorr is higher or lower than 85 mV, with respect to the blank solution corrosion potential, the inhibitor can be regarded as of the cathodic or anodic type, or as of mixed type, respectively. The maximum shift for TM was 33 mV, which confirms that the inhibitor is of mixed-type. The adsorbed inhibitor molecules hindered the releases of hydrogen gas on the MS surface and, thereby, reduced its dissolution process in the aggressive solution, by blocking its active sites, and protecting it from corrosion. Therefore, it is expected that the IE increases with higher inhibitor concentrations [29].
Fourier Transform Infrared (FTIR) analysis
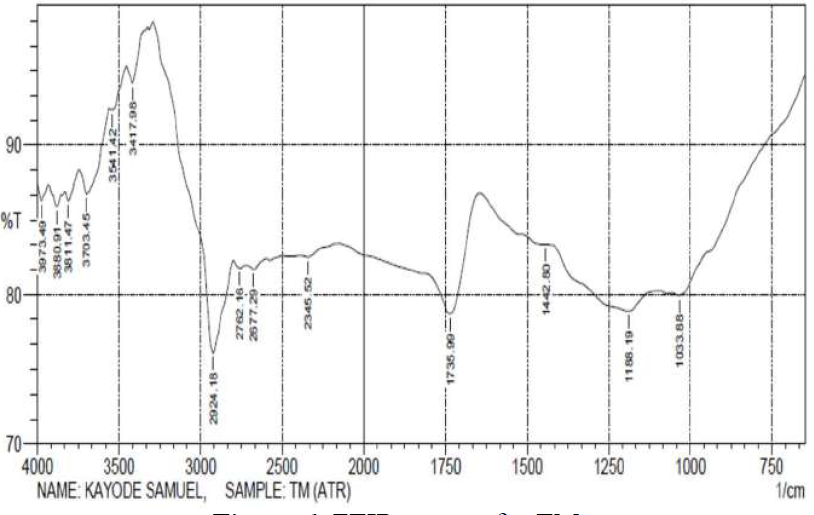
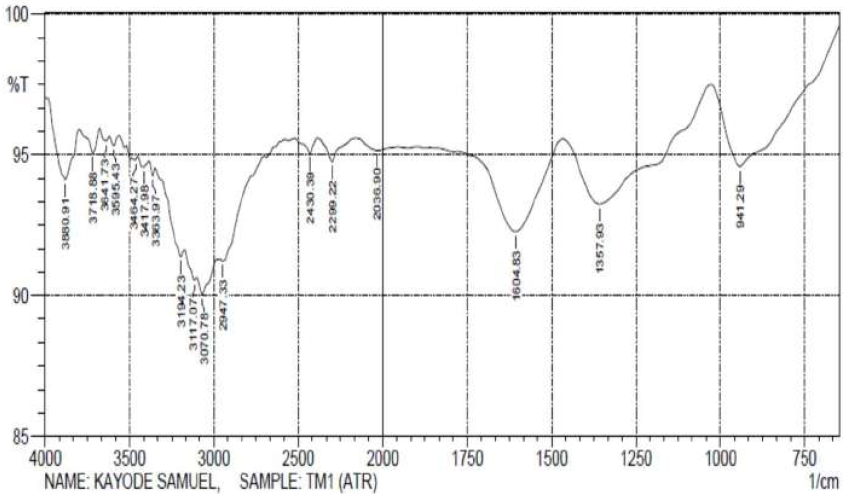
Figs. 6 and 7 reveal that most of the peaks for the crude TM extract were also seen in its films on the MS surface. This suggests that most of the functional groups within the TM extract are also present on the MS surface, confirming that the former was adsorbed onto the latter. However, some of the peaks of the adsorbed film became weaker, or even disappeared, indicating that the functional groups responsible for them could have been used to form an inhibitor-metal complex, which would have further protected the metal from corrosion.
TM spectra show that: the  stretches, at 3541.42 cm-1 and 2924.18 cm-1, due to alcohols and acids, shifted to 3595.43 cm-1 and 2947.33 cm-1; the
  stretch, at 3417.98 cm-1, due to amine, shifted to 3363.97 cm-1; the
  stretch, at 1735.99 cm-1, due to carbonyls, shifted to 1604.83 cm-1; the
  bending, at 1442.80 cm-1, due to aromatic rings, shifted to 1357.93 cm-1; and the
  stretch, at 1033.88 cm-1, due to sulfoxide, shifted to 941.29 cm-1. The missing functional groups are
  stretches, at 2762.16 cm-1 and 2677.29 cm-1, and
  stretch, at 1188.19 cm-1.
Optical microscopy
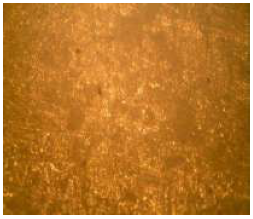
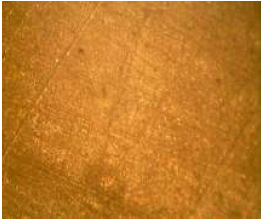
Surface morphologies of MS coupons, before and after dissolution in 1.0 M HCl, for 3 h, with and without TM, were investigated using a metallurgical microscope (digital metallurgical microscope NJF-120A model). Their photographs are presented in Plates 1 to 3.
Plate 1 shows the polished MS surface before immersion in the corrosive solution, which is associated with polishing scratches. Plate 2 shows that the MS surface in the 1.0 M HCl solution, without TM, was heavily corroded, and, with TM, was comparatively better (as shown in Plate 3). This suggests that the formation of a protective layer upon the inhibitor molecules adsorption onto the MS surface protected it. This result is in line with those reported earlier [16, 30].
GC-MS analysis
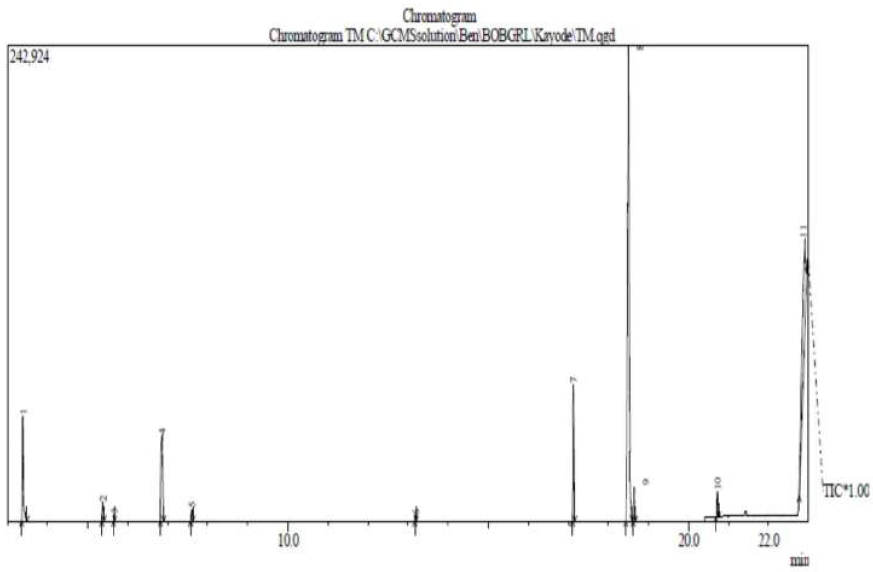
TM GC-MS spectra are shown in Fig. 8.
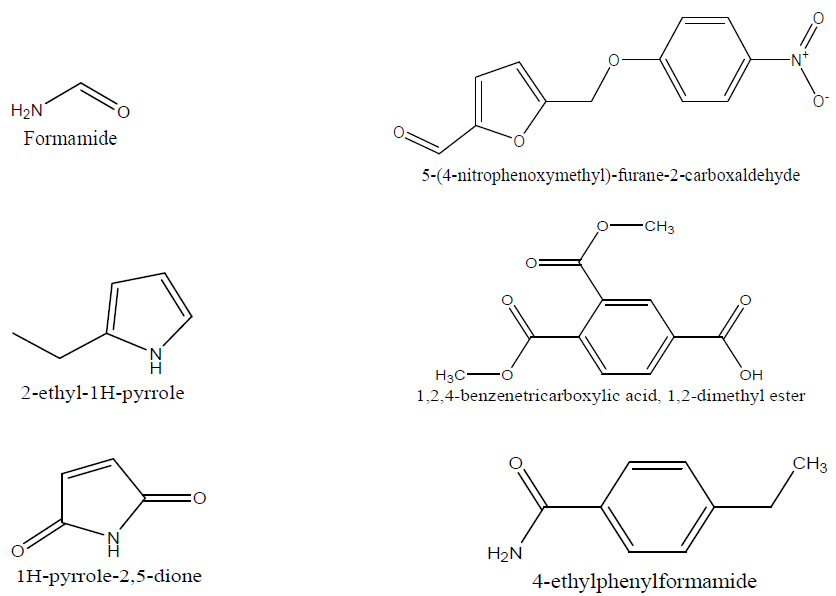
From the GC-MS analysis, eleven lines corresponding to eleven natural compounds were found in TM, and they are mentioned, with their relative concentrations, as follows: formamide, 7.24%, with a retention time of 3.375 min; 1,2,4-benzenetricarboxylic acid,1,2-dimethylester, 1.17%, with a retention time of 5.383 min; 2-Ethyl-1H-pyrrole, 0.29%, with a retention time of 5.658 min; 5-(4-nitrophenoxymethyl)-furane-2-carboxaldehyde, 8.04%, with a retention time of 6.858 min; 1H-pyrrole-2,5-dione, 0.66 %, with a retention time of 7.592 min; 4-ethylphenyl formamide, 0.23%, with a retention time of 13.183 min; n-hexadecanoic acid, 6.52%, with a retention time of 17.125 min; 6-octadecenoic acid, 48.64%, with a retention time of 18.508 min; 1,6-heptadiene, 1.43 %, with a retention time of 20.725 min; and 2,6-di-tert-butyl-4-[(2-octadecyloxycarbnyl)ethyl]-phenol, 24.38%, with a retention time of 22.875 min.
It is observed that the most abundant natural compound identified in the inhibitor is 6-octadecenoic acid. Most of the identified compounds contain hetero-atoms, such as O, N, S, P, and aromatic rings, which have been reported to aid the electrons release from the inhibitors towards the metal surface. These electrons are used in the formation of inhibitor-metal protective film complexes, which further protect MS from corrosion. The spectral lines show fragments of the inhibitor natural compounds, which help its adsorption onto the MS surface in the corrosive medium [31]. The chemical structures of the identified phytochemical molecules are presented in Fig. 9.
Conclusion
The study revealed that the TM leaves extract inhibited MS dissolution in a HCl solution. TM adsorption onto the MS was dependent on concentration, spontaneous, and majorly involved physisorption.
Linear polarization measurements showed that TM extract acted as a mixed type inhibitor against MS corrosion in a HCl solution.
Fourier transform infrared spectroscopy, optical microscopy and gas chromatography were employed to confirm the plant extract components adsorption onto the MS surface.


