Introduction
Corrosion remains a major obstacle for industries all over the world 1-5. It is often associated with substantial economic losses, such as reduced efficiency, increased maintenance costs and plants shutdown 3-8.
MS is widely used in industrial applications, transmission pipelines, construction, metal processing equipment, storage tanks, etc. 4. However, the major drawback with this alloy use is its low resistance to corrosion in acidic media 9, since HCl solutions are commonly used for MS pickling, cleaning and acid descaling.
Because of the acidic solutions aggressive attack, inhibitors are commonly employed for safeguarding metals surfaces integrity 8-13. The development of efficient corrosion inhibitors remains a subject of intense research 14. Most of the studied inhibitors are organic compounds containing heteroatoms (such as N, P, S and O), polar functional groups, π-electron systems and aromatic rings in their structures 11,15,16. The IE% of organic compounds containing heteroatoms increases in the order of O < N < S < P 15.
The compounds inhibition mechanism is ascribed to their adsorption onto the metal surface, thus forming a protective film that hampers anodic/cathodic reactions on the metal, thereby mitigating the corrosion process 17-22.
There exists a diverse list of organic compounds studied as inhibitors for MS corrosion in 15% HCl solutions. Among them are spiropyrimidinethiones, alcohol-based inhibitors, trans-cinnamaldehyde, cationic-gemini surfactants, S-N Schiff bases and derivatives of C7H6N2, pyranopyrazole, imidazole, pyridine, pyrazolone, benzyl quinolinium chloride and amino acids 18,20.
Recently, the study of a variety of polymers as inhibitors for MS corrosion has become the focus of research, due to their multiple adsorption sites, handiness, cost-effectiveness, safety in handling and environmental friendliness 18-22.
Although there are many protection strategies adopted to control metal substrates corrosion in diverse aggressive media, the use of corrosion inhibitors for internal pipeline rust protection is the most practical and cost-effective method 21.
The key performance indicators for corrosion inhibitors selection include their economic availability, effectiveness to protect the metal substrate, and environmental friendliness 19.
ILs are compounds that have revolutionized research centers and chemical industries in recent years 23-38. Recently, they have received considerable attention, because of their environmental friendliness and good anti-corrosion activity 27-37.
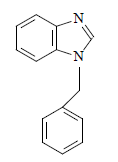
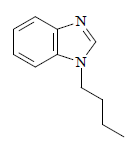
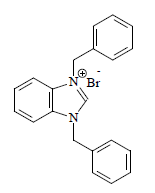
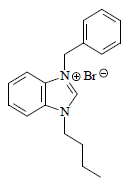
Due the excellent corrosion inhibition behavior of heteroatomic organic compounds with conjugated π-electron systems and polar groups, N-alkylbenzimidazoles, such as U2 and U4, and their corresponding salts (ILs), namely, U5 and U7, were herein synthesized and characterized.
The corrosion inhibition potential of these compounds was studied by the WL technique. Surface examination to verify ILs adsorption onto MS was achieved using SEM. Theoretical quantum chemical calculations and MD simulations were employed in order to provide atomic and molecular insights on the differences in the IE(%) of the two IL inhibitors, and for further complementing the experimental data.
Experimental
Materials
Materials for U2, U4, U5 and U7 synthesis were purchased from Sigma Aldrich, and used as-received. All solvents were of analytical grade, and were directly used without further purification. The synthesized products were purified either using MC (packed with 60 F silica gel, from Fluka-Chemie AG, Buchs, Switzerland), or by washing them with the appropriate solvent.
Instrumentation
1H-NMR spectral analyses were carried out in CDCl3 solvent using a Bruker 400 MHz ultra-shield instrument. δ were recorded in ppm, using TMS as reference. J was given in Hz. 1H-NMR signals were labeled as s, d, t and m. FT-IR spectra were recorded using an Agilent technology FT-IR spectrophotometer (Cary 630). Elemental analyses were performed with a Perkin Elmer Series 11 (CHNS/O) 2400 analyzer. Merck 60 F254 silica gel plates (with a layer thickness of 250 μm) were used for TLC analyses. An electro thermal apparatus (Stuart SMP 10) was used for measuring the solid compounds mp. Surface analysis experiments were performed using a SEM (FEI Quanta 450), at an acceleration voltage of 20 kV and x1000 magnification.
C 7 H 6 N 2 derivatives synthesis
U2 and U4 synthesis
C7H6N2 (10 mmol, 0.38 g) and the appropriate alkyl bromide (11 mmol) were introduced into a cleaned and dried 250 mL three-necked round bottom flask. KOH and K2CO3 (12 mmol both and 1.656 and 0.672 g each, respectively) were added to the flask. The mixture was dissolved in anhydrous CH3CN (80 mL), and stirred for 24 h, at 80 ºC.
The reaction was monitored using TLC (50% C4H8O2 and 50%: C6H14), until no free C7H6N2 was observed. The mixture was cooled down to room T, and CH3CN was removed by a rotary evaporator. The crude product was extracted with C4H8O2 and H2O. The combined organic layer was dried using anhydrous magnesium sulfate. The solvent was removed using a rotary evaporator, and the crude product was purified using silica-gel MC with C4H8O2-C6H14 as eluent, for obtaining pure U4.
U2
Yellow solid with 91.7% yield and 115 ºC mp 1H-NMR (400 MHz, CDCl3) δ (ppm): 5.43 (s, 2H CH2); 7.38-7.29 (m, 6H, CH aromatic, J = 5.6 Hz); 7.24 (d, 2H, CH aromatic, J = 7.6 Hz); 7.88 (d, H, CH aromatic, J = 8.0 Hz); and 8.25 (s, H, NCHN). FT-IR: 3028 cm-1 (C-H), 1490 cm-1 (C = N), 1447 cm-1 (C = C). Analytic calculations and found values for C14H12N2 were: C = 80.77 and 81.06; H = 5.78 and 5.98; and N = 13.46 and 13.67, respectively (Fig. 1).
U4
Thick brown oil with 88.5% yield. 1H NMR (400 MHz, CDCl3) δ (ppm): 0.95 (t, 3H, CH3, J = 7.2 Hz), 1.41-1.31 (m, 2H, CH2, J = 7.6 Hz), 1.88-1.82 (m, 2H, CH2, J = 7.2 Hz), 4.17 (t, 2H, NCH2, J = 6.8 Hz), 7.83-7.26 (m, 4H, CH aromatic, J = 2.8 Hz) and 7.96 (s, 1H, NCHN). FT-IR: 2979 cm-1 (C-H), 1458 cm-1 (C=C) and 1480 cm-1 (C=N). Analytic calculations and found values for C11H14N2 were: C = 75.86 and 76.02; H = 8.05 and 8.36; and N = 16.09 and 16.37, respectively (Fig. 2).
U5 and U7 synthesis
1-alkylbenzimidazole (2.4 mmol) and benzyl bromide (3 mmol, 0.36 mL) were taken up into a cleaned and oven-dried 25 mL round bottom flask. THF (10 mL) was added. The mixture was refluxed for 14 h, at 70 ºC. After the reaction was completed, the product was cooled and decanted to obtain the crude 1,3-dialkylbenzimidazolium salt, which was then washed several times with diethyl ether. The product was analyzed using TLC (50% C4H8O2 and 50% C6H14), and further washed with ether, until no free 1-alkylbenzimidazole was observed.
U5
White solid with 92.5% yield and 140 ºC mp. 1H NMR (400 MHz, CDCl3) δ (ppm): 1.69 (CDCL3), 5.89 (s, 2H, NCH2), 7.61-7.28 (m, 14H, CH aromatic, J = 2.8 Hz), 11.62 (s, 1H, NCHN). FT-IR: 2948 cm-1 (C-H), 1559 cm-1 (C=N), 1458 cm-1 (C=C). Analytic calculations and found values for C21H19N2Br were: C = 66.49 and 66.10; H = 5.01 and 5.15; and N = 7.39 and 7.30, respectively (Fig. 3).
U7
White solid with 87.9% yield and 158 oC mp. 1H NMR (400 MHz, CDCl3) δ (ppm): 1.10 (t, 3H, CH3, J = 7.2 Hz), 1.60-1.53 (m, 2H, CH2, J = 7.6Hz), 1.80 (s, CDCl3), 2.20-2.13 (m, 2H, CH2, J = 7.6 Hz), 4.70 (t, 2H, NCH2 aliphatic, J = 7.6 Hz), 5.98 (s, 2H, NCH2 aromatic), 7.79-7.35 (m, 9H, CH aromatic, J = 8Hz), 11.67 (s, 1H, NCHN). FT-IR: 2951 cm-1 (C-H), 1428 cm-1 (C=C), 1579 cm-1 (C-N). Analytic calculations and found values for C18H21N2Br were: C = 62.61 and 62.56; H = 6.09 and 6.06; and N = 8.12 and 8.19, respectively (Fig. 4).
Corrosion inhibition studies
Samples preparation
MS sample, with the composition (wt%) of C 0.12%, Cu 0.01%, Mn 0.11%, P 0.02%, Si 0.02%, Sn 0.01%, Ni 0.02% and the remaining Fe, was used for the corrosion studies. Test coupons with the dimensions 5.0 × 3 × 0.25 cm were mechanically cut and abraded with different SiC abrasive papers grades (400, 600, 800, 1500 and 2000). Then, they were rinsed with distilled H2O, degreased in acetone, dried in warm air and stored in a desiccator. The corrosive medium (1 M HCl) was prepared by appropriately diluting 37% analytical grade HCl with distilled H2O. The studied inhibitors C range was from 50 to 200 ppm, and the used electrolyte volume was 100 mL in all studies.
WL determination
WL measurements were performed at 308 K. Accurately weighed test coupons (treated with 0, 50, 100, 150 and 200 ppm by weight of the appropriate corrosion inhibitors) were immersed in 100 mL 1 M HCl. The pre-determined optimum immersion time of 12 h was uniformly used for the WL study.
After the experiments, the specimens were retrieved from the corrosive solution, thoroughly washed to remove the corrosion products with a SiC abrasive paper, properly rinsed with distilled H2O, degreased in C3H6O, then dried, and finally reweighed. Triplicate experiments were performed for each inhibitor C. The mean WL data were used to compute the CR (mg/cm-2/h-1) and the inhibitors IE(%), as per Eq 1 and 2.
where S denotes the MS specimen surface area (cm2); t represents the immersion time (h); Wo and Wi represent the WL (g), before and after immersion in the test solution, respectively;
where C R o and C R i are MS specimens CR (g/cm-2/h-1) without and with inhibitors, respectively. To determine T dependence on IE%, the experiment was repeated at 35, 45 and 55 ºC, using 200 ppm of the examined inhibitors. T was regulated using a thermostatic H2O bath.
SME analysis
Surface analysis experiments were performed using a SME (FEI Quanta 450), at an acceleration voltage of 20 Kv, and x1000 magnification.
Before the analysis, the coupons surfaces were appropriately cleaned and carefully dried. The polished samples, including the untreated and the treated ones, were carefully examined.
Theoretical studies
The molecules geometries were optimized using Dmol3 module, at B3LYP/DND level of theory, as implemented in Materials Studio (version 8.0) software.
After optimization, EHOMO, ELUMO, ∆E and other reactivity parameters were calculated.
The interaction between IL molecules and the Fe surface was probed using Forcite module of Materials Studio 8.0 software package.
Before simulations, Fe (1 1 0) plane was first cleaved from Fe crystal, and its surface was then optimized to the minimum energy.
The simulations were conducted in a simulation box (27.8 × 28.7 × 25.3 Å), with periodic boundary conditions, at a time step of 1 fs, using a simulation time of 500 ps, and a COMPASS force-field, under NVT ensemble, at 298 K. After simulations, Eint between the inhibitor molecule and the Fe surface was computed using Equation 3.
where ETotal expresses the entire system total potential energy, Esurface + solution reflects the energy of Fe (110) and of the blank solution, and Einhibitor represents the isolated inhibitor molecule energy.
Results and discussion
U2 and U4 synthesis
U2 and U4 were successfully synthesized by C7H6N2 deprotonation, using KOH/K2CO3 as a base, at room T. The deprotonated C7H6N2 was sufficiently nucleophilic to attack C7H7Br primary C, and generate the corresponding U2.
The reaction time was prolonged and T increased, when necessary, in order to ensure complete alkylation 15.
After the reaction, C14H12N2 (U2) was obtained as a yellowish-brown powder with a high isolated yield (92%). C7H6N2 reaction with C4H9Br, under identical reaction conditions, produced the corresponding U4, as a thick brown oil, with an isolated yield of 88%. An obvious reason for U2 relatively higher isolated yield than that of U4 is that the former is more reactive towards a nucleophilic attack than the latter 16,37-39.
The synthesized U2 and U4 purity was preliminarily examined by TLC, and further subjected to MC. The results showed adequate purity for characterization with spectroscopic methods. Some physical properties of the synthesized compounds, such as mp, were measured and found to comply with the literature values 15,16,23-26.
1H-NMR spectra of these compounds showed the various protons indifferent chemical environments. In the U2 1H-NMR spectrum, the protons on the (C6H5CO)2 group CH2 resonated at a downfield of 5.43 ppm, and appeared as s, indicating C7H6N2 successful N-alkylation. The signals at δH 7.38-7.29 ppm indicate an aromatic (CH) presence, while the signal at downfield, δH 8.25 ppm, corresponds to the proton on the C7H6N2 frame NCHN.
In the U4 1H-NMR spectrum, the CH2 group attached to C7H6N2 was observed downfield, at δH 4.17 ppm. This was higher than the other CH2 on positions 2 and 3 of the C4H9 group, which was due to the de-shielding effect caused by the C7H6N2 frame N atom. The signal at δH 7.96 ppm was assigned to the proton on the NCHN, which appeared as s.
The signal observed at δH 0.95 ppm represents C4H9Br group. IR spectra of these compounds showed an absorption band at around 1458-1490 cm-1, which is characteristic of the C = C and C = N vibrations.
The (C6H5CO)2 group presence is characterized by the typical absorption pattern of the aliphatic C-H stretching vibration at 2979-3028 cm-1, which further confirmed successful C7H6N2 N-alkylation. The elemental analyses results show consistency between experimental and theoretical values.
ILs synthesis
U5 and U7 ILs were obtained at excellent yields (93 and 88%, respectively). ILs 1H-NMR spectra revealed downfield signals at 11.61 and 11.66 ppm, respectively, assigned to the U5 and U7 NCHN acidic protons, respectively. Moreover, the signal appearance at δH 5.89 and 5.98 ppm, as a sharp s, was due to the CH2 (C6H5CO)2 group proton, which further confirmed the formation of the expected U5 and U7 C7H6N2 salts.
The m signal for the U5 and U7 CH aromatic protons was observed within the range from 7.61 to 7.79 ppm. The signal observed at δH 1.1 ppm, as t, was assigned to U7 CH3 group.
The 1H NMR spectral data of both compounds were in entire agreement with published literature 11-16.
Both ILs FT-IR spectra showed absorption bands at 2948, 1559, 1458, 2951, 1579 and 1428 cm-1, corresponding to the C-H stretching vibrations for CH2 and CH3, C=N and C=C of the C7H6N2 rings, for U5 and U7, respectively.
Synthesized compounds corrosion IE% on a MS surface
WL analysis
The relationship between the corrosion parameters and the tested inhibitors C is displayed in Table 1.
Table 1 Corrosion parameters of MS in 1 M HCl using various C7H6N2 compounds (including ILs) as inhibitors, at different C and T values.
| Cinh (ppm) | 35 ºC | 45 ºC | 55 ºC | |||
|---|---|---|---|---|---|---|
| CR IE(%) | CR IE(%) | CR IE(%) | ||||
| 0 | 2.20 | 5.23 | 8.78 | |||
| U5 | ||||||
| 50 100 150 200 | 1.05 0.69 0.38 0.23 | 52.27 68.63 82.72 89.54 | 2.32 1.39 0.61 0.38 | 55.64 73.42 88.33 92.73 | 3.42 1.81 0.70 0.42 | 61.04 79.38 92.20 95.22 |
| U7 50 100 150 200 | 1.20 0.78 0.48 0.32 | 45.45 64.54 78.18 85.45 | 2.54 1.57 0.78 0.54 | 51.43 69.98 85.08 89.67 | 3.69 2.11 0.91 0.61 | 57.97 75.96 89.63 92.36 |
| U2 50 100 150 200 | 1.30 0.84 0.53 0.38 | 40.90 61.81 75.90 82.72 | 2.67 1.69 0.87 0.64 | 48.94 67.68 83.26 87.76 | 3.79 2.31 1.11 0.81 | 56.83 73.69 87.35 90.77 |
| U4 50 100 150 200 | 1.37 0.92 0.60 0.45 | 37.72 58.18 72.72 79.54 | 2.79 1.80 0.97 0.76 | 46.65 65.58 81.45 85.46 | 3.98 2.49 1.29 0.98 | 54.67 71.64 85.30 88.83 |
The presence of all the studied compounds in the test solution caused a drastic decrease in CR, reflecting an increase in IE%, which occurred with higher inhibitors C values. This observation might be ascribed to the electron donor (N) and aromatic rings abundance at the metal/solution interface 27.
Maximum IE% was observed with the highest C (200 ppm) of the tested inhibitors. IE% was found to depend on the type of employed inhibitor as follows: U5 > U7 > U2 > U4. IE% variation could be linked to the difference in U5 and U7 ILs molecular structural features. Thus, the best IE (95.22%) was exhibited by U5, at 200 ppm.
U5 superior performance is attributed to the greater number of electron-rich centers (aromatic π-electron system) in its structure, which increased its tendency to transfer electrons into the Fe vacant d-orbitals, thus mitigating the corrosion process 5,6.
Thermodynamic and activation parameters
Thermodynamic and activation parameters play a crucial role in diagnosing the corrosion inhibitive mechanism 33-39.
WL experiments were performed in the T range from 308 to 328 K, using C7H6N2 compounds and their corresponding ILs, at various C values.
Ea for MS dissolution in 1 M HCl was obtained using the Arrhenius equation:
where R is the molar gas constant (8.314 J/mol- Ea 1/K-1) and A is the Arrhenius pre-exponential factor.
Fig. 5 illustrates the Arrhenius plot of log CR against 1/T, for MS corrosion control in a 1 M HCl solution by various inhibitors, at C values ranging from 0 to 200 ppm.
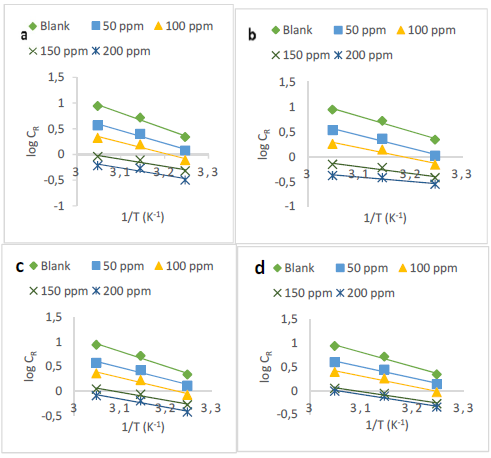
Figure 5 Arrhenius plots of log CR versus 1/T for MS corrosion inhibition in 1 M HCl by: (a) U5, (b) U7, (c) U2 and (d) U4.
Ea values were estimated from the straight lines gradients in Fig. 5, which are shown in Table 2. It is clear from the table that Ea values for the uninhibited solutions were higher than those for the inhibited ones, which indicates a chemisorption process 7.
The energetic barrier was lower, facilitating the formation of Fe2+ ions that interacted with the examined inhibitors, forming a protective film at the MS surface.
Adsorption isotherm
The adsorption isotherm provides crucial information on the interaction between the inhibitors and the MS surface.
Several commonly used adsorption isotherms include Langmuir’s, Temkin’s and Frumkin’s, which have been employed for elucidating ILs adsorption behavior onto the MS surface.
Langmuir’s adsorption isotherm presented the best fit to the experimental data, as defined by the following equation:
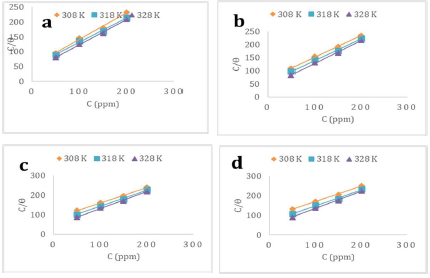
The plots of C/ϴ against C (Fig. 6), obtained at varying T values, yielded straight lines (R2 > 0.99), affirming the Langmuir’s isotherm validity.
is a key thermodynamic parameter that is linked to Kads, based on the following equation:
The constant value of 55.5 represents the H2O molar C in the solution.
The extracted thermodynamic parameters are collected in Table 2.
Table 2 Activation and thermodynamic parameters for MS corrosion in 1 M HCl without and with inhibitors.
| Inhibitor | Ea (Kj/mol-1) | A | Kads*(x 103) | -∆ 𝐆 𝐚𝐝𝐬 𝐨 (kJ/mol-1) | ||
|---|---|---|---|---|---|---|
| 308 K 318 K 328 K | ||||||
| Blank | 57.98 | 1.6 x 10¹⁰ | ||||
| U5 | 25.72 | 9.2 x 10³ | 5.18 | 32.18 | 33.23 | 34.27 |
| U7 | 27.13 | 1.3 x 10⁴ | 4.45 | 31.79 | 32.83 | 33.86 |
| U2 | 31.85 | 2.0 x 10⁴ | 4.04 | 31.54 | 32.57 | 33.59 |
| U4 | 32.52 | 1.2 x 10⁵ | 3.77 | 31.37 | 32.39 | 33.40 |
Kads high values obtained for all the four studied inhibitors signify strong adsorption and, hence, better corrosion inhibition behavior. 8.
It is obvious from Table 2 that ∆ G ads o calculated values are negative, which means that the ILs were spontaneously adsorbed onto the metal surface.
In general, ∆ G ads o values up to -20 kJ/mol-1are consistent with electrostatic interactions between the inhibitors charged molecules and the charged metallic surfaces (physisorption).
In its turn, ∆ G ads o values above -40 kJ/mol-1 involve charge transfer or sharing from the inhibitor molecules to the metal surface vacant d-orbitals, to form a coordinate covalent bond (chemical adsorption) 9. ∆ G ads o values in our study ranged from -31.27 to -34.27 kJ mol-1, which suggests the mixed physicochemical adsorption of these molecules onto the MS surface.
Quantum chemical calculations
In order to ascertain the molecular structure influence on IE%, quantum chemical calculations were performed using the B3LYP/DND level of theory. LUMO and HOMO optimized molecular structures and electron density distributions are displayed in Fig. 7.
EHOMO and ELUMO are important parameters for the prediction of the chemical species reactivity. EHOMO is often linked to the electron donating ability of a molecule. Thus, its high values mean that a molecule has a high tendency to donate electrons to suitable acceptor molecules with low energy empty molecular orbitals. Conversely, ELUMO low values indicate that the molecule readily accepts electrons from the donor molecules 10. It is generally accepted that ∆E low values cause better inhibition performance.
Quantum chemical parameters, such as EHOMO, ELUMO, ∆E, absolute χ, global η and σ, were calculated, and are summarized in Table 3.
Table 3 Quantum chemical parameters (eV) for the studied inhibitors.
| Inhibitor | EHOMO | ELUMO | ΔE | ( | σ | χ |
|---|---|---|---|---|---|---|
| U5 | -4.85 | -2.87 | 1.98 | 0.99 | 1.01 | 3.86 |
| U7 | -4.69 | -2.56 | 2.13 | 1.07 | 0.93 | 3.63 |
| U2 | -4.43 | -2.19 | 2.24 | 1.12 | 0.89 | 3.31 |
| U4 | -2.22 | -1.83 | 2.39 | 1.20 | 0.83 | 3.04 |
For the quantum chemical parameters calculations, the following equations were used:
η inverse is σ, as follows:
According to the results displayed in Table 3, U5 presented EHOMO highest value (-4.85 eV), which shows that it was more easily adsorbed onto the MS surface than U7, U2 and U4. In addition, U5 had ∆E lowest (1.98 eV) and σ highest values (1.01 eV). It is obvious from Table 3 that the ability to donate electrons to the MS surface follows the order: U5>U7>U2>U4, which is in good agreement with these inhibitors IE% experimental order.
MD simulations
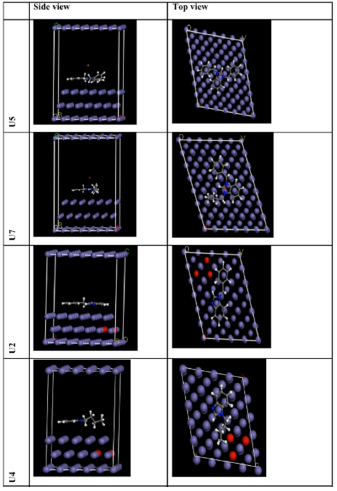
MD simulations have been conducted to better understand the interaction between the ILs and Fe (1 1 0) surface. The investigated inhibitor molecules optimized equilibrium configurations (both top and side views) are displayed in Fig. 7, and the calculated energies are shown in Table 4.
By inspecting the shown results, it can be seen that the inhibitor molecules approached the target surface in a nearly flat orientation. Actually, the flat orientation maximized the contact area between the inhibitor molecule and the Fe substrate, creating an obstruction between the latter and the aggressive particles, thus protecting it from corrosion. Meanwhile, the adsorption degree of an inhibitor molecule onto the metal substrate may be predicted using the interaction and binding energies. Higher interaction energies basically show the inhibitor molecule better adsorption onto the metal surface. Interestingly, the data presented in Table 4 reveal that the simulation system interaction energy value was large and negative, implying that ILs adsorption onto the Fe (1 1 0) surface was strong and spontaneous.
Table 4 Energetic outputs (kcal/mol-1) obtained from the inhibitor molecules MD simulations over the Fe (110) surface.
| Inhibitor | Total energy | Molecule energy | Interaction energy |
|---|---|---|---|
| U5 | ─154.03 | ─52.09 | ─101.94 |
| U7 | ─139.97 | ─46.77 | ─93.20 |
| U2 U4 | ─129.84 ─122.84 | ─42.55 ─39.55 | ─87.29 ─83.29 |
Morphology analysis
SEM micrographs displaying the abraded, corroded and inhibited MS surfaces are presented in Fig. 8 (a). After immersion in the blank 1 M HCl solution, for 12 h, the MS surface was damaged, as it can be seen in Fig. 8 (b). The specimen corroded layer was rather rough and cracked, due to the HCl solution destructive attack. In contrast, the MS specimen with the inhibitors addition exhibited a smooth surface (Fig. 8 (c-d)), which could be attributed to the active centers blocking by the inhibitor molecules on the metal surface. These observations confirm that ILs inhibitive action was based on the formation of a protective film at the MS surface, which protected it against HCl.
Conclusions
The synthesis of U2, U4, U5 and U7 was achieved. The alkyl imidazoles and ILs were found to exhibit good IE(%) of MS corrosion in a 1 M HCl solution. The inhibitors performances were better with higher C values and increased T. U5 and U7 ILs were found to be better corrosion inhibitors than U2 and U4, with the overall IE(%) increase in the following order: U5>U7>U2>U4. The results obtained from Langmuir’s adsorption isotherm and SEM revealed that the inhibitive action mainly occurred through the adsorption process. The theoretical results are in conformity with the experimental findings.
Authors’ contributions
Umar B. Suleiman: carried out the synthesis of U2, U4, U5 and U7; carried out physical analyses of the corrosion inhibitors; wrote the corrosion inhibitors synthesis and characterization section. Umar Yunusa: carried out the theoretical calculations; carried out the corrosion inhibition analysis; wrote the corrosion inhibitors section and part of their characterization. Aminu Muhammad: carried out spectral analyses for C7H6N2 salts and ILs and analyzed them; was involved in the drafting, reviewing, and editing of the manuscript. Mansur B. Ibrahim: designed the synthesis and carried out the spectral analyses of C7H6N2 compounds and ILs; was involved in the drafting, reviewing, and editing of the manuscript.
Abbreviations
1H-NMR: proton nuclear magnetic resonance
A: Arrhenius pre-exponential factor
bp: boiling point
C: concentration
C4H8O2: ethyl acetate
C4H9: butyl
C4H9Br: n-butyl bromide
(C6H5CO)2: benzyl
C₆H₁₄: n-hexane
C7H6N2: benzimidazolium
C7H7Br: benzyl bromide
CDCl3: deuterated chloroform
CH2: methylene carbon
CH3: methyl
CH3CN: acetonitrile
CR: corrosion rate
d: doublet
Ea: activation energy
EHOMO: energy of the highest occupied molecular orbital
Ein: interaction energy
ELUMO: energy of the lowest unoccupied molecular orbital
fs: femtosecond
FTIR: Fourier-transform infrared spectroscopy
HCl: hydrochloric acid
HOMO: highest occupied molecular orbital
IE(%): inhibition efficiency
ILs: ionic liquids:
J: coupling constant
K2CO3: potassium carbonate
Kads: adsorption equilibrium constant
KOH: potassium hydroxide
LUMO: lowest unoccupied molecular orbital
m: multiplet
MC: microcolumn chromatography
MD: molecular dynamics
mp: melting points
MS: mild steel
NVT: canonical ensemble, i.e. a collection of all systems of which thermodynamic state is characterized by a fixed number of atoms (N) a fixed volume (V) and a fixed temperature (T)
ppm: parts per million
ps: psicosecond
R2: determination coefficient
s: singlet
SEM: scanning electronic microscopy
SiC: silicon carbide
T: temperature
t: triplet
THF: tetrahydrofuran
TLC: thin layer chromatography
TMS: tetramethylsilane
U2: C14H12N2 (1-benzylbenzimidazole, i.e. alkylbenzimidazole)
U4: C11H14N2 (1-butylbenzimidazole, i.e. alkylbenzimidazole)
U5: C21H19N2Br (1,3-dibenzylbenzimidazolium bromide, i.e. dialkylbenzimidazole)
U7: C18H21N2Br (1-benzyl-3-butylbenzimidazolium bromide, i.e. dialkylbenzimidazole)
WL: weight loss


