Introduction
AA 7000 series (Al-Zn-Mg), with 7075-T6 at the head, are widely used for structural parts, due to their excellent mechanical properties/weight ratio and manufacturing cost. However, these alloys are likely to be affected by the corrosion phenomenon, mostly localized, mainly due to intermetallic particles of different compositions, which cause the creation of new phases with electrochemical properties very different from those of the Al matrix. These particles, such as Mg2Si, MgZn2, Al7Cu2Fe, Al2CuMg, Al2Cu and Al3Fe, promote micro-coupling, which is often the main cause of localized corrosion 1-4. The metallic surface is energetically heterogeneous, due to local disordering. The particles that are anodic, concerning the matrix, tend to dissolve. The particles that are cathodic promote the matrix dissolution. Cu and Fe are more cathodic than the Al matrix, which causes galvanic corrosion.
The combination of different layers helps protect materials against corrosion in a sustainable way. However, when damage is initiated, the coatings can no longer protect the bare metal. Corrosion inhibitors are substances that decrease metals reaction with their environment, when added at low C to corrosive media. An inhibitor can function by adsorption onto the metal surface, thus reducing CR.
Most synthetic inhibitors have good corrosion inhibiting properties, but their majority are toxic to the environment, and can cause temporary or permanent damage to organs, such as the kidneys or the liver, or disrupt the body enzyme system. Therefore, due to environmental concerns, plants are increasingly seen as a source of green corrosion inhibitors. They are used to protect metals and alloys from aggressive environments, replacing toxic chemicals. Several studies on the development of green inhibitors have been carried out for application in the protection of metals and alloys against corrosion 5-7. Avocado (Persea Americana) belongs to the Lauraceae family. AS have many health benefits, due to their composition 8. They are considered a natural source of proteins, antioxidants, vitamins (B1, B2, B3, C, A and E), minerals (P, Ca, Zn, Na, Fe, K and Cu) polyunsaturated fatty acids and trace elements 9.
The present study aimed to research and exploit a natural inhibitor for the corrosion inhibition of AA, in 3.5% NaCl, used in the aeronautical industry. Compared to IE(%) values of other inhibitors, such as Phoenix dactylifera L. (63%) 10, plant-derived cationic dye (78%) 11 and Berberine (80%) 12, those obtained in this work have reached satisfactory values.
Experimental part
Inhibitor preparation
AS were washed for eliminating impurities, dried at 50 ºC, in order to prevent deterioration of physical and chemical properties, and, then, powdered by grinding. The powder was sifted and analyzed by FTIR.
The samples FTIR spectra were recorded with a VERTEX 70 device, at the wavelength range from 400 to 4000 cm-1, in ATR mode. The powder was pelletized at about 1% by wt. in KBr previously stored in an oven at 100 ºC, and under a pressure of about 1000 psi.
Materials and solutions
A conventional electrochemical cell with three electrodes was used. The WW (AA) had an area of 1cm2, and it was prepared by grinding abrasive paper (gradation from 220 to 2000). Ag/AgCl (3 M C in Cl-) were used as RE, while Pt was the CE. Then, the samples were rinsed and degreased with acetone. Before each analysis, they were immersed in an electrochemical cell and stabilized for 2 h. AS easily dissolved with distilled water, at ambient T. AS C of 0.25, 0.5, 0.75 and 1 g/L were prepared in a 3.5% NaCl solution. AA had the following composition (wt%): Zn (5.81), Mg (2.62), Cu (1.59), Cr (0.19), Mn (0.01), Ti (0.02), Si (0.08), Fe (0.23) and Al (balance).
Polarization measurements
The WW was immersed in the solution for 2 h, until Eocp was constant, as a function of time. The cathodic polarization curve was registered from Eocp towards the negative direction, with a SR of 1 mV/s.
After this scan, the same electrode remained in the solution until Ecorr steady state (Eocp ± 0.02 V) was achieved. Afterwards, the anodic polarization curve was registered from Eocp towards the anodic domain, with the same scanning speed. These measurements were done utilizing a PGZ100 potentiostat, controlled by a PC. For each essay, three independent experiments were performed.
The Tafel extrapolation method of the linear cathodic domain was utilized to extract the corrosion kinetic parameters. IE(%) was extracted from icorr values, using the following equation:
where and icorr are values in AS absence and presence, respectively.
EIS measurements
EIS was performed employing a transfer function analyzer (Voltalab PGZ 100, Radiometer Analytical) over the frequency range from 100 kHz to 0,01 Hz, with 10 points per decade. The applied amplitude of the AC signal was 30 mV. All experiments were performed at the circuit E. The obtained impedance data were investigated within the equivalent circuit, using Bouckamp’s program 13. IE(%) was evaluated from Rp values by:
where and Rp represent values in AS absence and presence, respectively.
Surface study
Using a SEM model (JOEL JSM-5500), micrographs of the corroded and protected AA surfaces were obtained. The samples surface Ra was measured with an AFM (Nano Surf), in non-contact mode, and the images were processed using Gwyddion software. AA surfaces were examined using X-RD X'Pert Pro MPD model.
Computational study
DFT calculations
AS major constituents are GA and D-M. The two major molecules were optimized by utilizing DFT-B3LYB method. B3LYP and 6-31G (d, p) basis set, operated with Gaussian 09 software, were used in gas and aqueous media. The solvation model using IEFPCM was also employed to examine the water molecules solvent effect. For the considered AS molecules, EHOMO, ELUMO, ΔE, η, χ and ΔN were computed. Quantum chemical descriptors were determined according to the following equations 14,15:
According to Pearson, ϕ and η are equal to 4.82 and 0 eV, respectively. Fukui indices are useful predictors of reactive sites for nucleophilic and electrophilic attacks 16,17.
where Pk(N), Pk(N + 1) and Pk(N-1) are the molecule neutron, anion and cation, respectively. MPA was used to express Fukui functions in the present study.
Results and discussion
AS characterization and chemical composition
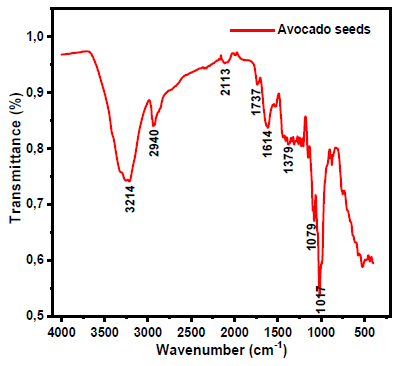
Fig. 1 shows AS vibration bands.
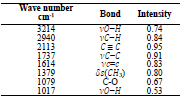
Spectra data for AS FTIR are presented in Table 1.
AS IR spectra are presented in Fig. 1. IR peaks of O-H (3214 cm-1) vibrations were identified. IR band at 2940 cm-1 was attributed to the C-H stretching vibration, and the 2113 cm-1 absorption band is characteristic of C≡C stretching vibrations. In addition, a vibration band at 1614 cm-1 was attributed to C=C, and the absorption band at 1079 cm-1 is characteristic of C-O stretching vibrations. Regarding AS extract chemical composition, 18 reported that it is essentially composed of 10% GA and 5% D-M, which represents 90% of the inhibitor.
GA and D-M chemical compositions are presented in Fig. 2. These major AS compounds contain C-O, C=C, C-H and O-H groups, all of which have been identified by FTIR spectroscopy.
Electrochemical measurements
PDP measurements
PDP measurements were carried out in a large E domain, in order to study AS effect on the partial anodic and cathodic reactions, at a SR of 1 mV/s.
Fig. 3 shows the polarization curve for AA in a 3.5% NaCl solution without and with AS, at different C (0.25, 0.5, 0.75 and 1 g/L).
In AS absence, the curve is characterized by different electrochemical reactions. On the anodic side, the branch is characterized by a strong increase in J, due to the propagation of galvanic and pitting corrosion localized on the AA surface (eq. 9). On the cathodic side, the plateau observed is associated with dissolved O reduction in the solution (eq. 10). The limiting J is in the order of 10-1 mA/cm-2. The increase in J for the lowest cathodic E corresponds to the water reduction reaction (eq. 11).
In AS presence, the anodic branch was characterized by a wide plateau of 320 mV, with a slightly positive slope, suggesting that the alloy was probably not in the passive state, but rather covered with a very protective film.
On the cathodic side, J associated with dissolved O reduction was decreased by almost two decades, compared to the reference. This strong decrease was due to the formation of a passive film on the matrix, which provided a pronounced barrier effect that limited O reduction on the intermetallic particles 19-21.
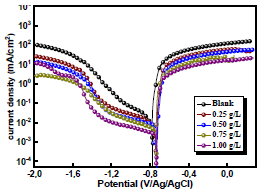
Figure 3 Polarization curves for AA without and with AS, in various C, after 2 h of immersion, at 298 K. The scan rate is |dE/dt| = 1 mV/s−1.
Table 2 presents electrochemical parameters: Ecorr, icorr, (c and IE(%). Tafel extrapolation method of the linear cathodic part, in both AS absence and presence, was used. IE(%) was obtained from the relation in Eq (1).
The results reported in Table 2 show that icorr decrease as AS C increased. The same is true for CR. IE(%) reached a maximum value of about 87% at 1 g/L AS. This is related to the low recorded icorr, which was about 1.4 μA/cm-2. AS addition slightly modified Ecorr values. Compared to other inhibitors, such as Phoenix dactylifera L. (63%) 10 and plant-derived cationic dye (78%) (11), AS IE(%) obtained during this study was significant, improving the protection against AA corrosion.
EIS
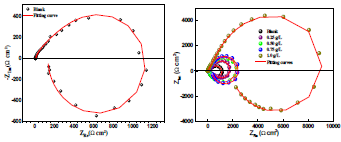
EIS diagrams obtained at OCP of AA, after 2 h immersion in 3.5% NaCl without and with AS, at 298 ±2 K, are shown in Fig. 4. These diagrams were obtained after Ecorr was stable, which allowed for a well-defined low-frequency of the diagram.
EIS diagrams, in the complex plane depiction of the Nyquist diagram presented in Fig. 4, are characterized by capacitive loops in the high and medium frequencies. The first capacitive loop is the load transfer resistance, which is parallel to the high-frequency capacitor, while the second one, at the medium frequency region, was originated from the formed oxide film.
The impedance diagrams also show an inductive loop at low frequencies. However, according to the work of 22-24, an inductive loop can be obtained under certain conditions, if the overall reaction consists of two electrochemical reactions involving an adsorbed intermediate. Moreover, this mechanism agrees with the work of 25, who have shown that the inductive loop of impedance diagrams is due to an adsorption process.
The capacitive loops sizes, out of phase concerning the real axis, increased with higher AS C. Rp values, determined from the medium frequency limits on the Nyquist diagrams, confirmed a satisfactory protective capacity at 1 g/L AS. The metal/electrolyte interface modeling was carried out through an equivalent electrical circuit (Fig. 5).
Two equivalent circuits were applied using a Bouckamp program. As shown in Fig. 5, the capacitor was substituted through a CPE, which offered a different frequency response. CPE impedance is represented by the following equation 26:
where Q is a constant in Ω/cm-2/sn, ω is the angular frequency in rad/s−1and n is CPE exponent (-1 < n < 1). ZCPE can represent either an inductance, or a Warburg impedance, or a capacitance or a resistance (n = -1, 0 and 0.5, respectively). The following elements from the suggested equivalent circuits are: Rs, Rf, Rct, nf, nct, CPEf and CPEdl.
Rp was calculated by the following equation:
Electrochemical parameters and IE(%) values, for different AS C, obtained by EIS, and using the equivalent circuit, are given in Table 3.
From the obtained parameters, it can be seen that AS addition decreased Qct and Qf values and increased Rct and Rf. The significant decrease in the capacitance values is often ascribed to a reduction in the dielectric constant or a rise in the double electric layer thickness, due to AS molecules adsorption onto the AA surface 27-29.
IE(%) and Rp values increased with AS addition, indicating the formation of an insulated adsorption layer. This phenomenon suggests that the charge transfer process was impeded when the uncovered area available for this process decreased, which can be explained by AS molecules adsorption at the metal/electrolyte interface 30.
T effect
Polarization curves
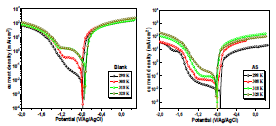
In general, T has a remarkable effect on corrosion phenomena. CR increases when the test T increases, which induces changes in the inhibitors action 31,32. PDP study of AA in NaCl without and with AS (1 g/L), at T from 298 to 328 K, was herein conducted. The corresponding obtained PDP curves are shown in Fig. 6.
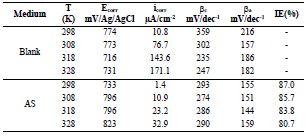
J was higher with an increase in T from 298 to 328 K. The curves of the cathode and anode were consistent with an equivalent mechanism within the whole T range. AA Ecorr was little modified by the increase in T to 328 K, in 3.5% NaCl without and with AS.
Ecorr, icorr, βc and IE(%) values are summarized in Table 4. In general, throughout the studied range, T higher values caused an increase in icorr. The icorr evolution in only 3.5% NaCl confirmed an increasing metallic dissolution with higher T. Nevertheless, the rise in icorr with higher T, in AA presence, was much smaller than in the uninhibited solution. These results confirm and complement those obtained by EIS. AS showed better (IE%) in the studied T range (308, 318 and 328 K).
Thermodynamic studies
The Arrhenius-type dependence observed between icorr and T allowed to calculate the corrosion process Ea value at different T, in AS absence and presence.
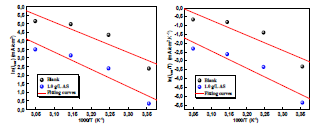
Fig. 7 illustrates the icorr logarithm (LnCR) variation as a function of the absolute T inverse (1/T). This Ln icorr = f (1/T) variation was linear for different C of both uninhibited and inhibited media. From the Arrhenius relation 7, we can calculate Ea for different C of the solutions without and with AS 33-35.
where R is the universal gas constant and K is the Arrhenius pre-exponential constant. The values collected from the slope of the linear plots are presented in Table 5, where it is seen that Ea value for the studied AS C was higher than that of the uninhibited solution. The increased Ea in AS presence may also be interpreted as physical adsorption.
Indeed, an enormous energy barrier within the inhibited solution was associated with physical adsorption or weak chemical bonding of AS with the AA surface 36,37. An alternative formula of the Arrhenius equation allows ΔHa and ΔSa determination, according to the following equation (15):
where N is Avogadro’s number and h is Plank’s constant.
Fig. 6 illustrates Ln (icorr/T) variation as a function of the inverse T (1/T). The obtained lines have a slope equal to -ΔHa/R, and an ordinate at the origin equal to Ln (R/Nh) + (ΔSa/R). From these equations, we can therefore calculate ΔHa and ΔSa values, which are given in Table 5.
ΔHa positive signs reflect the endothermic nature of the AA dissolution process. Indeed, increased ΔHa, in AS presence, corresponds to a decrease in AA dissolution 38. Additionally, Table 5 shows that ΔSa value was higher in AS presence than in its absence, which suggests that a rise in disorder occurred during the transition from the reactant to the activated complex, during the corrosion process 39,40.
SEM
The surface morphologies of AA samples, in 3.5% NaCl without and with AS, were analyzed by SEM. The surface compositions were determined from their EDX spectra. Figs. 8 and 9 show SEM-EDX of AA corroded and inhibited surfaces, after 2 h of immersion in 3.5% NaCl. SEM image of AA surface in 3.5% NaCl without AS (Fig. 8) shows the extreme degradation around the intermetallic particles.
Fig. 10 shows SEM-EDX of AA surface, after 20 h immersion in 3.5% NaCl with AS. In AS presence (Fig. 9 and 10), the AA matrix almost did not suffer corrosion attack by NaCl. This is in accordance with AS higher corrosion IE(%), as observed from electrochemical measurements.
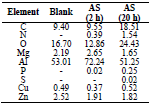
EDX analysis of the corrosion products created on the AA surfaces is presented in Table 6. P, N and S peaks appearance designate that the minority of AS were adsorbed onto the AA. P appearance is associated to the presence of diverse bioactive compounds comprising vitamins (A, C, E and B (vitamin B1) 8 and minerals (P, Ca, Zn, K, Na, Fe and Cu) 17. Therefore, these results confirm those attained from electrochemical measurements.
AFM
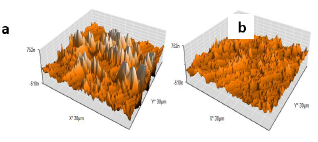
AFM allowed knowing electrochemical interactions at the nanometric, or even atomic, scale. It is an essential tool for the study of interface phenomena, such as corrosion 41-44. Micrographs of the AA surface without and with AS (1 g/L) are presented in three dimensions (Fig. 11).
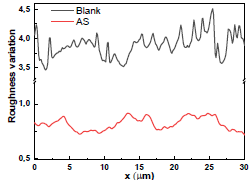
Fig. 11a shows that the AA surface in 3.5% NaCl without AS suffered severe damage, while with it, Ra was significantly reduced (Fig. 12).
Ra of the AA surface immersed in 3.5% NaCl without and with AS was 338.17 and 79.3 μm, respectively. Ra reduction confirmed the formation of a film by AS, which covered the entire AA surface (Table 7).
X-RD analysis
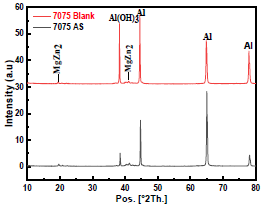
X-RD has been performed for determining the products developed on the AA surface. AA X-RD patterns, after 20 h immersion in NaCl without and with AS (1 g/L), are displayed in Fig. 13.
X-RD patterns determined three significant peaks: the one from Al was the strongest; the MgZn2 precipitate peak was very weak; and the intensity of that from Al(OH)3 was reduced in AS presence, indicating that it protected the alloy 45-47. There were some other AS compounds which X-RD could not identify. The theoretical studies would help us to illustrate it.
DFT calculations
After the experimental investigation was performed with AS, the theoretical study was executed to compare its components. GA and D-M have been theoretically examined through DFT calculations, for explaining the IE(%) structural parameters. Geometrical optimization structure, HOMO and LUMO, are presented in Fig. 14.
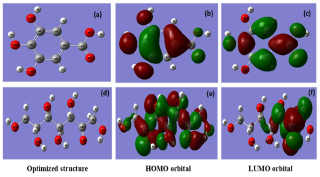
Figure 14 Geometrical optimization structure, HOMO and LUMO for GA (a, b, c) and D-M (d, e, f) at DFT/6-31G(d,p) in the aqueous phase.
It is seen that HOMO and LUMO electron density is distributed over GA molecule, indicating that it represents both nucleophilic and electrophilic centers from which the electron can be transferred from/to the AA vacant 3-d orbit. However, in D-M case, HOMO is distributed all over it, while LUMO is concentrated on the propanone group, which represents the electrophilic center that accepts electrons transferred by retrodonation from the AA surface.
Some quantum chemical descriptors, including ΔE, σ, (, χ and ΔN, in both gas and aqueous phases, were also quantified (Table 8). EHOMO and ELUMO refer to the tested compound electron donation and receiving ability to/from AA atomic orbitals. HOMO higher value indicates that AS have an excellent ability for donating electrons to the AA surface vacant d-orbitals.
In comparison, LUMO lower value implies that AS has an affinity for accepting electrons from the d-orbitals of the metal surface. It can be noticed from Table 8 that HOMO theoretical order in the gas and aqueous phases is GA > D-M, suggesting that the former had good electron-donating properties. ΔE is another fundamental descriptor that elucidates the inhibitor reactivity towards the metal surface. As ΔE diminishes, the inhibitor molecule reactivity is enhanced (higher IE) 48.
From Table 8, ΔE values obtained in both gas and aqueous phases follow the order D-M > GA, indicating that the latter has more reactivity than that of D-M.
Table 8 Various descriptors quantum chemical for GA and D-M molecules in both gas and aqueous phases.

According to χ equalization principle 49, D-M with high χ reflected lower reactivity than that of GA. Based on literature 50,51, it is known that an inhibitor molecule can donate its electron to a metallic surface if ΔN > 0 and < 0. However, ΔN order in the aqueous phase was GA (0.197) > D-M (0.076), suggesting that the former had higher ΔN towards the AA surface atoms than that of the latter. The present investigation showed that µ of GA and D-M did not have a significant order, and that the magnitudes of the mentioned descriptors for both molecules had the same trend in gas and aqueous phases. Consequently, these molecules, especially GA, may have been responsible for experimentally recorded AS IE(%).
Local reactivity descriptors (Fukui indices)
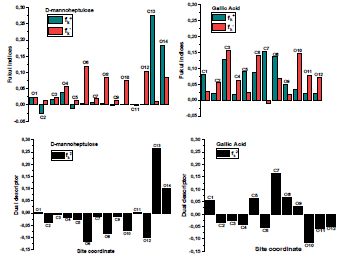
Fukui indices are important to recognize electrophilic and nucleophilic reactive centers within the same molecule 52. Fig. 15 displays the graphical outcomes of neutral GA and D-M molecules electrophilic/nucleophilic attacks, in terms of atom-condensed Fukui functions (Table 9) in the aqueous medium.
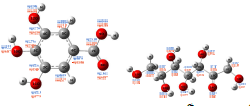
Figure 15 Schematic representation of Fukui indices (blue) and
 (red) for the considered molecules in the aqueous medium.
Table 9 Fukui functions and their dual descriptors for the considered molecules in the aqueous medium.
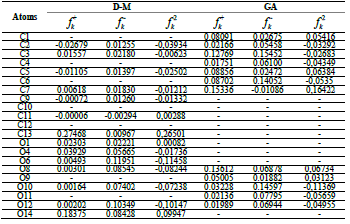
According to the schematic representation of Fukui indices, it is visible that almost all the GA molecule atoms interacted, as electrophilic and nucleophilic sites, i.e., higher values of  and
and  were obtained. However, in D-M molecule case, C(13), O(14), O(4) and O(1) acted as major locations for nucleophilic behavior, and all its O atoms acted as major centers, with electrophilic conduct.
Fukui functions second order ( ), also called dual descriptor, provides an easy and intuitive approach to chemical reactivity 53, and it can be evaluated using the following equation (16):
Fukui functions and their dual descriptors are shown in Fig.16.
It was reported that if  ˂ 0, it will tend to transfer electrons to the metal surface, while if
  > 0, it will accept electrons from the metal 54. As shown in Table 9 and Fig. 16, the most active sites for D-M and GA electron-accepting centers had the following sequence: C(13) > O(14) > C(11) > O(1) and C(7) > O(8) > C(5) > C(1) > O(9), respectively. However, the most active sites for D-M and GA donating active centers followed the order: O(6) > O(12) > O(8) > O(10) > C(2) > C(5) > O(4) > C(9) > C(7) > C(3) and O(10) > O(11) > C(6) > O(12) > C(4) > C(2) > C(3), respectively.
Conclusions
Electrochemical, thermodynamic, surface analysis and theoretical studies were used to characterize AS IE(%) on AA corrosion in a 3.5% NaCl solution. The following conclusions were drawn from this study:
AS were an excellent green corrosion inhibitor for AA in a neutral 3.5% NaCl medium.
AS IE(%) measured by EIS reached up 87% at 1 g/L inhibitor C.
Polarization curves showed that AS is a mixed type inhibitor.
AS adsorption onto the AA surface followed Langmuir’s isotherm. Thermodynamic parameters showed that AS was highly adsorbed onto the AA surface.
The study of the AA surface morphology and roughness by SEM/EDX and AFM showed a stable and insoluble adherent deposit.
Theoretical calculations showed that there was a correlation between AS molecular structure and its IE(%). They suggest that the effectiveness of AS Pc constituents studied through DFT pursued the sequence: GA > D-M.
Authors’ contributions
M. Radi: wrote the paper. R. Melian: conceived and designed the analysis. M. Galai: collected the data. N. Dkhirche: performed the analysis. E. Ech-chihbi: performed the analysis. M. Ebn Touhami: conceived and designed the analysis.
Abbreviations
AA: 7075-T6 Al alloy
AC: alternating current
AFM: atomic force microscope
AgCl: silver chloride
Al2Cu: aluminum bronze
Al3Fe: iron aluminide
AS: avocado seeds
ATR: attenuated total reflection mode
C: concentration
CE: counter electrode
CPE: constant phase element
CR: corrosion rate
DFT: density functional theory
DM: D-mannoheptulose
E: potential
Ea: activation energy
Ecorr: corrosion potential
EDX: energy dispersive X-ray
EHOMO: energy of the highest occupied molecular orbital
EIS: electrochemical impedance spectroscopy
EHOMO: energy of the highest unoccupied molecular orbital
ELUMO: energy of the lowest unoccupied molecular orbital
Eocp: circuit potential evolution
FTIR: Fourier transform infrared spectroscopy
GA: gallic acid
icorr: corrosion current density
IE(%): inhibition efficiency
IEFPCM: integral equation formalism variant of the polarizable continuum model
J: current density
KBr: potassium bromide
L: inductance
Mg2Si: magnesium silicide
MgZn2: dizinc magnesium
MPA: Mulliken population analysis
NaCl: sodium chloride
OCP: open circuit potential
Pc: phytochemicals
PDP: potentiodyamic polarization
Psi: pound-force per square inch
Qc: double layer capacitance of the inhibitors film
Qct: Al double layer capacitance
Ra: average roughness
Rct: charge transfer resistance
RE: reference electrode
RL: resistance of the inductive loop
Rp: polarization resistance
Sa: average surface roughness
SEM: scanning electron microscopy
SR: scan rate
T: temperature
WE: working electrode
X-RD: X-ray diffraction


