Introduction
Due to its excellent mechanical qualities and cost effectiveness, MS is commonly utilised for the construction or production of a wide range of engineering materials. However, MS wide areas of applications in engineering exposes it to corrosion, especially in acidic and alkaline environments 1-2. There are different techniques for metal surfaces coating against corrosion. The choice of a suitable method for a particular metallic material of interest depends upon certain factors, such as the metal nature, corrosive environment, T and inhibitors application methods. 3-4.
Research findings have shown that metals surfaces, such as Zn, Al, Mn, Fe and MS, can be effectively protected using phosphating technique 5. Phosphating process can be defined as a metallic protective treatment with insoluble phosphate, in order to obtain a reasonably hard and electrically non-conducting metal surface.
Phosphate coating is very contiguous and highly adherent to the underlying metal 6. This technique can also be adopted as a metallic pretreatment step, before the introduction of other protection methods such as lubrication, chemical spraying or painting. Phosphating, a chemical coating process, is cost-effective and has a natural bonding effect. It also gives high anti-corrosion properties. Generally, phosphating has been used in automobile, electronic/electrical and cold processing industries, among others 7.
A thin crystalline layer of phosphate compounds from the phosphate bath sticks to the metal substrate. Recent research has shown that Ca particles addition to coating materials resulted in excellent metal surface protection, due to a more uniform distribution of the fine grains, and improved bonding against corrosion 8-9. To reduce the cost involved in Ca modified phosphating, pure Ca can be obtained from the processing of waste materials that are rich in carbonates, such as oyster, PS, SS and ES, and animal bones 10.
The coating of metal surfaces by Ca modified phosphating is based on the adsorption process. That is, Ca and phosphates particles are adsorbed onto a metal surface, thereby inhibiting the corrosion process 11-12.
The novelty of this study was to produce pure Ca particles from locally source waste materials. Additionally, it established a suitable adsorption isotherm (and Td parameters) for Ca particles adsorbed during A36 MS coating by phosphates, at two different T (60 and 80 ºC) and Ca C from 1 to 2.5 g/L.
Materials and methods
Preparation of the metal coupons
The metal employed in this study was A36 MS. MS coupons were cut into dimensions of 2.8 x 2.8 cm, and polished by various grits of emery paper (P150, 320, 600 and 800). The polished MS coupons surface gained a smooth and homogenous texture, thus ensuring a uniform coating 6.
Calcination of Ca materials
The locally sourced materials used were SS, PS and ES. They were washed thoroughly with water, in order to remove impurities, dried (ES inner membrane was removed), and grinded into particles of ≤70 µm. The ground particles were calcined separately using a muffle furnace (SHI-204 VM), at 800 ºC, for 4 h, in order to obtain CaO, through CaCO3 decomposition 7. All CaO samples obtained from the three sources were well protected in an air tight closed container, before their application.
A36 MS samples coating
Each of the MS samples was completely dipped into the Zn phosphating bath solution for surface coating. Table 1 shows the coating bath composition (CaO was the only variable parameter). The experimental design of the process is shown in Table 2. Ca amounts adsorbed onto the MS samples were registered.
Table 1 Composition of the coating bath solution.
| Reagents | C |
|---|---|
| ZnO | 5 g/L |
| Zn(NO3) | 0.2 g/L |
| NaNO3 | 0.1 g/L |
| Sodium saccharin | 0.1 - 0.2 g/L |
| CaO | 1.0, 1.5, 2.0, 2.5 g/L |
| H3PO4 | 20 mL/L |
Table 2 Experimental design on the phosphating sequence.
| T | CaO coating time and C | |||
|---|---|---|---|---|
| T1 | t1C1 | t1C2 | t1C3 | t1C4 |
| t2C1 | t2C2 | t2C3 | t2C4 | |
| t3C1 | t3C2 | t3C3 | t3C4 | |
| t4C1 | t4C2 | t4C3 | t4C4 | |
| T2 | t1C1 | t1C2 | t1C3 | t1C4 |
| t2C1 | t2C2 | t2C3 | t2C4 | |
| t3C1 | t3C2 | t3C3 | t3C4 | |
| t4C1 | t4C2 | t4C3 | t4C4 | |
| T3 | t1C1 | t1C2 | t1C3 | t1C4 |
| t2C1 | t2C2 | t2C3 | t2C4 | |
| t3C1 | t3C2 | t3C3 | t3C4 | |
| t4C1 | t4C2 | t4C3 | t4C4 | |
T1, T2 and T3 = 40, 60 and 80 ºC; C1, C2, C3 and C4 = 1.0, 1.5, 2.0 and 2.5 g/dm3; t1, t2, t3 and t4 = 30, 40, 50 and 60 min.
Ca particles adsorption onto the MS surface
MS coupons were immersed in a Ca modified phosphating bath solution (using reagents shown in Table 1). The C of Ca adsorbed onto the MS surface, in the experimental setups, was determined through AAS. The obtained data were subjected to different isotherms (Temkin’s, Langmuir’s and Freundlich’s), in order to establish an appropriate model to describe Ca adsorption behaviour onto the MS surfaces. Freundlich’s isotherm was found suitable for Ca adsorption behaviour, and is given in Eq. (1):
where ( is in mg/g, n is Freundlich’s isotherm and Cads is the C of Ca adsorbed onto the coated MS surface, in mg/g. Log ( vs. logKads plot gives Freundlich’s isotherm slope and logKads intercept. Kads value was obtained from logKads equated to the plot intercept value. The plot gave a straight line from the line with the best model established from the one that produced R2 value equal or close to one.
Td parameters of Ca particles adsorption onto the MS surface
Using the data obtained from Freundlich’s isotherm plot, change in (G was evaluated using Van’t Hoff’s Eq.(2):
Further parameters, such as ΔS and ΔH, were determined using Eq. (3), as given by 10.
where R is the universal gas constant (8.314kJ/kmol/k) and T is operating temperature. From a plot of ln Kads vs 1 T (Eq. 3), −∆𝐻 𝑅𝑇 , when equated to the slope, gave ∆H value. Then, ∆S was calculated from ∆𝑆 𝑅 , when equated to the intercept obtained from the plot.
Results and discussion
Calcination result
Table 3 shows the chemical composition of the calcined local materials that produced CaO high content. The results revealed that they were all rich in CaO, within a range from 79.49 to 84.02 wt%. CaO obtained from the SS had the highest value of 84.02 wt%.
Ca particles adsorption onto the MS
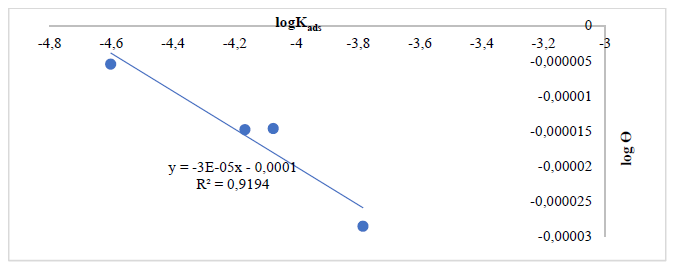
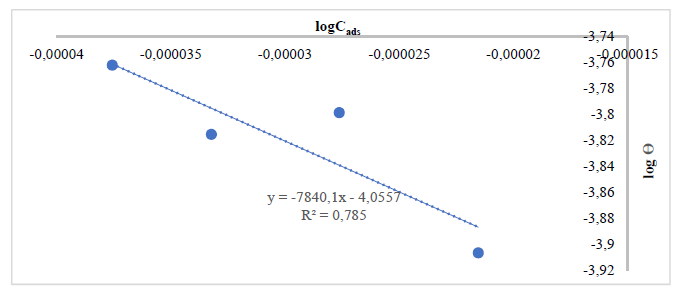
In order to establish Ca adsorption performance onto the MS surface, Langmuir’s, Temkin’s and Freundlich’s isotherms were employed. Using Eq. (1), a straight line graph was obtained with a plot of log( vs logKads, which was in accordance with Freundlich’s isotherm assumption 13, since the obtained results showed that this model best fit the adsorption phenomenon, with R2 values close to 1, as shown in Figs. 1-6. That is, Freundlich’s adsorption isotherm plots, in order to coat the MS surface, gave various R2 values for Ca particles obtained from: SS, 0.9194 and 0.9621 (Figs. 1 and 2); PS, 0.7850 and 0.9878 (Figs. 3 and 4); and ES, 0.9036 and 0.7770 (Figs. 5 and 6).

Figure 1 Freundlich’s isotherm plot for Ca (using CaO from SS particles) adsorbed onto the MS surface, at 60 ºC.

Figure 2 Freundlich’s isotherm plot for Ca (using CaO from SS particles) adsorbed onto the MS surface, at 80 ºC.

Figure 3 Freundlich’s isotherm plot for Ca (using CaO from PS particles) adsorbed onto the MS surface, at 60 º.

Figure 4 Freundlich’s isotherm plot for Ca (using CaO from PS particles) adsorbed onto the MS surface, at 80 ºC.

Figure 5 Freundlich’s isotherm plot for Ca adsorbed (using CaO from ES particles) onto the MS surface, at 60 ºC.

Figure 6 Freundlich’s isotherm plot for Ca adsorbed (using CaO from ES particles) on the MS surface, at 80 ºC.
K ads
Table 4 shows Td properties of Ca particles adsorption process onto the MS surface. Obtained Kads values were positive, which implied that Ca was adsorbed on the MS surface. From Table 4, Ca from SS particles had the highest obtained Kads values (0.9997). According to (9), larger Kads values indicate higher adsorption tendency 14. This means that Ca ions from SS particles were more strongly adsorbed onto the MS surface than the other ones.
Table 4 Td parameters (ΔG, ΔS and Kads) from Ca adsorbed onto MS.
| Materials | T K/ºC | Kads | ∆G (kJ/mol) | ∆S (kJ/K) |
|---|---|---|---|---|
| St3C3, St4C3, St3C4, St4C4 | 333/60 | 0.99977 | -11119.0 | 0.0017 |
| 353/ 80 | 0.99977 | -11786.8 | ||
| Pt3C3, Pt4C3, Pt3C4, Pt4C4 | 333/ 60 | 0.99909 | 14734.9 | 1292.6610 |
| 353/ 80 | 0.99931 | -11785.4 | ||
| Et3C3, Et4C3, Et3C4, Et4C4 | 333/ 60 | 0.99954 | -11118.3 | 0.0299 |
| 353/ 80 | 0.99917 | -11786.8 |
S = CaO from SS; P = CaO from PS; E = CaO from ES
Change in ∆G
The change in ∆G for the adsorption process was calculated using Kads values derived from Freundlich’s isotherm (Eq. 2). Changes in ∆G are shown in Table 4. Negative ∆G values showed a spontaneous nature of the adsorption process, and stability of the adsorbed Ca ions onto the coated A36 MS surface. The results revealed that, with an increase in T (from 60 to 80 ºC), lower ∆G values were attained. This means that stronger adsorption occurred at higher T 15, since particles gained more energy to migrate at 80 ºC. However, there was a deviation in the result of changes in ∆G obtained during Ca particles adsorption, when PS particles were employed at 60 ºC.
∆S changes
∆S changes obtained using Eq. (3) were reported in Table 4. Calculated ∆S gave a positive value in each case, that is, the adsorbed Ca ions degree of disorderliness increased 15-16. Hence, a spontaneous adsorption process occurred in all cases, which confirmed results from Kads and ∆G. Obtained ∆S values were due to the different amount of energy absorbed from the surroundings 9.
Conclusions
The present study concluded that Freundlich’s isotherm fitted experimental data for Ca ions adsorbed during MS coating process. Ca particles from SS particles had the strongest adsorption capacity, as revealed in terms of calculated Kads, ∆G and ∆S values. Higher Kads was obtained during the adsorption process, as T increased from 60 to 80 ºC. Td parameters results (Kads, ∆G and ∆S) revealed that Ca particles adsorption onto MS was a more spontaneous process at increased T.
Authors’ contributions
Ezekiel Neza: provided the original draft, methodology and investigation. Ayodeji Ayoola: provided conceptualization, original draft, methodology, investigation, supervision, reviewing and editing. Rasheed Babalola: provided conceptualization, reviewing and editing. Bamidele Durodola: provided conceptualization, methodology and investigation.
Abbreviations
AAS: atomic absorption analysis
C: concentration
CaCO3: calcium carbonate
ES: egg shells
IE(%): inhibition efficiency
Kads: adsorption equilibrium constant
H3PO4: phosphoric acid
MS: mild steel
PS: periwinkle shells
R2: determination coefficient
SS: snail shells
T: temperature
Td: thermodynamic
ZnO: zinc oxide
Zn(NO3): zinc nitrate


