Introduction
Corrosion is the gradual destruction of metals and alloys by chemical and Elc reactions with their environment. It is the process of slowly metals dissolution by gas and water vapors present in the atmosphere, due to the formation of certain compounds, such as oxides, sulphides and carbonates 1-2.
Corrosion consequences are many and varied, and their effects on the safe, reliable and efficient operation of equipment or structures are often more serious than simple metal mass loss. Failures of various kinds and the need for expensive replacements may occur, even when the amount of metal destroyed is quite small 3-4.
CS is used for making alloys in structural and industrial applications, and it became paramount since the industrial revolution. Crude oil refining is carried out in several corrosive conditions that cause equipments surface corrosion. Generally, materials in contact with acid undergo corrosion, which is inevitable, and must be prevented. CS is also used structurally in buildings, bridges, axles, gears, shafts, rails, pipelines, couplings, cars, fridges and washing machines. High CS has a much better tensile strength, so it is used to make cutting tools, blades, punches, dies, springs and high-strength wire. New high strength alloys usually are more susceptible to a certain type of corrosive attack. The acids used as media in CS corrosion studies have become important, due to their industrial applications, such as pickling, industrial cleaning, descaling, oil recovery and petrochemical processes 5-6.
The use of inhibitors is found to be one of the most practical methods for protection against corrosion. Inhibitors are used in the industrial process to control metal dissolution, especially in acidic, neutral and basic environments. Most of the efficient inhibitors used in industry are organic compounds that possess at least one functional group, which is considered the active center for the adsorption process.
Several researchers made an attempt to study the inhibition action of various organic compounds on Cu and Al alloys, MS, CS and composites corrosion in acids, alkaline and neutral media 7-12.
Most well-known CI are organic compounds containing hetero atoms, such as O, N, S, and multiple bonds. They are not only expensive, but also toxic to both human beings and environments. Since their use as CI are limited, efforts have been made to develop cost-effective and non-toxic CI. Plant extracts, called green inhibitors, are considered as an incredibly rich source of environmentally acceptable CI.
The main goal of the present study was to evaluate IE(%) of SCLAE on the corrosion of CS immersed in 1 N HCl. IE(%) effect of SCLAE on CR of MS was calculated by the WL method. CI mechanistic aspects were determined by Elc studies, such as ACIS and PDP. The protective layer formed over the CS surface was analyzed by FTIR spectroscopy technique. Ra of polished, corroded and inhibited CS was characterized by SEM. EDAX was used to analyze elements present on the CS surface after immersion in 1 N HCl, without and with SCLAE. The CS surface film Ra was characterized by AFM.
Materials and methods
CS specimens (C: 2.0%, S: 0.026%; P: 0.06%, Mn: 0.4% and Fe as the remainder), with the dimensions 1.0 × 4.0 × 0.2 cm, were polished to mirror finish, degreased with acetone, and used for the WL method. The aggressive solution was prepared by diluting 1 N HCl analytical grade with double distilled water.
Stock solutions preparation
Double distilled water was used wherever necessary in the solutions preparation. Analytical grade HCl was diluted to the required Ct. SCLAE was prepared by the Soxhlet extraction method. About 100 g powdered SCL were uniformly packed into a thimble and extracted with 1000 mL double distilled water. The extraction process ended when the solvent in the extractor siphon tube became colorless. Then, the extract was kept overnight for cooling, and made up to 1000 mL with the same double distilled water, in order to obtain 10% (w/v) SCLAE. Using this stock solution, different Ct of SCLAE were prepared.
WL method
WL measurements were done according to the described method 12-13, for 3 h, by immersing the CS specimens in 1 N HCl without and with SCLAE, at different Ct (2, 4, 6, 8 and 10%). After the elapsed time, CS specimens were taken out, washed, dried and weighed accurately.
IE (%) was determined by the following equation:
where Wi and W0 are WL values (g) for CS in HCl with and without SCLAE, respectively.
CR determination
CS specimens weighed in triplicate were suspended by means of glass hooks in 100 mL 1 N HCl without and with SCLAE at various Ct, for 3 h of IT. Then, they were taken out, washed in running water, dried and weighed. From the change in the samples weight, CR values were calculated using the following relationship:
where a is the specimen area in cm2.
Elc techniques
PDP study
CHI-Elc workstation, with a 660A impedance model, was used to record Elc studies. A conventional three electrode cell, with CS as WE, SCE as RE and PE as CE, was used. In every measurement, a fresh WE was used. The CS specimen was machine-cut into coupons with the dimensions 5 × 1 × 0.2 cm, and embedded in araldite (epoxy resin), leaving a 1 cm2 surface area exposed for Elc measurements. This exerted a uniform E field on the CE. The WE and PE were immersed in 1 N HCl without and with SCLAE 14. SC was connected with the test solution through a salt bridge. E vs. log I plots were recorded. Elc parameters, such as Ecorr, Icorr, (a and (c, were determined from E vs. log I plots.
AC impedance measurements
Impedance spectra were used over the frequency range from 100 to 100000, with an AC signal amplitude of 0.005 V. The measurements were recorded after the electrode reached a steady Ecorr. The experiments were carried out at a constant T of 30 ºC. An interval from 5 to 10 min was given for the system to attain a steady state OCP. Then, an AC E of 10 mV was superimposed. AC frequency was varied from 100 KHz to 100 MHz. The real (z’) and imaginary (z”) parts of the cell impedance were measured in ohms for various frequencies. Cdl values were calculated using the following relationship 15:
Surface examination techniques
CS specimens were immersed in solutions without and with SCLAE, for 3 h. Then, they were taken out and dried. The nature of the layer formed on the CS specimens surface was analyzed by various analyses techniques.
Surface analysis by FTIR spectra
The layer formed on the CS surface was carefully removed and mixed thoroughly with KBr pellets. FTIR spectra were recorded in a Perkin-Elmer 1600 spectrophotometer, with a resolving power of 4 cm1. After an IT of 3 h in various media, the specimens were taken out of the test solutions and dried. The layer formed on the CS surface was carefully scratched and thoroughly mixed, so as to make it uniform 16.
SEM studies
CS specimens immersed in the HCl solution without and with SCLAE, for 3 h, were removed, rinsed with double distilled water, dried and examined through a SEM (JEOL MODEL JSM 6390), to assess their surface morphology 17.
EDAX studies
CS specimens immersed in the HCl solution without and with SCLAE, for 3 h, were removed, rinsed with double distilled water, dried and examined by a computer controlled EDAX (Brucker Nano, GMBH, Germany), to study the elements present on their surface 18.
AFM characterization
CS specimens immersed in the HCl solution without and with SCLAE, for 3 h, were removed, rinsed with double distilled water, dried and subjected to surface examination 19. CS surface morphology measurements were carried out by AFM, using a Veeco di Innova SPM with the software version V7.00, at the SR of 0.7 Hz.
Results and discussion
IE(%) of SCLAE and CR of CS were determined by the WL method, before and after immersion in 1 N HCl, and their values are given in Table 1.
Table 1: CS immersed in 1 N HCl without and with SCAEL, at different Ct, and IE(%) assessed by WL method.
| Ct(%) of SCLAE | CR (mdd) | IE(%) |
|---|---|---|
| Blank | 317.40 | - |
| 2 | 142.67 | 55.10 |
| 4 | 74.90 | 76.40 |
| 6 | 64.20 | 79.77 |
| 8 | 49.93 | 84.27 |
| 10 | 17.83 | 91.38 |
It was seen that 10% SCLAE gave 91.38% IE(%). Higher Ct of SCLAE increased its corrosion IE(%), due to the increase in θ, which hold back CS dissolution. The interaction between the hetero atoms present in SCLAE Pc constituents and the metal ions from the CS surface was due to higher IE(%). The presence of many Pc constituents in SCLAE allowed for the CI of CS 20.
Elc analysis
Elc techniques comprised a method for determining CR of CS. They allowed fast assessment of the inhibitor IE(%) and surface layer durability. They were used to know whether SCLAE acted as cathodic or anodic inhibitor, or as both, against CS corrosion in 1 N HCl. They were also used to frame a suitable mechanism for SCLAE action on CS corrosion.
PDP study analysis
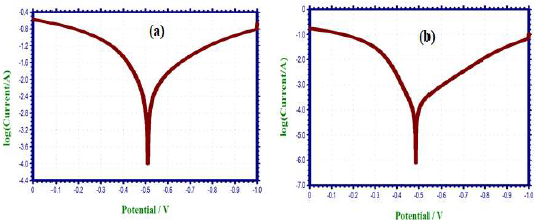
PDP technique was utilized to assess the development of a protective layer on the CS surface 21-23. If a protective film is developed on the CS surface, LPR values increase and Icorr decreases. PDP arcs of CS immersed in 1 N HCl without and with SCLAE are shown in Fig. 1.
Corrosion parameters, namely, Ecorr, (c, (a, LPR and Icorr, are given in Table 2.
Table 2: PDP parameters for CS corrosion in 1 N HCl without and with SCLAE.
| Ct(%) of SCLAE | Ecorr mV/SCE | (a mV/dec | (c mV/dec | Icorr A/cm2 | LPR Ω/cm2 |
|---|---|---|---|---|---|
| blank | - 510 | 5.949 × 10 -3 | 130 | 181 | 5.5 |
| 10 | - 492 | 1.002 × 10 -3 | 094 | 181 | 27.1 |
When CS was immersed in 1 N HCl, the following values were obtained (Fig. 1a): Ecorr was -510 mV vs. SCE; LPR was 5.5 Ohm/cm2; and Icorr was 5.949 × 10 -3 A/cm2. Ecorr shifted to the anodic side (-492 mV/SCE) (Fig. 1b), when 10% SCLAE were added to 1 N HCl, due to the formation of a protective layer on the CS surface. This film controlled CS dissolution anodic reaction, by forming a Fe2+-SCLAE complex on the anodic site 24. SCLAE acted as an anodic inhibitor, because Ecorr shift was more negative than that of the blank solution. An increase in LPR and a decrease in Icorr values indicate that the inhibitor system had a more corrosion resistant nature.
ACIS results analysis
Elc impedance spectra were used to validate the development of a protective layer on the CS surface 25-27, showing that Rct increased, Cdl decreased and the impedance log (z/ohm) rose. AC impedance parameters, namely, Rct and Cdl, are given in Table 3.
Table 3: Elc impedance parameters from Nyquist plots for the corrosion of CS immersed in 1 N HCl without and with SCLAE.
| Ct(%) of SCLAE | Nyquist plot | Impedance log (z/ohm) | Phase angle (degree) | |
|---|---|---|---|---|
| Rt Ω/cm2 | Cdl F/cm2 | |||
| blank | 6.72 | 1.1082 × 10⁻⁵ | 0.845 | 33 |
| 10 | 36.016 | 6.0593 × 10⁻⁵ | 1.569 | 54 |
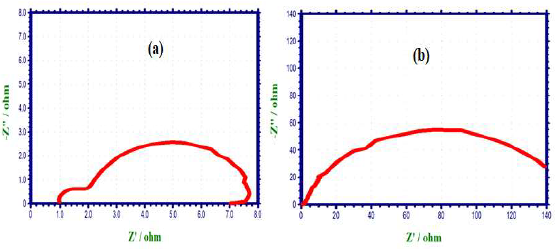
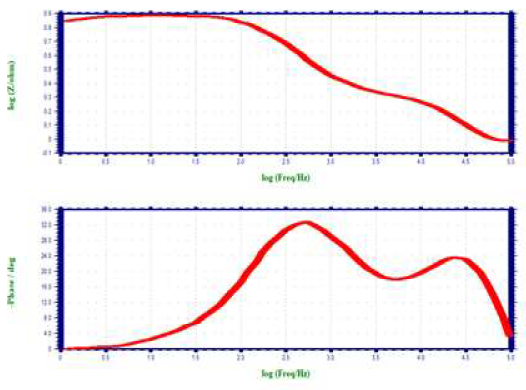
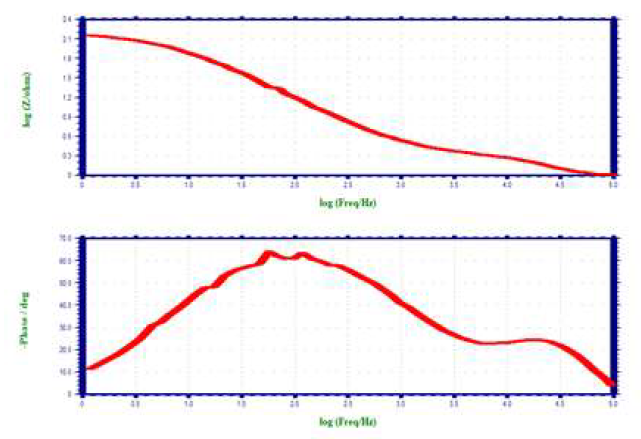
When CS was immersed in 1 N HCl, Rct was 6.72 ohm/cm2 and Cdl was 1.1082 × 10⁻⁵ F/cm-2. Rct value increased to 36.016 ohm/cm2, when 10% SCLAE was added to 1 N HCl. Cdl value also decreased to 6.0593 × 10⁻⁵ F/cm-2. The impedance value (log (z/ohm)) increased from 0.845 to 1.5698. Furthermore, the phase angle of the inhibitor system increased from 33.0 to 54.0o, when compared to the blank solution. This suggests that a protective layer was formed on the CS surface.
ACIS of CS immersed in 1 N HCl without and with SCLAE are shown in Figs. 2 (Nyquist plots) 3 and 4 (Bode plots).
FTIR spectra analysis
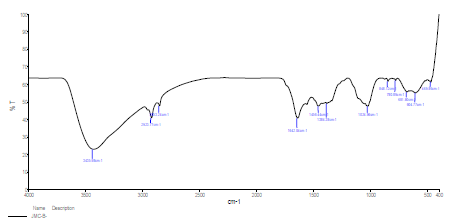
FTIR examination helps to identify the absorption bands for the functional groups, and the alignment of inhibitor molecules on the CS surface. Many researchers have reported that FTIR characterization is a major tool that can be used to predict the bonding nature of Pc constituents on the CS surface. The absorption bands of the functional groups in the corresponding systems are given in Table 4.
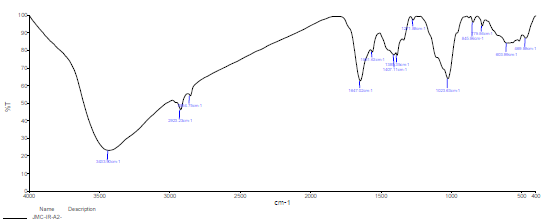
Table 4: FTIR spectral data for SCLAE, and scratched layer from the CS surface after immersion in 1 N HCl with 10% inhibitor system.
| SCLAE IR bands | IR bands of the protective layer on the CS surface | Frequency assignment to functional groups |
|---|---|---|
| 3435.98 | 3433.90 | -OH |
| 2923.77 | 2923.23 | C-H stretching |
| 1642.04 | 1647.02 | C=O stretching |
| 1024.96 | 1023.63 | C-C stretching |
| 1384.38 | 1385.35 | C-N |
| 681.80 | 603.99 | N-H |
| - | 469.89 | Y-Fe203 |
FTIR spectrum of SCLAE is shown in Fig. 5. The peaks due to OH, C-N, C-H, C-C, C=O and N-H stretching frequencies appear at 3435.98, 1384.38, 2923.77, 1024.96, 1642.04 and 681.80 cm-1, respectively 28-29.
A protective layer was developed on the CS surface immersed in 1 N HCl with 10% SCLAE (Fig. 6). Shifts occurred in the stretching frequencies from the following functional groups: O-H, from 3435.98 to 3433.90 cm-1, which indicates that molecular adsorption possibly occurred through it; C-N, from 1384.38 to 1385.35 cm-1; C-H (in the pure IR spectra of SCLAE, and in the protective layer formed over the CS surface), from 2923.77 to 2923.23 cm-1; C=O, from 1642.04 to 1647.02 cm-1; N-H, from 681.80 to 603.99 cm-1; and C-C, from 1024.96 to 1023.63 cm-1 . The band at 469.89 cm-1 mainly originated from the Fe-complex 30-31. Almost all the band peaks appeared in SCLAE and in the protective layer developed on the CS, which suggests that Pc constituents of the inhibitor molecules adsorbed onto the CS surface. All abovementioned bands represent the formation of a complex on the alloy surface.
CS surface SEM analysis
SEM pictures of the CS surface, without and with SCLAE, were examined 32, to understand the nature of the coating developed on the alloy surface. SEM images of CS specimens immersed in 1 N HCl, for 3 h, without and with SCLAE, are shown in Fig. 7 (a, b and c).
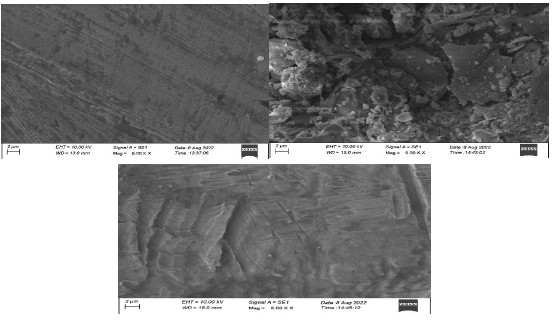
Figure 7: SEM image of polished CS coupons: (a) before immersion; (b) after immersion in 1 N HCl (blank); (c) after immersion in 1 N HCl with 10% SCLAE.
Fig. 7a shows CS (control) smooth surface. In Fig. 7b, CS has a rough surface with a highly corroded area, due to its dissolution in 1 N HCl (blank). Fig. 7c shows the CS surface decrease in corroded areas, since CR was suppressed in 1 N HCl with 10% SCLAE. CS is almost free from corrosion, due to the formation of an insoluble complex on its surface. The alloy Ra is almost equal to the one from the polished CS surface, since it was covered by a thin inhibitor layer that effectively controlled its dissolution 33-34.
CS surface characterization by EDAX analysis
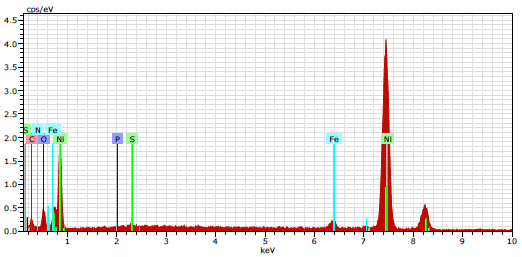
EDAX examinations of the CS surface were performed in HCl without and with the inhibitor system. EDAX spectra were used to determine the elements present on the CS surface before and after immersion in HCl with SCLAE 35.
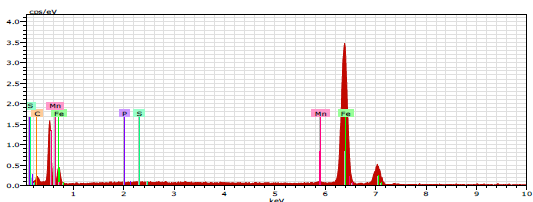
EDAX spectrum (Fig. 8) shows the characteristic peaks of some of the elements constituting the CS sample.
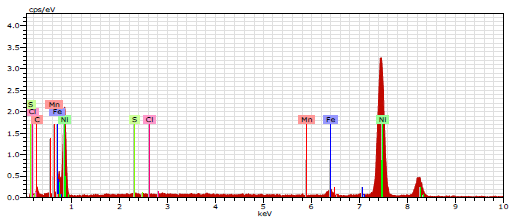
EDAX spectrum of CS immersed in 1 N HCl (Fig. 9) shows the decrease in C elements.
Cl- presence indicates CS was damaged by 1 N HCl. EDAX spectrum of CS immersed in 1 N HCl with 10% SCLAE (Fig. 10) shows: a reduction in the additional line characteristic of Cl- signals intensity; and an increase in the signal intensity of CS constituents. Fe signal appearance and O signal enhancement were due to SCLAE. These data show that the CS surface was covered with Fe, S, C, P, Ni and O atoms, due to SCLAE addition to HCl. Fig. 10 shows that Fe peaks observed in 1 N HCl with SCLAE were considerably lower than those seen in the blank solution. These results suggest that O, N and C atoms of the 10% SCLAE layer were adsorbed onto the CS surface, protecting it against corrosion, and resulting in the formation of a Fe2+-SCLAE complex 36-37.
AFM results analysis
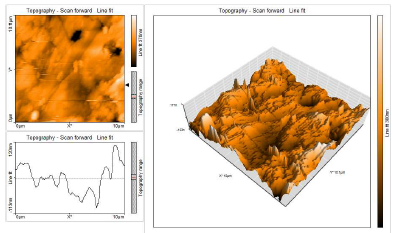
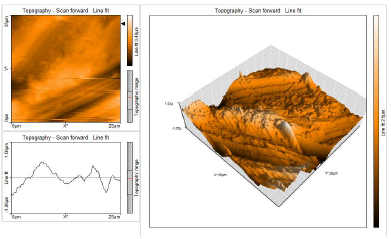
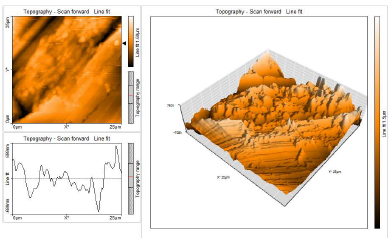
In any surface, roughness is easily investigated by AFM studies. AFM is a powerful tool for gathering roughness statistics from a variety of CS surfaces. It provides direct insight into the changes in the surface morphology that take place at several hundred nanometers. Topographical changes occur between the corrosion process and the formation of a protective layer on the CS surface, without and with inhibitors, respectively. In this study, AFM assessed SCLAE effect on the CS surface immersed in HCl 38-39.
This characterization comprised 3D AFM morphologies and a cross-sectional profile for the polished (control sample) CS surfaces and for those immersed in blank 1 N HCl and with 10% SCLAE (Figs. 11, 12 and 13, respectively).
AFM gave: Ra surface area; Sa (average deviation of all points roughness profile from a mean line over the evaluation length); RMS surface Ra, Sq (the average of the measured height deviations taken within the evaluation length, and measured from the mean line); Sy (the largest single P/V height in five adjoining sampling heights); and Sp maximum profile peak height (which indicates the point along the sampling length at which the curve is highest).
AFM parameters are given in Table 5.
Table 5: AFM data for CS immersed without and with inhibitor systems (surface area Ra).
| Samples | Sa nm | Sq nm | Sy nm | Sp nm |
|---|---|---|---|---|
| CS surface | 31.44 | 42.38 | 495.40 | 225.76 |
| CS surface immersed in 1 N HCl | 273.72 | 348.79 | 3334.00 | 1507.10 |
| CS surface immersed in 1 N HCl + 10% SCLAE | 190.55 | 240.11 | 1842.40 | 979.34 |
AFM images analysis was performed to obtain the line surface Ra (the average deviation of all points roughness profile from a mean line over the evaluation length), RMS surface, Rq (the average of the measured height deviations taken within the evaluation length and measured from the mean line), Ry (the largest single P/V height in five adjoining sampling heights) and Rp maximum peak height (it indicates the point along the sampling length at which the curve is highest). AFM parameters are given in Table 6.
Table 6: AFM data for CS immersed without and with the inhibitor system (line Ra).
| Samples | Ra nm | Rq nm | Ry nm | Rp nm |
|---|---|---|---|---|
| CS surface | 33.38 | 48.77 | 229.50 | 142.59 |
| CS immersed in 1 N HCl | 342.25 | 403.34 | 1611.94 | 559.73 |
| CS immersed in 1 N HCl + 10% SCLAE | 134.56 | 178.64 | 745.45 | 282.12 |
The table shows that surface Ra for CS in HCl (blank) was very high. With 10% SCLAE, this value decreased, being lower than that for CS in blank HCl, but higher than that for the polished surface. This was due to the protective layer that covered the CS surface. This film was found to be smooth. RMS, maximum P/V height and maximum peak height values also decreased 40-41.
Conclusion
In this study, SCLAE hindered the corrosion of CS immersed in 1 N HCl, with an IE(%) of 91.38%, as verified by WL method. PDP study indicated that the effective SCLAE system functioned predominantly as an anodic inhibitor. Elc impedance measurements showed that, due to the enlarged thickness of the layer adsorbed onto the CS surface, an increase in Rct and a decrease in Cdl and Icorr values occurred. FTIR spectra revealed that the protective film consisted of a Fe2+-SCL complex. SEM micrographs showed that the inhibited CS surface was like that of the polished one. EDAX analysis gave the constituents on the CS surface. AFM confirmed the CS surface Ra and smoothness. FTIR, SEM, EDAX and AFM analyses revealed that Pc constituents in SCLEA strongly interacted with the CS surface, forming a solid inhibition layer between the substrate and HCl. This film protected CS from HCl further attack.
Authors’ contributions
T. Raja: chose the problem; done the literature survey; integrated new ideas with existing literature; completed the experimental part. S. S. Syed Abuthahir: helped in the spectral characterization; suggested the interpretation report; guided in the paper writing. K. Vijaya: gave outlines for the manuscript preparation.
Acknowledgement
The authors are thankful to the Principal and College Management Committee Members of Jamal Mohamed College (Autonomous), for providing necessary facilities. The authors are also thankful to the DBT and DST-FIST, for providing instrumental facilities to carry out research work.
Abbreviations
AC: alternating current
ACIS: alternating current impedance spectroscopy
AFM: atomic force microscopy
Ct: concentration
Cdl: double layer capacitance
CE: counter electrode
CI: corrosion inhibitor/inhibition
CR: corrosion rate
CS: carbon steel
E: potential
Ecorr: corrosion potential
EDAX: energy dispersive analysis of X-rays
Elc: electrochemical
FTIR: Fourier transform infrared
HCl: hydrochloric acid
I: current density
Icorr: corrosion current density
IE(%): inhibition efficiency
IT: immersion time
KBr: potassium bromide
LPR: linear polarization resistance values
mdd: milligrams per square decimeter per day
MS: carbon steel
OCP: open circuit potential
Pc: phytochemicals
PDP: potentiodynamic polarization
PE: platinum electrode
P/V: peak to valley
Ra: average roughness
Rct: charge transfer resistance
RE: reference electrode
RMS: root-mean-square
SCE: saturated calomel electrode
SCL: Syzygium cumini leaves
SCLAE: Syzygium cumini leaves aqueous extract
SEM: scanning electron microscopy
SPM: scanning probe microscopy
SR: scan rate
T: temperature
WE: working electrode
WL: weight loss


