Introduction
Different metals, e.g. MS, Zn, Cu, Al, and their alloys, are frequently used to develop liquid-flowing systems, such as steam boilers, gas and oil pipelines. MS is among the most often employed metals, due to its low setup costs and excellent mechanical features 1. MS main and major disadvantage is its relatively low stability and profound degradation in corrosive environments such as HCl, H2SO4 and HNO3. Boilers, heat exchangers and other metallic materials are typically cleansed with HCl to eliminate undesired scaling and rust 2-4. CI can be added to aggressive media to minimize CR of MS under such environments 5,6. Numerous inhibitors slow down corrosion in small amounts 7,8. The electrolyte type, pH/T, corrosive ions Ct, and other parameters, influence how well inhibitors suppress corrosion reactions 9. Many organic compounds contain atoms such as N, O, S and P, which can act as good CI for metals, by interacting with the atoms on their surface, and blocking the discharge of corrosive chemicals 10,11. Most organic molecules contain heteroatoms with anticorrosive properties, but they are difficult to synthesize, expensive, and hazardous to human beings and an environment 12,13. Even though these molecules are suitable as CI, some international organizations have extensively constrained their deployment, due to safety and ecological concerns 14.
Plant extracts are rich sources of naturally synthesized molecules that can be retrieved with minimal effort and expense. Since extracts from common plants are readily available, inexpensive, biodegradable and renewable sources, researchers have been concentrating on using these bioactive molecules. Green CI are biodegradable and free of hazardous materials such as heavy metals. The inclusion and application of plant extracts as CI have recently widened, due to their low toxic effects and ease of access 15. Most naturally occurring Pc are environmentally safe and effective as CI in acidic conditions. For instance, Crotalaria pallida-A16, Dolichandra-unguis cati17, Ficus tikoua18, Chamaerops humilis19, Dardagan (20), Thevetia peruviana21, Portulaca grandiflora22, Garcinia Indica23, Allium sativum24 and Garcinia livingstonei25 extracts have been declared as suitable CI in acidic media. These molecules typically have molecular structures with benzene rings, double bonds, heteroatoms and other components. The atoms on metallic surfaces are able to establish electrostatic or covalent bonds with these molecules. Moreover, Fe atom unoccupied orbitals can accept non-bonding electron pairs from heteroatoms such as P, N, S and O. Pc of plant-based green CI interact with metallic surfaces, forming a protective barrier that suppresses corrosion.
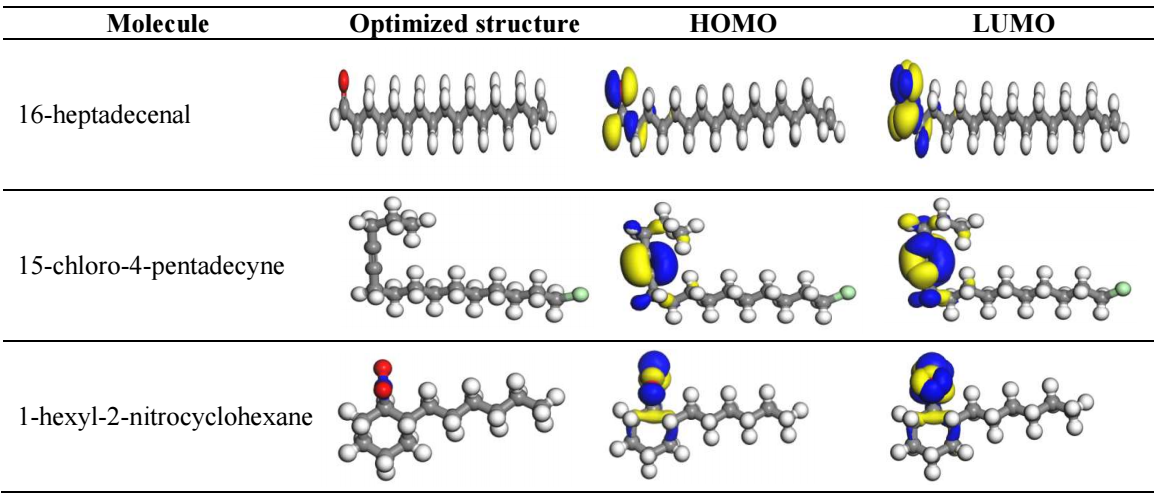
Therefore, in the present work, in order to avoid metallic corrosion, COLE was used as CI. CO can be employed for antimicrobial, hypotensive, respiratory stimulant, diuretic and anti-inflammatory medicines. As reported in literature, CO leaves contain many Pc, such as flavonoids, proteins, amino acids, steroids, saponins, glycosides and phenolic compounds. They also have chemical constituents, such as 16-heptadecenal, 15-chloro-4-pentadecyne and 1-hexyl-2-nitrocyclohexane 26,27.
In the present investigation, electrochemical and chemical methods were used to determine IE(%) of COLE against MS corrosion in a 1 M HCl solution.
Experimental
Inhibitor preparation
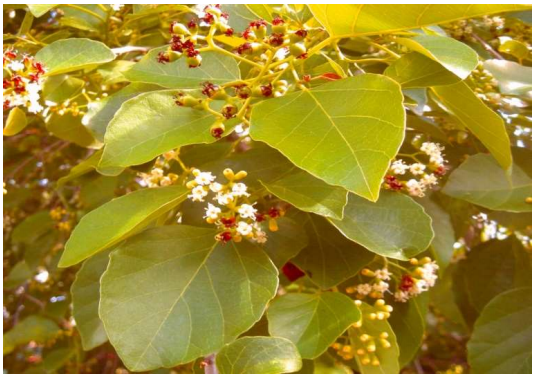
CO leaves (Fig. 1) were gathered from Karnataka Agriculture University in Dharwad, India. The leaves were cleaned up with warm H2O, and dried at room T, for a week. Then, they were pulverized, and the powder was used for the extraction method. 28 g CO leaves were put into an extraction tube containing 280 mL absolute alcohol, and then extracted using Soxhlet technique. The excess solvent was restored through the rotary evaporator method, the extract was washed with ether, and the sample was dried in a hot air oven. The crude product was collected and employed in the stock solution preparation for the corrosion experimental works.
Preparation of test solutions
The corrosive test solution (1 M HCl) was prepared by diluting analytical reagent grade HCl with double-distilled water. The experimental solution volume was 100 mL, with and without the addition of varying Ct of COLE.
Specimen preparation
Rectangular sheets of MS, with mass percentage compositions of 0.55 Mn, 0.10 C, 0.035 P, 0.025 S, 0.002 Si and the remainder Fe, were cut into different testing coupons. The MS samples were polished with various emery papers of grades 180, 400, 1000, 1500 and 2000. Each coupon was washed with double distilled water, and then dried and preserved in a desiccator.
WL method
The WL approach is the most traditional and main corrosion monitoring method. Every experiment was run at the same T (300±1 K), and a digital electronic balance was used for precisely weighing the MS samples. In WL measurements, MS coupons were immersed in 100 mL 1 M HCl, without and with COLE, in different Ct. After the desirable interval periods, the test specimens were removed, and their WL values were recorded using the digital electronic weighing balance.
Electrochemical measurements
Polarization experiments were performed in a conventional three-electrode cell, with Pt as CE, SC as RE and MS as WE. MS WE, with an exposed surface area of 1 cm2, was used for the measurements. Before being measured, the WE was mechanically polished, rinsed several times with double distilled water, and dried. The WE was immersed in the test solution, for 30 min, in order to stabilize Ecorr , before recording polarization curves. At a SR of 0.01 V/s-1, PDP data were recorded at E of ± 200 mV/s-1. An AC signal with an amplitude of 5 mV/s-1, and a frequency response from 1 Hz to 100 kHz, was used to quantify impedance spectra. The findings of the impedance data were analyzed by Z-Simp win software version 3.21. This software was employed to fit the relevant data from the experiments with conventional electrical circuits.
Adsorption isotherms and thermodynamic parameters
The measured values were closely correlated with several adsorption models, which included Langmuir’s, Bockris-Swinkels’s, Temkin’s, Flory-Huggins’ and Freundlich’s isotherms, for evaluating COLE mode of adsorption onto MS surfaces, at various T. Activation parameters were employed to determine how T affected the MS surface corrosion process hindered by COLE.
FT-IR analysis
FT-IR spectra of pure COLE, and the scratched compound from the MS surface (corrosion product) containing an optimum inhibitor Ct, were examined using a Nicolet 5700 spectroscope, at a frequency range from 4000 to 400 cm-1.
Surface analysis
MS substrates surface morphology, before and after immersion in the test solutions, were examined using SEM and WCA techniques.
Quantum chemical calculations
Quantum chemical computations were done by Materials Studio software, applying DMol3 module based on DFT (Accelrys Company). COLE molecules geometry was optimized using GGA/BLYP approach. The optimization was followed by quantum chemical calculations, using the same technique.
Results and discussion
WL measurements
In 1 M HCl, IE(%) of COLE (at varying Ct) on MS surface corrosion was determined. As shown in Table 1, the CR of MS was determined when the alloy was immersed in 1 M HCl, at 300±1 K, without and with COLE.
The WL method analysis is typically employed to figure out the deterioration level on the metal surface, as discussed by (28). IE(%) of COLE, at varying Ct of 3.75, 5.0, 6.25 and 7.5 mg/L, was assessed at 300±1 K. In this approach, MS coupons were immersed in 1 M HCl, for 1, 2, 3, 4, 5 and 6 h, at 300±1 K, without and with COLE. WL was estimated using the changes in weight of each MS strip, prior to and after corrosion in the test solutions. Applying standard formulae, variables such as IE(%), CR and θ were obtained, as shown in Table 1. CR in mpy was obtained from the following eq:
where A is the specimen area, t is IT and D is the specimen density.
IE(%) and θ were determined by using the following eqs.:
where W1 and W2 are the WL of MS without and with COLE, respectively.
Table 1: WL measurements for obtaining CR of MS and IE(%) of COLE.
| IT (h) | Ct (mg/L) | CR (ʋ) | IE(%) | θ |
|---|---|---|---|---|
| 1 | Blank | 263.52 | - | - |
| 3.75 | 24.51 | 90.69 | 0.9069 | |
| 5.0 | 18.39 | 93.02 | 0.9302 | |
| 6.25 | 12.26 | 95.34 | 0.9534 | |
| 7.5 | 6.13 | 97.67 | 0.9767 | |
| 2 | Blank | 223.69 | - | - |
| 3.75 | 18.39 | 91.78 | 0.9178 | |
| 5.0 | 15.32 | 93.15 | 0.9315 | |
| 6.25 | 12.26 | 94.52 | 0.9452 | |
| 7.5 | 9.19 | 95.89 | 0.9589 | |
| 3 | Blank | 165.47 | - | - |
| 3.75 | 14.29 | 91.35 | 0.9135 | |
| 5.0 | 10.21 | 93.82 | 0.9382 | |
| 6.25 | 8.17 | 95.06 | 0.9506 | |
| 7.5 | 4.09 | 97.35 | 0.9735 | |
| 4 | Blank | 163.94 | - | - |
| 3.75 | 10.72 | 93.45 | 0.9345 | |
| 5.0 | 7.66 | 95.42 | 0.9542 | |
| 6.25 | 6.13 | 96.26 | 0.9626 | |
| 7.5 | 3.06 | 98.13 | 0.9813 | |
| 5 | Blank | 212.04 | - | - |
| 3.75 | 7.35 | 96.53 | 0.9653 | |
| 5.0 | 6.13 | 97.10 | 0.9710 | |
| 6.25 | 4.90 | 97.68 | 0.9768 | |
| 7.5 | 3.68 | 98.26 | 0.9826 | |
| 6 | Blank | 310.51 | - | - |
| 3.75 | 5.11 | 98.35 | 0.9835 | |
| 5.0 | 4.09 | 98.68 | 0.9868 | |
| 6.25 | 3.06 | 99.01 | 0.9901 | |
| 7.5 | 2.04 | 99.34 | 0.9934 |
IE(%) of COLE against MS corrosion had the maximum value of 99.34, for 6 h IT in 1 M HCl, with an optimum Ct of 7.5 mg/L. Generally, when the inhibitor Ct is high, its action is stronger, and the metal CR decreases 29. IE(%) of COLE slightly changed with higher Ct up to 7.5 mg/L, due to its components desorption from the MS substrate. It was found that a decrease in CR of MS was correlated with a rise in Ct of COLE. This suggests that COLE adsorbed onto the MS surface, or at the solution-metal interface that covers a larger surface area. Several Pc containing carbonyl, hydroxyl, carboxylic acid functional groups and benzene rings are derived from natural product extracts, allowing them to efficiently donate electrons to the metallic substrate, minimizing its dissolution in acidic media. The protective covering on the metal substrate will become denser as the inhibitor Ct is increased, eventually resulting in corrosion protection 30.
Polarization studies
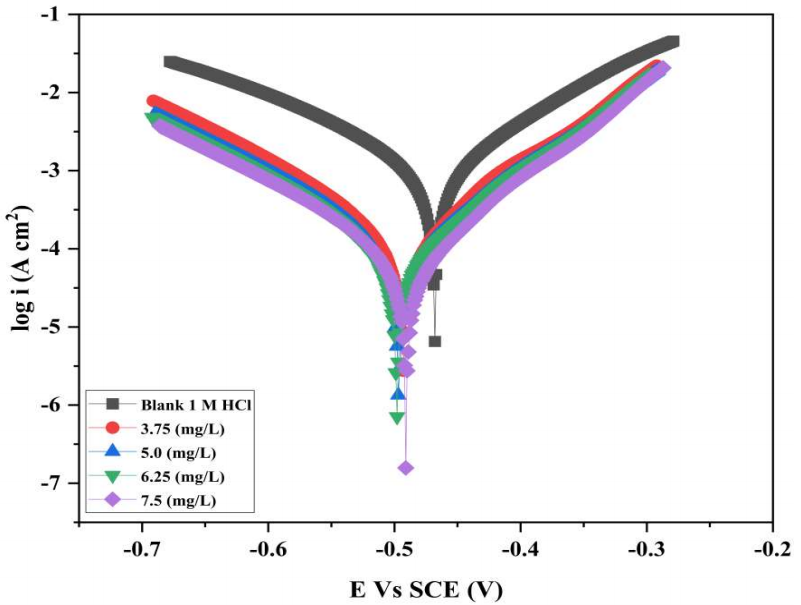
Fig. 2 displays the Tafel polarization plots for MS strips without and with varying Ct of COLE in 1 M HCl, at 300±1 K.
Table 2 lists electrochemical variables, which include IE(%), βc, βa, Ecorr and icorr. The following eq. was employed to compute IE(%) of COLE.
where icorr without COLE is i corr o .
| Ct (mg/L-1) | Ecorr (V vs. SCE) | Icorr (A/cm-2) | βa (V/dec) | -βc (V/dec) | CR (mm/yr) | IE(%) |
|---|---|---|---|---|---|---|
| Blank | -0.468 | 1.043 × 10⁻³ | 9.847 | 7.673 | 4.774 × 10² | - |
| 3.75 | -0.493 | 1.271 × 10⁻⁴ | 9.853 | 9.515 | 5.818 × 101 | 87.81 |
| 5.0 | -0.497 | 1.002 × 10⁻⁴ | 11.323 | 8.950 | 4.586 × 101 | 90.39 |
| 6.25 | -0.498 | 7.936 × 10⁻⁵ | 11.921 | 9.149 | 3.633 × 101 | 92.39 |
| 7.5 | -0.491 | 6.666 × 10⁻⁵ | 12.082 | 8.930 | 3.051 × 101 | 93.61 |
It is clear from the findings in Table 2 that CR lowered as Ct of COLE rose. As shown in Fig. 2, COLE adition caused anodic and cathodic polarization curves to move towards lower icorr values, thus minimizing MS corrosion in HCl. This reveals that, as Ct of COLE rose, it progressively interacted with the MS substrate. COLE is a very efficient CI for MS, due to its increased IE(%) with higher Ct. There was a predicted shift in Ecorr with COLE, since it blocked MS oxidation process at the anode, and the redox reactions at the cathode 31. βa and βc values simultaneously shifted when COLE was added to the corrosive solution, confirming its effect on both cathodic and anodic processes. In other words, COLE bound to the cathode and anode sites, and modulated MS corrosion along with H liberation. The present polarization studies for COLE obtained a IE(%) of 93.61.
EIS measurements
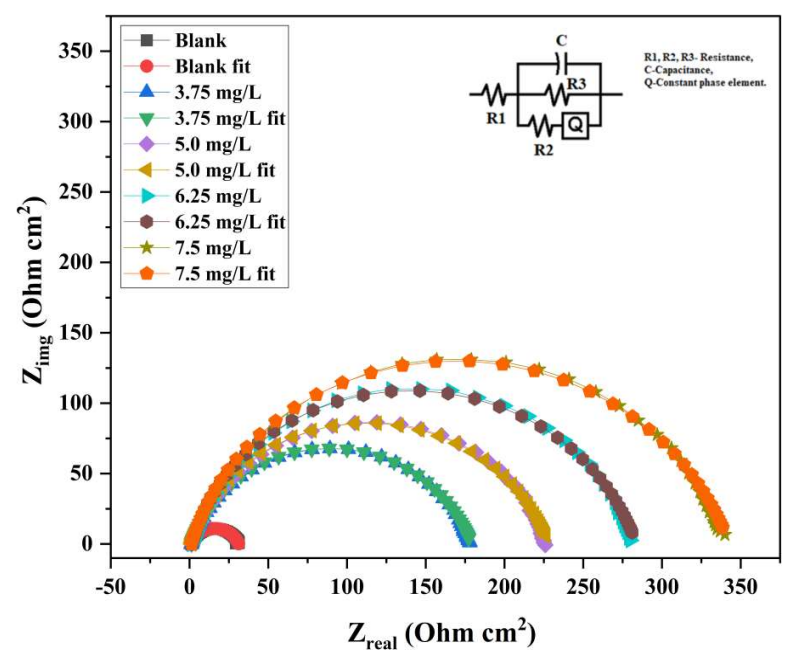
EIS allows a quantitative understanding of the electrode process kinetics and surface features at the metal/solution interface. Monitoring the corrosion process is simple and quick with EIS, and the tests were executed nearly to Ecorr, rendering the results acceptable. Due to the lower magnitude of the applied voltage, EIS also functions as a harmless assessment. Nyquist plots for MS with and without varying Ct of COLE in a 1 M HCl solution, at 300±1 K, are displayed in Fig. 3. The acquired impedance data were assessed by fitting them into a conventional electrochemical circuit that is depicted in Fig. 3. The fitted curve produced by the equivalent electrical circuit almost precisely matched the experimental curve, as shown in Fig 3. Table 3 summarizes the determined corrosion variables, which include Rp, Cdl, observed IE(%) and θ. The following relation was employed to compute IE(%).
Nyquist plots in Fig. 3 strongly imply COLE effect on the CR of MS, by comparing the sizes of semicircle diameters in the solution with inhibitor to those in the one without it.
As COLE Ct reached 7.5 mg/L, a maximum IE(%) of 90.07 was obtained. The semicircle width increased. However, no noticeable change was seen above this level. Additionally, Nyquist plots resulted in irregular single depressed semicircles or frequency dispersion. This common occurrence in solid electrodes is induced by the electrode surface inhomogeneities and roughness. EIS variables values that were computed by fitting the experimental results to the employed electrochemical circuit model are listed in Table 3.
Table 3: EIS parameters for MS in 1 M HCl without and with different COLE Ct.
| Ct (mg/L-1) | Rp (Ω/cm2) | Cdl (μF/cm2) | IE(%) | θ |
|---|---|---|---|---|
| Blank | 34.51 | 33.25 | - | - |
| 3.75 | 182.67 | 30.06 | 81.11 | 0.8111 |
| 5.0 | 231.89 | 25.77 | 85.12 | 0.8512 |
| 6.25 | 288.22 | 24.74 | 88.03 | 0.8803 |
| 7.5 | 347.36 | 24.03 | 90.07 | 0.9007 |
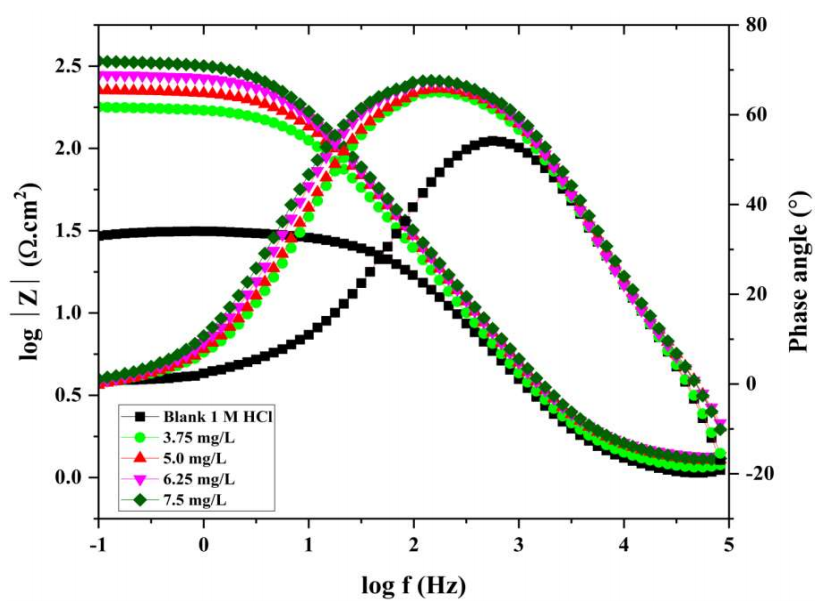
The results indicate that Cdl dropped, Rp increased, and the CI parameters improved when Ct of COLE rose. COLE hindered corrosion through its adsorption at the metal/solution interface, which is validated by the fact that Cdl values decreased with higher Ct of COLE. This behavior was due to a rise in the electrical double layer thickness. The rise in Rp readings with higher Ct of COLE implies an increase in Rct. The fact that the capacitive loop width widened as Ct of COLE increased reinforces this claim. Rp is equal to the sum of Rct and Rad34. Nyquist plots, which exhibit a peak at an intermediate frequency, relate to Bode plots in Fig. 4. This implies that the double-charged layer at the MS-solution interface was solely associated with a one-time constant.
Furthermore, Fig. 4. shows that, at low frequencies, the relative impedance values rose with higher Ct of COLE. Thus, numerous COLE molecules were adsorbed onto the MS surface. With higher Ct of COLE, the charge transport mechanism was more complex, due to the thicker adsorption layer. Cdl was enhanced by employing a CPE, since COLE components adsorption properties significantly affected the charge transfer process, allowing for more precise experimental data acquisition.
Activation parameters
IE(%) of COLE decreased from 300 to 320±1 K in 1 M HCl, as shown in Table 4. Metal dissolution occured with every 5 K rise in T, from 300 to 320±1 K. The decrease in IE(%) with rising T implies that the protective coating could not withstand longer IT. The increased Ct of COLE improved its IE(%) and lowered the CR of MS, as seen in Table 4.
Table 4: Effect of T, from 300 to 320 ±1 K, in 1 M HCl without and with different Ct of COLE.
| Temp. (K) | Ct (mg/L) | CR (ʋ) | IE(%) | θ |
|---|---|---|---|---|
| 300 | Blank | 214.49 | - | - |
| 3.75 | 24.51 | 88.57 | 0.8857 | |
| 5.0 | 18.39 | 91.42 | 0.9142 | |
| 6.25 | 12.26 | 94.28 | 0.9428 | |
| 7.5 | 6.13 | 97.14 | 0.9714 | |
| 305 | Blank | 300.29 | - | - |
| 3.75 | 42.90 | 85.71 | 0.8571 | |
| 5.0 | 36.77 | 87.75 | 0.8775 | |
| 6.25 | 24.51 | 91.84 | 0.9184 | |
| 7.5 | 18.39 | 93.88 | 0.9388 | |
| 310 | Blank | 428.99 | - | - |
| 3.75 | 73.54 | 82.85 | 0.8285 | |
| 5.0 | 61.28 | 85.71 | 0.8571 | |
| 6.25 | 49.03 | 88.57 | 0.8857 | |
| 7.5 | 36.77 | 91.43 | 0.9143 | |
| 315 | Blank | 625.10 | - | - |
| 3.75 | 116.44 | 81.37 | 0.8137 | |
| 5.0 | 98.05 | 84.31 | 0.8431 | |
| 6.25 | 79.67 | 87.25 | 0.8725 | |
| 7.5 | 61.28 | 90.19 | 0.9019 | |
| 320 | Blank | 741.54 | - | - |
| 3.75 | 147.08 | 80.16 | 0.8016 | |
| 5.0 | 122.57 | 83.47 | 0.8347 | |
| 6.25 | 98.05 | 86.78 | 0.8678 | |
| 7.5 | 79.67 | 89.26 | 0.8926 |
With COLE adsorption, an adhered layer was developed on the MS surface 37. This experiment revealed that E * a was associated with the corrosion process, by assessing the variations in the CR of MS, when it was subjected to various solution T 38. Arrhenius eq. was used to compute E * a .
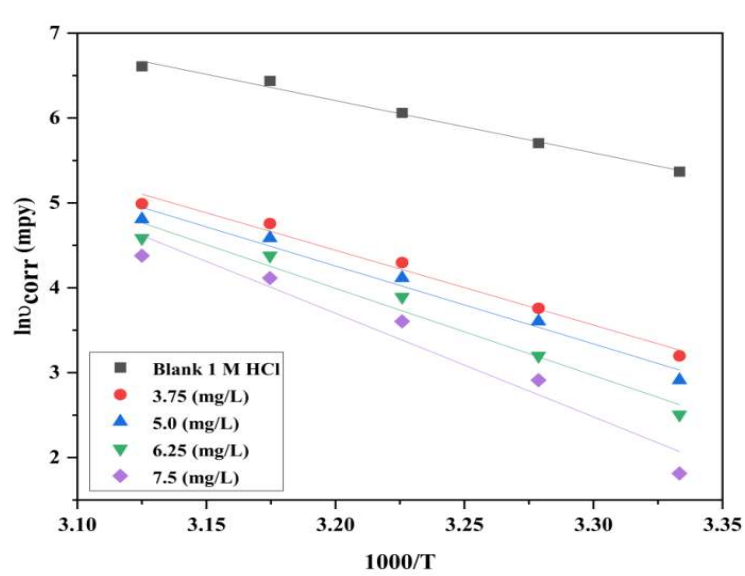
where A is Arrhenius pre-exponential factor and R is the gas constant. Arrhenius plot was constructed using lnυcorr vs. 1000/T (Fig. 5), and Ea * values were determined from the slope (-Ea */R) of the graph straight lines, which are included in Table 5.
Table 5: COLE activation parameters.
| Ct (mg/L) | Ea* (kJ/mol-1) | A (kJ/mol-1) | ΔH* (kJ/mol-1) | ΔS* (J/mol-1/K-1) |
|---|---|---|---|---|
| Blank | 51.37 | 1.918 × 10¹¹ | 115.98 | -23.69 |
| 3.75 | 73.32 | 1.533 × 10¹⁴ | 202.45 | -23.67 |
| 5.0 | 76.45 | 4.252 × 10¹⁴ | 214.42 | -23.66 |
| 6.25 | 85.48 | 1.055 × 10¹⁶ | 246.18 | -23.65 |
| 7.5 | 101.55 | 3.819 × 10¹⁸ | 301.55 | -23.63 |
The higher Ea * values in the solution with COLE than in those without it showed that it presence hindered MS dissolution. The incresed Ea * value in the solution with COLE caused its stronger adsorption onto MS, which produced mass and charge transfer barriers. The transition state eq. was used to compute ΔH* and ΔS*, which is given in Table 5. The transition state eq. is represented as:
where N is Avogadro’s number and h is Plank’s constant.
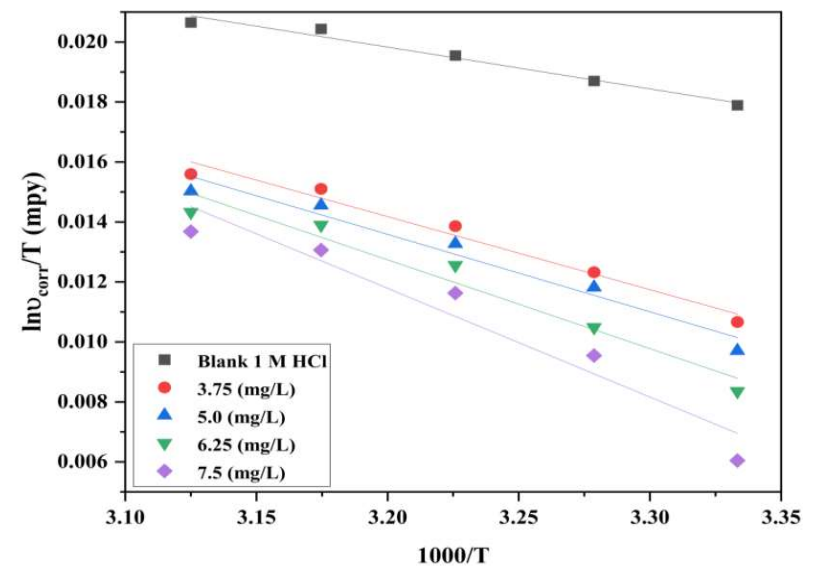
Fig. 6 shows the correlation between ln (υcorr/T) against 1000/T, which gave a slope of -ΔH*/R and an intercept of ΔS* = intercept-ln(R/Nh). The obtained variables, such as ΔH* and ΔS*, are listed in Table 5. Positive ΔH* values indicate stronger inhibitor adsorption onto the MS surface, and a rise in endothermic nature. COLE components adsorption onto the MS surface prevented the active sites from functioning, interfering with H ions interactions. In the rate-determining phase, COLE presence increased ΔS* factors, which reduced the disorder from the activated complex to the reactants 39,40.
Adsorption isotherms and thermodynamic parameters calculations
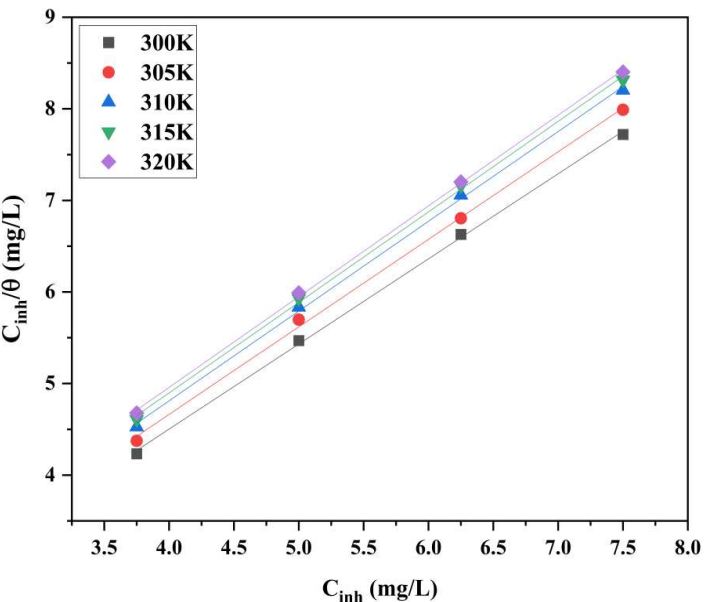
COLE adsorption mechanism investigation provides valuable information about the CI mechanism. A thorough understanding of E * a can give insight on the adsorption process and changes in IE(%) with T change. According to WL outcomes, T increased, which decreased IE(%) of COLE. By plotting Cinh/θ mg/L vs. Cinh mg/L, it can be seen that COLE components followed Langmuir’s isotherm (Fig. 7).
The adsorption process of this model was analyzed through standard eq. 8. In the presence of various Ct of COLE in HCl, E * a was found to be greater than in their absence. This difference in inhibition performance and E * a was due to physical adsorption 41. As the solution T was raised, it was found that corrosion IE(%) decreased, implying COLE constituents weaker adsorption onto the MS specimen 42. COLE may adsorb on the metal surface by physical adsorption, chemical adsorption, or both, depending on several factors such as the electrolyte, the metal type and the solution T 43. Therefore, the inhibition performance assessed by the WL method was used to determine θ.
where C is Ct of COLE. Kads values were attained employing the intercepts of Cinh/θ axis 44. ∆G ads o is typically used to analyze the interactions between the MS surface and COLE constituents. Kads is associated to ∆G ads o by eq. 9.
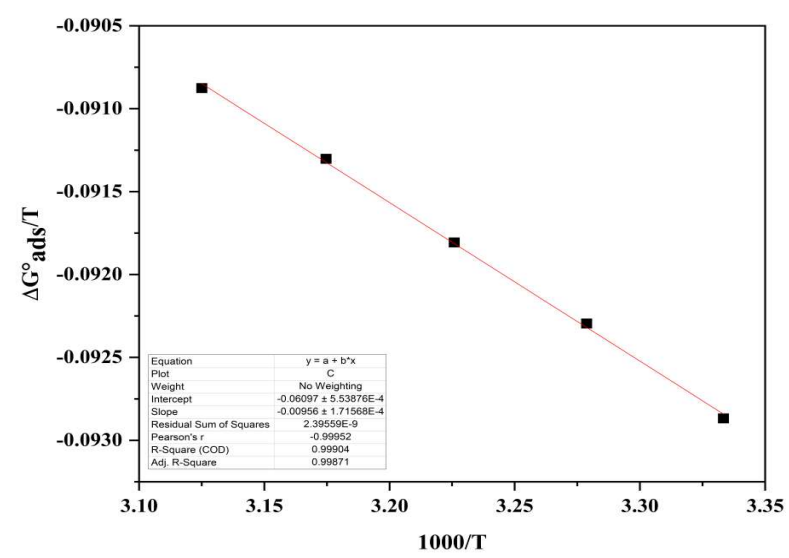
where C H 2 O is equivalent to 1000 g/L of water. As seen in Fig. 8, the slope values of ∆G ads o /T vs. 1000/T graph were employed to quantify ∆H ads o .
∆𝑆 𝑎𝑑𝑠 𝑜 was determined by using Gibbs-Helmholtz eq.
Kads, ∆G ads o , ∆H ads o and ∆S ads o are mentioned in Table 6. Greater Kads values demonstrate good CI of COLE, and electrostatic contact between the double layer on the interface between the two phases and the adsorbed components, as shown in Table 6.
Table 6: Thermodynamic parameters for COLE adsorption onto MS in 1 M HCl, at various T.
| T (K) | Kads (L/mg-1) | (G0 ads (kJ/mol-1) | (H0 ads ( kJ/mol-1) | (S0 ads (J/mol-1/K-1) |
|---|---|---|---|---|
| 300 | 1275.43 | -27.86 | -9.56 | 124.73 |
| 305 | 1190.36 | -28.15 | -9.56 | 123.36 |
| 310 | 1122.42 | -28.46 | -9.56 | 122.65 |
| 315 | 1058.14 | -28.76 | -9.56 | 121.65 |
| 320 | 1004.95 | -29.08 | -9.56 | 120.75 |
Higher T produced thermal agitation of COLE components, decreasing their adsorpsion onto the MS surface, and facilitating their interchange with the solution. Negative ∆G ads o values were due to COLE spontaneous adsorption and protective layer formed on the MS surface.
∆𝐺 𝑎𝑑𝑠 𝑜 values near -20 kJ/mol and 40 kJ/mol imply physical and chemical adsorption, respectively. ∆G ads o values, calculated using the conventional approach for 1 M HCl, ranged from -27.86 to -29.08 kJ/mol. The results suggest that physical and chemical interactions played an essential role in the adsorption of COLE constituents onto the MS surface 38. ∆H ads o (-9.56 kJ/mol) negative results revealed that COLE adsorption mechanism was exothermic. ∆S ads o positive values strongly suggest an increase in disorder, due to COLE molecules adsorption onto the MS surface, through H2O molecules desorption, leading to a rise in ∆S ads o 45.
FT-IR studies
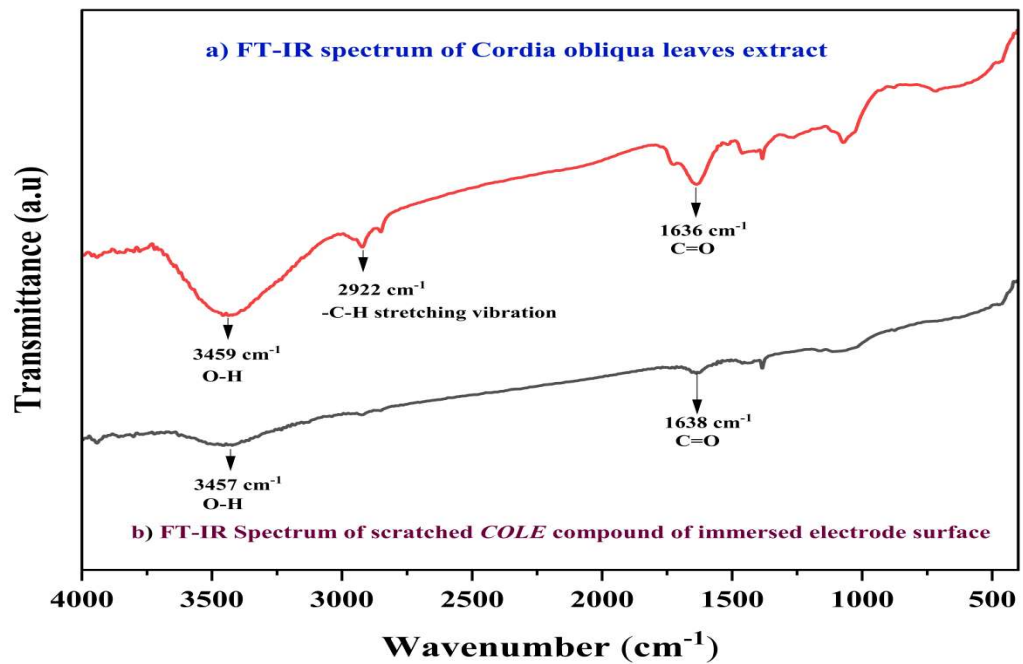
FT-IR studies determined COLE adsorption mechanism onto the MS surface. FT-IR spectra of pure COLE are shown in Fig. 9.
FT-IR spectra show a significant peak at 3459 cm-1 that corresponds to O-H stretching. The peak at 2922 cm-1 corresponds to C-H stretching vibration, whereas the band at 1636 cm-1 is related to the carbonyl group.
When immersed in 1 M HCl with COLE, the MS specimen suffered substantial variation in the absorbance peak of the functional group. FT-IR spectra of the scratched COLE compound showed the broad band at 3457 cm-1, which validated O-H group presence. C=O group frequency moderately varied for pure COLE, with a peak at 1638 cm-1. These outcomes imply that COLE contains functional groups which make it an effective CI. O heteroatom and π- bond enabled COLE molecules adsorption onto MS. In particular, electron-rich entities may rapidly form a protective coating on metal substratesm, due to their high affinity with electrons.
SEM
SEM was used to examine MS morphological characteristics during corrosion and CI processes. Figs. 10a-c show SEM micrographs of the polished MS surface after immersion in 1 M HCl without and with COLE.
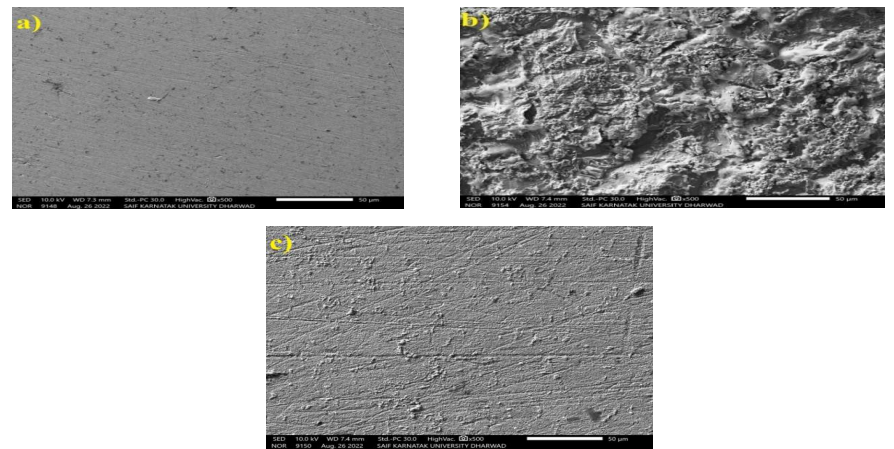
Figure 10: SRM of MS a) polished; b) with IT of 20 h in 1 M HCl; c) with IT of 20 h in 1 M HCl with 7.5 mg/L COLE.
As depicted in Fig. 10a, MS surface is smooth and clean. In Fig. 10b, the MS surface immersed in HCl without COLE was adversely affected, and became increasingly non-uniform, with cracks and cavities. However, when MS was immersed in HCl with 7.5 mg/L COLE, its surface was less damaged and displayed a more even distribution, as shown in Fig.10c. This implies that a coating layer formed on the MS surface, weakening electrochemical interaction between it and HCl. So, as demonstrated in Fig.10c, CR of MS decreased when it was immersed in COLE, as there are fewer cracks, fractures, fissures and pits 46.
WCA studies
The hydrophilicity level of MS immersed in 1 M HCl, without and with COLE, was assessed by examing the droplet. The tests were conducted in duplicate, and the pictures of the acquired WCA are shown in Figs. 11a and b.
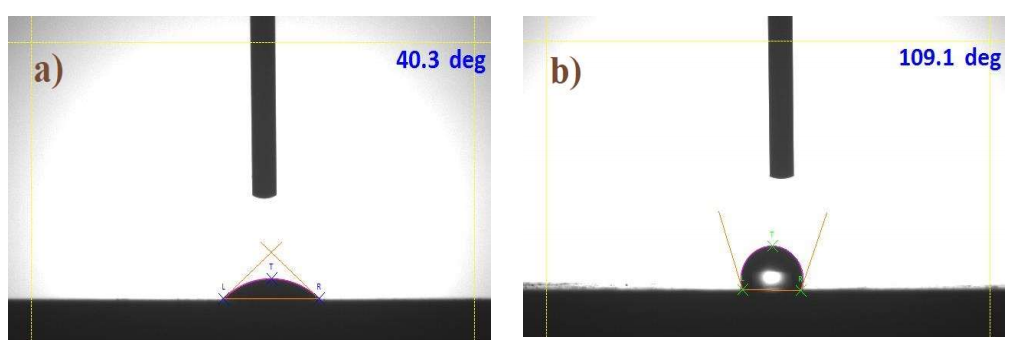
Figure 11: WCA evaluation of MS immersed in a) 1 M HCl (WCA = 40.3o); b) 1 M HCl with 0.75 mg/L COLE (WCA = 109.1o).
It is seen that WCA value changed when COLE was added to the HCl solution. H bonds were created among metal oxides and atoms in HCl, and this is why the MS sample tended to have a low WCA 47. WCA values of MS immersed, for 20 h, in 1 M HCl without COLE decreased to 40.3ο, as shown in Fig. 11a. Fig. 11b shows that the WCA of MS immersed, for 20 h, in 1 M HCl with 7.5 mg/L COLE, increased to 109.1ο. MS unevenness and the corrosion products that was formed on its surface are crucial parameters for the WCA. Also, as Ct of COLE was increased, the MS surfaces hydrophobicity and WCA peaked, as shown in Fig. 11b. With higher Ct of COLE, the droplet WCA changed significantly, revealing that it was more difficult to form H bonds between MS and HCl 48. The investigation showed that COLE blocked H bonding, making the MS surface hydrophobic, which further helped to minimize its corrosion 49.
Quantum chemical calculations
EHOMO, ELUMO and ΔEL-H, along with EA, IP, χ, η, σ and ω, were determined utilizing eqs. at the BLYP/GGA level, in the gas phase 50. The parameters are presented in Table 7.
Table 7: Computational results of an orbital value obtained for the COLE molecules.
| Molecule | EHOMO (eV) | ELUMO (eV) | ΔE (eV) | I | A | χ | η | σ | ω | ΔN |
|---|---|---|---|---|---|---|---|---|---|---|
| 16-heptadecenal | -5.7449 | -3.2323 | 3.982 | 5.745 | 3.232 | 3.5258 | 1.9908 | 0.99538 | 3.1222 | 0.8726 |
| 15-chloro-4-pentadecyne | -5.7465 | -2.1972 | 3.856 | 5.746 | 2.197 | 2.7579 | 1.9281 | 0.96404 | 1.9724 | 1.1001 |
| 1-hexyl-2-nitrocyclohexane | -6.2439 | -2.3254 | 3.626 | 6.244 | 2.325 | 4.4904 | 1.8128 | 0.90641 | 5.5615 | 0.6922 |
Quantum chemical calculations revealed that COLE gave electrons to the unoccupied ‘d’orbital of Fe atoms in MS, by combining with adequate acceptor molecules. HOMO of COLE bound with MS unoccupied ‘3d’ orbital, and its LUMO could accept electrons from the filled ‘4s’ orbital. As per DFT, the CI molecules adsorbed onto the MS surface, due to the interaction between the acceptor-donor of electron-rich COLE entities and MS electron-deficient sites 51. This led to the formation of a transition state, which played a significant part in chemical reactivity, and COLE components tendency to adsorb onto MS substrates, as shown in Fig. 12 52.
EHOMO suppliesd pi-electrons to the relevant recipient molecules of vacant d-orbitals of MS atoms and, as such, it helped to increase COLE adsorption onto the metal surface. ELUMO was more able to receive electrons. It was associated with EA, and its lower value suggested that COLE electrons were accepted. Consequently, donor-acceptor interaction occured, enhancing COLE components interaction with the MS surface. Furthermore, COLE molecules smaller Egap values improved their adsorbsion capability onto MS substrates, leading to greater IE(%), because less energy is needed to eliminate an electron from the last filled orbital 53. COLE had low ELUMO values, which implies a higher potential of this molecule to receive electrons. It also had a low Egap value, which suggests a greater level of reactivity.
Conclusion
CO leaves are environmentally benign, since they contain many biodegradable bioactive components, and have various applications in day-to-day life. Experimental and theoretical investigations confirmed that COLE inhibited MS corrosion in a 1 M HCl solution. 7.5 mg/L Ct of COLE decreased the CR of MS in 1 M HCl, and its maximum IE(%) was 99.34. Based on PDP results, COLE reduced anodic dissolution and cathodic H evolution rates. EIS data demonstrated that COLE increased Rp, while it decreased Cdl values. In addition, COLE adsorption characteristics were related to Langmuir’s isotherm. Thermodynamic and E* a parameters described COLE adsorption onto the MS surface as being of the mixed type. FT-IR spectra of pure COLE and of MS immersed in 1 M HCl with the inhibitor revealed the complex formation between Fe ions from the metal and CI components. SEM and WCA analyses revealed that COLE formed a protective film on the MS surface. The outcomes from DFT modeling approaches to quantum mechanical calculations confirmed that efficient electron-rich areas of COLE molecules had the primary role in their adsorption. Consequently, environmentally friendly COLE inhibitor might be considered a significant, long-lasting and biodegradable green CI for MS in an acidic medium.
Acknowledgement
The authors acknowledge the University Science Instruments Centre, Karnatak University, Dharwad, for providing FT-IR, SEM and AFM devices, to carry out the research work. They also acknowledge DST, New Delhi, for extending the instrument facilities under DST/PURSE-Phase-II grant no. SR 2/13(G) program. Ragini L. Minagalavar is grateful to Karnatak University, Dharwad, for providing University research studentship.
Authors’ contributions
Ragini L. Minagalavar: investigation; methodology; visualization; data curation; original draft preparation and writing. Manohar R. Rathod: conception and design of the study; software; data curation; review and editing. S. K. Rajappa: supervision; writing, reviewing and editing. A. M. Sajjan: software; data curation.
Abbreviations
AC: alternating current
Cdl: double layer capacitance
CE: counter electrode
CI: corrosion inhibitor/inhibition
CO: Cordia Obliqua
COLE: Cordia Obliqua leaves extract
CPE: constant phase element
CR: corrosion rate
Ct: concentration
DFT: density functional theory
E: potential
E* a: activation energy
EA: electron affinity
Ecorr: corrosion potential
EHOMO: energy of the highest occupied molecular orbital
EIS: electrochemical impedance spectroscopy
ELUMO: energy of the lowest unoccupied molecular orbital
FT-IR: Fourier transform infrared
G: Gibbs free energy
H2SO4: sulfuric acid
HCl: hydrochloric acid
HNO3: nitric acid
icorr: corrosion current density
IE(%): percentage inhibition efficiency
IP: ionization potential
IT: immersion time
Kads: equilibrium constant for the adsorption process
MS: mild steel
OCP: open circuit potential
Pc: phytoconstituents
Rad: adsorption resistance
Rct: charge transfer resistance
RE: reference electrode
Rp: polarization resistance
SCE: saturated calomel electrode
SEM: scanning electron microscopy
SR: scan rate
T: temperature
WCA: water contact angle
WE: working electrode
Symbols definitions
(a: anodic Tafel slope
(c: cathodic Tafel slope
ΔEL-H: energy gap between LUMO and HOMO
ΔH*: standard activation enthalpy
ΔS*: standard activation entropy
η: chemical hardness
θ: surface coverage
σ: chemical softness
χ: electronegativity
ω: electrophilicity


