Introduction
EP coatings must have certain properties, depending on their intended use, which may be functional, decorative or both. These properties are strongly related to the coating films morphological and structural characteristics, which are determined by ED conditions, namely, bath composition and applied I/E profile. The bath, which is sometimes buffered, contains the metal salt to be deposited, and an acid or alkali for increasing conduction. The addition of other organic or inorganic species may have specific purposes, e.g., to improve leveling, or optimize chemical, physical or technological properties of the deposited metal (corrosion resistance, brightness or reflectivity, hardness, mechanical strength, ductility, internal stress, wear resistance or solderability) 1,2 ED of Zn has been widely used to prolong steel service life, due to its sacrificial corrosion phenomenon. Steel coating by Zn through ED is one of the most economical ways of protecting it, given the low cost and ecofriendly nature of the process 3. Over the years, EP in Zn baths, which has been developed to produce bright and levelled deposits with higher quality, has prompted considerable interest 4,5. ED baths are used for enhancing corrosion resistance and produce defect-free amorphous coatings. Among these, baths based on acid chlorides with grain modifiers, complexing and buffering agents, have become more popular, since they are economically advantageous and easier to handle. H3BO3 is primarily added to Cl-baths, to improve the salt buffering and complexing abilities. Furthermore, H3BO3 has been reported to block active sites for HER, when it is co-deposited with Zn during the EP process, which affects their properties 5-7. This phenomenon may be prevented by the addition of different reagents.
Organic additives used in ED of Zn are typically brighteners and surfactants. Brighteners are small aromatic and aliphatic compounds that contain functional groups, such as aldehyde, ketone, carboxylic acid and amines, which give the deposit a mirror-like appearance. Surfactants act as levelers and grain refiners in the EP bath, improving the surface finish 3,5. These additives widen the operation window for the ED process, which may also increase the solubility of the secondary additives that function as wetting agents. However, the interactions involved in this process may be very complex 4. It is usually considered that the surfactants activity, depending on their Ct, involves their adsorption at the cathode surface during ED. As CMC is achieved, bilayers or multilayers at the electrode interface are formed. The effect on the electron transfer rate includes the blocking of higher j values from active sites, and improved electrostatic interactions between electroactive and adsorbed species 7-9. Different mechanisms have been proposed to explain the surfactants interaction with the electrode surface, such as electrostatic adsorption, chemisorption bonding, electrons polarization and hydrophobic/hydrophilic reactions 10.
In general, commercial additives composition is extremely complex and unknown by users, which means significant economic losses for small and medium-sized industries that perform these processes. Moreover, the impossibility of reutilization, along with the problem of final disposition, impose an environmental cost. Concerning this issue, simpler mixtures have been proposed in the literature, with different results, but without establishing a monitoring mechanism that enables reusing baths 5,7,8,10-12.
Specifically, Triton X-100 is a nonionic surfactant (octylphenolpoly(ethyleneglycolether)n, n = 10)), of which action has previously been investigated in the ED of Zn. Research revealed that Zn ED with Triton X-100 occurs at higher equilibrium than the estimated one. In addition, thermodynamic E and deposition in the overpotential region are C-dependent, although they produce only a minor effect on ED of Zn at underpotential. 8,10,12 have reported that Triton X-100 effectively inhibits Zn dendrites growth in acidic solutions, at pH 4.40. Besides, C7H6O2 was reported to be adsorbed onto the Fe surface, and affect deposition at low E 11.
It is important to note that, when used alone, certain additives do not produce good enough deposits, but offer remarkably decent leveling or brightening action in synergetic blends with other substances 13,14.
Zn reduction process is usually studied using LSV. This technique allows the assessment of reductions in I, as well as the cathodic polarization effect on baths with different additives compositions 5. More recently, EIS has also been applied to study EP process with Zn, which allowed for the deposit formation different stages being related to the elements of an equivalent electrical circuit 3,15.
In the present study, a platform/set of electrochemical techniques was employed to study the presence of additives at the different stages of the EP process. Based on the above, Ct effect of Triton X-100 + C7H6O2 on j, deposition E and final morphologies of steel coatings by EP with Zn, was evaluated. Initially, the behavior of a mixture of commercial additives of known efficiency was analyzed, to determine the electrochemical parameters required to evaluate the proposed bath. Zn deposits morphologies were examined by SEM, to establish a correlation with the effect of the additives, analyzed by LSV and EIS, on their electrochemical behavior. Herein, the focus was on better understanding the process and defining the monitoring variables that allowed the solutions reconditioning.
Materials and methods
Reagents
H3BO3 (CAS 10043-35-3, Anedra), ZnCl₂ (CAS 7646-85-7, Biopack), KCl (CAS 7447-40-7, Biopack), KNO3 (CAS 7757-79-1, Anedra), Triton X-100 (CAS 9002-93-1, Carlo Erba) and C7H6O2 (CAS 65-85-0, Biopack) analytical grade reagents were used without further purification. All solutions were prepared with deionized water (resistivity>18 MΩ/cm-1) provided by Millipore Simplicity equipment.
The industrial EP baths with Zn were prepared by the industrial specification for the two commercial additives (brightener and leveler) that were provided by a local company. The industrial EP bath composition with Zn is presented in Table 1.
Table 1: Industrial EP bath composition with Zn containing the additives Ct specified by the manufacturer.
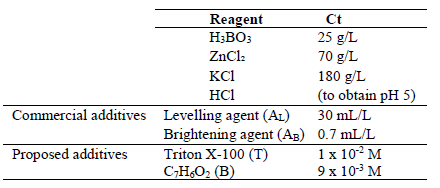
First, baths with different Ct of the two commercial additives were studied, to understand the role of each one, and the synergetic effect of the mix. Then, the same study was performed with Triton X-100 and C7H6O2, in various Ct. The optimal Ct presented a similar deposit appearance by SEM and a similar electrochemical behavior to that of commercial additives. These baths were labeled using the abbreviations for each additive, followed by relative Ct, which are shown in Table 1. For example, the bath without C7H6O2 and with 1 x 10⁻³ M Triton X-100 (0 and 50% Ct, respectively) was named B0-T50. The bath without additives was labeled B0-T0.
Experimental methodology
LSV and EIS measurements
Electrochemical measurements were carried out by a GAMRY potentiostat (Gamry, PCI4G300-51018), provided with software, for data acquisition. The electrochemical cell was a conventional three-electrode system, in which saturated Ag/AgCl was used as RE, and a steel plate as CE. A steel wire in isolating epoxy resin, which was polished to obtain a section of 1 mm diameter as exposed active surface area, was used as WE. The bath electrochemical behavior was studied by LSV, at OCP, from +5 mV to -1.6 V, at a SR of 10 mV/s. The steel surface was polished between measurements, with waterproof sandpaper (silicon carbide 1500, T402), and enlarged by deionized water (resistivity >18 MΩ cm-1).
Using the same described setup, EIS measurements were performed in the frequency range from 50 KHz to 0.1 Hz, at OCP vs. Ag/AgCl, with an E amplitude of 10 mV, at the different stages identified by LSV. Data were plotted as Nyquist plots, and fitted to obtain the electrical parameters, using EchemAnalyst™ Software.
SEM analysis
Zn deposits morphology, after LSV measurements, were observed by SEM, using a FE-SEM Carl Zeiss NTSSUPRA40, in secondary electron mode, at the Advanced Center for Microscopies (CMA, Universidad de Buenos Aires).
Results and discussion
LSV and SEM analyses of commercial additives
Studying the behavior of the system using commercial additives allowed to determine whether the electrochemical platform proposed in this work was useful for detecting variations in the additives Ct.
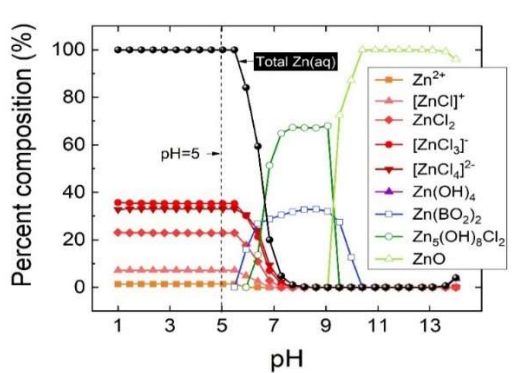
The data processed by MINEQ-L software showed that the best working pH was 5.
At lower pH values, and with more Cl- (Table 1), (ZnClx )(2-x) aqueous complexes were the predominant species, leaving less than 2% free Zn2+. At higher pH values, precipitated species started to appear, mainly at pH 7. At pH from 7 to 9, Zn(BO2)2 and Zn5(OH)8Cl were around 30 and 70%, respectively. Above pH 9, the unique dissolved species was aqueous ZnO (Fig. 1).
Industrial protocols recommend working at pH 5, with which chlorinated Zn complexes deposition is assumed to be more efficient. The organic additives Ct was insufficient to modify Cl- complexes pH or content.
Voltammetric measurements have been used as an exploratory technique to assess the effect of both commercial and proposed additives on the ED mechanism of Zn. Moreover, the blocking effect, due to Zn additives adsorption on the steel surface, is estimated from I values measured in the presence and absence of the organic molecules 8,16. Herein, LSV measurements were performed to identify the different stages in ED processes, labeled C1, C2 and C3 (underpotential, nucleation and massive deposition zones, respectively). Additionally, Triton X-100 and C7H6O2 (Table 1) ratio that best followed commercial additives behavior was selected. This selection was based on the proposed additives behavior that was obtained by SEM, which was like that of commercial ones (data not shown), at the three stages.
Measurements were initiated at OCP in each solution. E depended on electrode materials, solutions compositions, pH and temperatures, corresponding to the several conjugated electrochemical processes that could occur at the interface. Under certain conditions, a metal immersed in an electrolyte solution undergoes a spontaneous dissolution, which is driven by the free hydration energy of the metal ions thus generated. This process involves charge movement, which creates I. At equilibrium, Ia and Ic are equal. So, there is no net I flow 2,17.
Commercial additives came as two separate solutions: leveler and brightener. The leveler employed volume was around 100 times that of the brightener. In previous work, extraction with ethyl ether, followed by GC-MS analysis, determined the additives main components (> 5%): C7H6O2, chlorobenzaldehyde and 4-phenyl-3-buten-2-one for the leveler; and chlorobenzaldehyde, 4-phenyl-3-buten-2-one, 2-(2-butoxyethoxy)-ethanol and 1-(1-naphthalenyl)-ethanona for the brightener 18.
In Fig. 2 a), LSV analysis of the leveler shows an important effect on I reduction, at E -0.84 V, even at 25% of the optimal Ct recommended by the manufacturer.
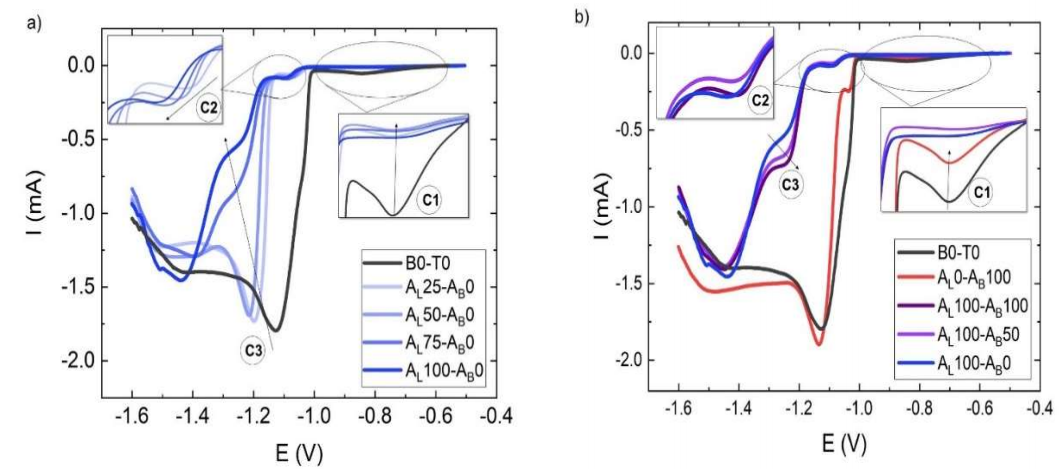
Figure 2 LSV of commercial additives bath: a) without brightener (AB) and with varying leveler (AL) Ct (25, 50, 75 and 100% from the optimal Ct dictated by the manufacturer (30 mL/L)); b) without leveler and with brightener at the optimal Ct dictated by the manufacturer (0.7 μL/L), and with optimal leveler Ct and varying brightener Ct (25, 50, 75 and 100% from the optimal Ct dictated by the manufacturer).
Zone C1 corresponds to E underdeposition of Zn. In this zone, thermodynamically favorable HER that decreased ED efficiency was reported 4,12,14. The peak shape results from these two competing reactions: as E increases, more Zn can be reduced and, therefore, a vaster surface is covered, which reduces H generation. The reduction in I was observed even for AL25-AB0. When more leveler was added, the effect on I was greater, and there was a visible loss in peak shape. HER suppression by the additives covering the electrode surface could be responsible for this behavior.
At more negative E, in C2 zone, around -1.1 V, a drastic reduction on I was observed. At this E, Zn nucleation occurred, due to the superficial diffusion of Zn atoms towards lower energy sites. This phenomenon should not in any way be confused with the processes of ions diffusion in solutions. The growth process begins after the nuclei have reached a critical size 2. When additives are adsorbed onto the electrode surface Zn ions diffusion is partially impaired, thus causing 10-fold decrease in Ic. In our results, a negative shift in E, of -1.04 V for B0-T0, and of -1.1 V for AL100-AB0, was observed, suggesting that the additive effect cannot only be explained by impeded diffusion. The rise in E* a , which is required for Zn ions reduction, increases the nucleation rate, lowers the growth rate and refines the grain size of the deposit (3). The reduction in E, in C2, could also be used to monitor the leveler Ct, to assess the bath composition (Fig. 3).
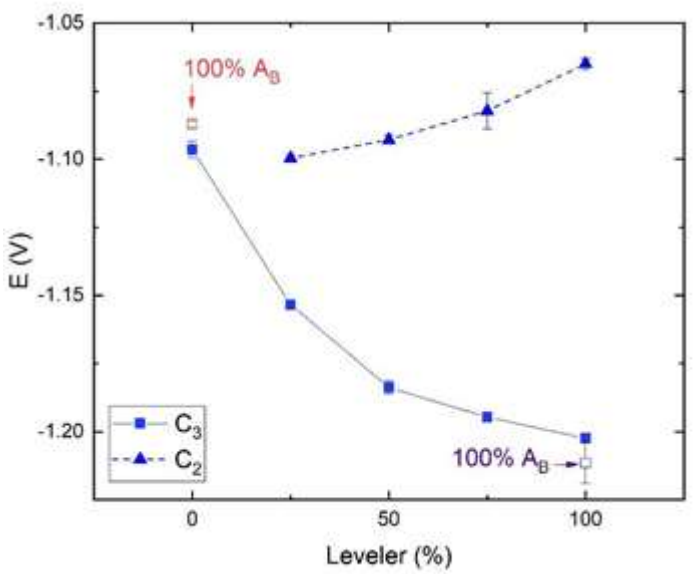
Figure 3 C2 and C3 E vs. commercial leveler percentage C2 (triangles) and C3 (squares) stages with 0% commercial brightener, except for the points in red and purple (data from Fig. 2a)). Each data point is the mean of three independent measurements. C2 and C3 E was determined as the maximum in the first derivative of the curves obtained by LSV.
In the same way, the C3 zone, with a more negative E, showed a stronger negative shift for the leveler Ct of 75 and 100%. This could also be used as an indicator of the leveler contents in the bath, such as the effect reported by 5 (Fig. 3). A significant decrease in I was seen in these two solutions, which was more pronounced for AL100-AB0.
When the brightener was studied without leveler (AL0-AB100), less changes in I and no changes in E were detected (red curve), than in the bath without additives, as shown in the black curve (B0-T0) (Fig. 2 b).
The brightener reduced I in C1, but to a lesser extent than the leveler. A decrease in I was generated in C2, while no such effect was detected on C3. When both additives were used, the leveler effect prevailed, and only a slight increase in I was seen at C3, with higher brightener Ct. The changes observed in C3 seemed to accompany the increase in the brightener Ct (Fig. 4).
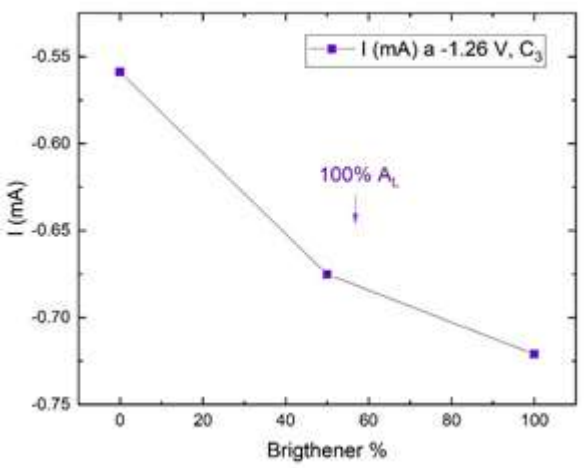
Figure 4: I vs. commercial brightener percentage at -1.26 V (C3 stage) with 100% commercial leveler (data from Fig. 2b)). Each data point is the mean of three independent measurements.
The brightener effect was weaker than that of the leveler, which is also shown by the SEM at C3 stage (Fig. 5).
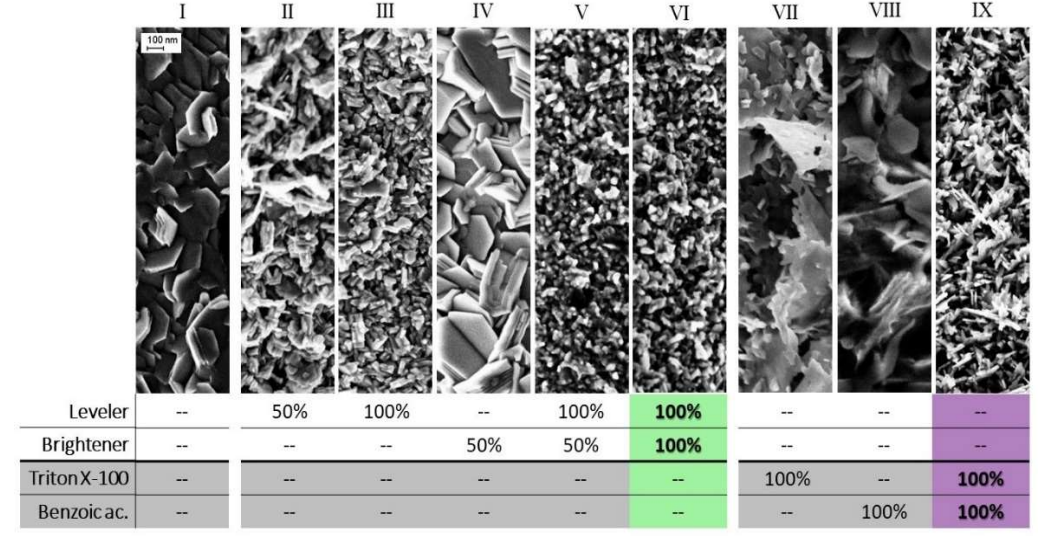
Figure 5: SEM of the deposits obtained after LSV from OCP to C3 region (Fig. 3), with different baths compositions for both commercial additives (II-VI), and the proposed ones (VII-IX). The composition of these baths is described in Table 1.
Columnar structures are typical of deposits from ion acidic solutions without additives. Such deposits usually exhibit lower strength and hardness than those from other structures, although their ductility remains high 1. This happened with B0-T0 (I), but also with AL0-AB50 (IV). Fine-grain deposits result from conditions favorable to crystal nuclei formation, such as an enhanced cathode polarization 1, which was the leveler case. AL50-AB0 (II) displays a clear reduction in crystal size, which became more important as the leveler Ct increased (AL100-AB0: III). This behavior was in line with the polarization effect observed by LSV, at increasing Ct of AL. The comparison between surface morphologies obtained for the same type of solutions with brightener (AL50-AB100: V and AL100-AB100: VI) revealed crystal edges smoothing. However, no differences in shape were detected between the two Ct of AB.
LSV and SEM analysis of Triton X-100 and C 7 H 6 O 2 bath
Surfactants are widely employed as additives in EP baths. Hydrophilic groups are attracted to the aqueous phase, while the hydrophobic end is weakly adsorbed onto the steel surface. The degree of ordering at the interface causes a reduction in tension, thus enabling the release of gas bubbles that may otherwise adhere to the electrode surface, causing pitting or deposit porosity 2. Moreover, the substrate coverage by the surfactant molecules causes the reduction shift in E to more negative values, along with the decrease in Ic8. Surfactants play yet another important role, allowing the solubility of organic compounds, such as aromatic carbonyls, which are incorporated into the bath as brighteners, to improve Zn deposits grains fineness. Such compounds preferentially adsorb onto the deposited tips with a localized high j, and block Zn ions electrons transfer, therefore reducing j at tips, which allows for a smoother deposit 4,9.
An extensive body of research work uses a broad variety of techniques to describe the effect of different surfactants and organic molecules. According to 5,10, a decrease in I occurs in the zone of massive deposition (C3, in the present work), for LSV. Also, a shift to more negative E, for Zn2+ reduction, takes place when CTAB, Triton X-100 10 or different commercial additives 5 are present. Furthermore, CA and AFM revealed a change from instant to progressive nucleation, due to the surfactant simultaneous adsorption, which inhibited nucleation sites, although no meaningful effects were observed in C1 11. When C7H6O2 effect was investigated by EQCM and in situ STM, surface adsorption was only observed at low E in C1. Similar findings were reported by 14. C7H6O2 only controlled - and to little extent - Zn reduction process in the underpotential deposition region, but hardly affected Zn ion transport, considering it did not alter j. 3 reported that CTAB caused a refinement of grains size, also producing a smoothening effect, when used with C7H6O2. In this case, CTAB also favored Benzoic acid dissolution.
As previously seen in here, commercial additives composition is highly complex, which makes it difficult to adjust the bath composition by adding components that are consumed during the process. This does not merely generate economical loss, but also significant waste bulk with complex and unknown composition. With the aim of alleviating this issue, and considering previous work performed on the topic, a very simple mixture of Triton X-100 and C7H6O2 was proposed in this study, at the optimal Ct of 1 x 10⁻² M Triton X-100 and 9 x 10⁻³ M C7H6O2. LSV and SEM matched those obtained using the mixture of commercial additives. Thereafter, it was evaluated whether lower than optimal Ct of these additives could also be detected by electrochemical techniques. Triton X-100 effect examined by LSV is shown in Fig. 6a.
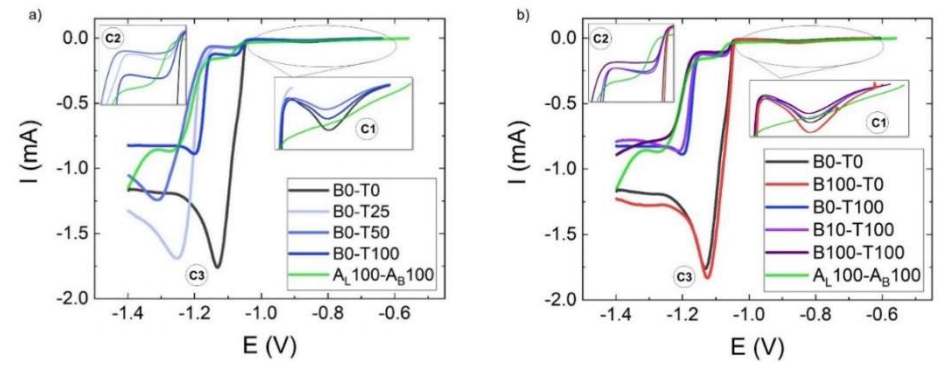
Figure 6: LSV results for the simulated bath with commercial additives and: a) without C7H6O2 and varying Triton X-100 Ct (0, 25, 50, 75 and 100% 1 x 10⁻² M); b) without Triton X-100 and with 9 x 10⁻³ M C7H6O2 (100 %) and with 1 x 10⁻² M Triton X-100 (100%) + varying C7H6O2 Ct (0, 10 and 100% of 9 x 10⁻³ M).
The strong decrease in I at C2, even with 2.5 x 10⁻³ M (B0-T25), agrees with the progressive nucleation reported by 8. However, the massive deposition at C3 was unrestricted at this Ct, and I was as high as in B0-T0. At 5 x 10⁻³ M, i.e., 50% optimal Ct (B0-T50), the same effect occurred in C2. However, a shift in C3 to more negative E, and a lower I than that in the bath without additives was also evident. At 1 x 10⁻² M (B0-T100), the bath behaved in a more similar way to that containing commercial additives (I in C3 ˂ 1 mA). However, E was less negative than that of AL100-AB100 (-1.45 V). 1 x 10⁻² M Triton X-100 was the optimum determined Ct. I in C3 was a simple way to monitor the surfactant Ct (Fig. 8).
Two Ct of C7H6O2 were tested in combination with the previously selected optimal Triton X-100 Ct, to facilitate dissolution: 9 x 10⁻⁴ M (B10-T100) and 9 x 10⁻³ M (B100-T100). As seen in Fig. 6b), the first one displayed a similar response to B0-T0, with higher Ic at C1. A comparable behavior was observed for the highest Ct of C7H6O2, with even lower I at C1. Furthermore, a decrease in I at C2 was followed by a shift in C3 E to -1.25 V (Fig. 7), such as in the optimal commercial additives mixture (AL100-AB100).
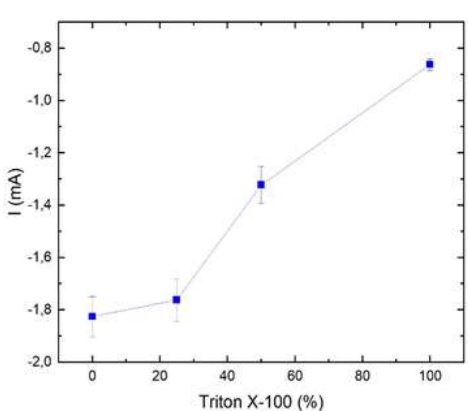
Figure 7: C3 I peak vs 100% Triton X-100 with 0% C7H6O2. (Data from Fig. 5a)). Each data point is the mean of three independent measurements.
As expected, 9 x 10⁻³ M C7H6O2 (B100-T0) alone did not alter the voltammogram shape beyond C1, where I increased. Benzoic acid addition helped the surfactant to achieve optimal E at the massive deposition zone. This behavior may be a measure of its functional Ct in the bath (Fig. 8). In this study, 1 x10⁻² M Triton X-100 with 9 x 10⁻³ M C7H6O2 was considered the optimal Ct, as it achieved a similar behavior to that of commercial additives. It is remarkable that this solution shows an intermediate behavior to that of the two separate additives.
This synergetic effect accomplished with the mixture was also evident in the final morphology observed by SEM (Fig. 5). Triton X-100 alone (B0-T100: VII) caused the steel surfaces morphology to look like thin leaves, with a perpendicular orientation, and remarkably different from the hexagonal plates seen in the surfaces without additives (B0-T0: I). Meanwhile, C7H6O2 alone (B100-T0: VIII), which produced a minor effect on the polarization curves, and only in the underpotential deposition zone, also produced a very different steel morphology than that of the bath without additives. This accounts for the ED process complexity, where minimal changes in the solution composition could considerably affect the deposit final morphology. The combination of these two molecules (B100-T100: IX) gave rise to a deposit with finer grains, like those generated by the commercial additives (AL100-AB100: VI).
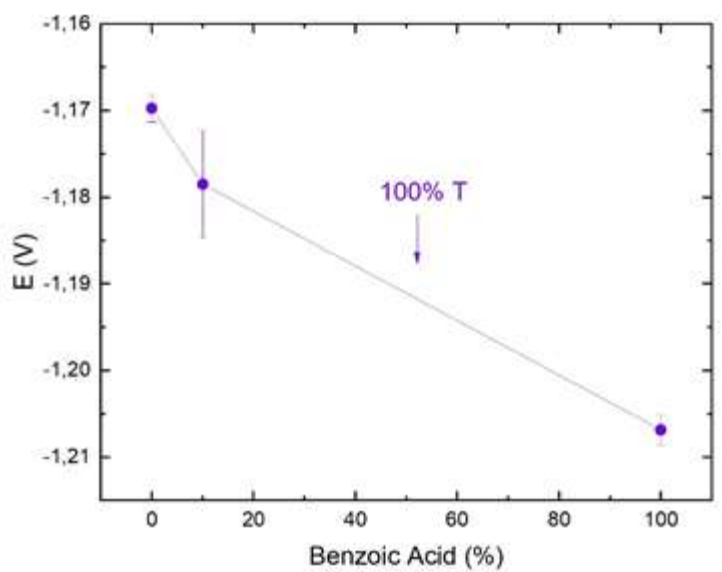
Figure 8: C3 E vs. C7H6O2 various percentages + 100% Triton X-100. (Data from Fig. 5b)). Peak E was determined as the maximum in the first derivative of the curves obtained by LSV. Each data point is the mean of three independent measurements.
EIS study of the synergetic effect of the mixture of Triton X-100 and C 7 H 6 O 2
EIS is a powerful technique that probes the impedance properties of a cell by means of a small amplitude AC signal. In this way, the AC signal is scanned over a wide range of frequencies, to obtain an impedance spectrum for the electrochemical cell under test. EIS enables the study of changes in the electrode surface related to the capacitive process and in resistance linked to charge transfer, as well as diffusion processes that occur in the electrochemical cell. EIS advantage lies in being a non-destructive technique with the ability to differentiate dielectric and electric properties of the sample individual components 19. EIS experiments were performed at OCP of the deposits obtained at the end of the different stages studied by LSV (zones C1, C2 and C3) vs. Ag/AgCl, using a frequency range from 50 kHz to 0.1 Hz. Voltage amplitude was 10 mV. In other words, in independent experiments, ED was carried out by LSV, in each bath, from OCP to the peak E of each zone. For this deposit, OCP was immediately determined in the same cell. Then, EIS was carried out, and data were represented as Nyquist plots (Fig. 9).
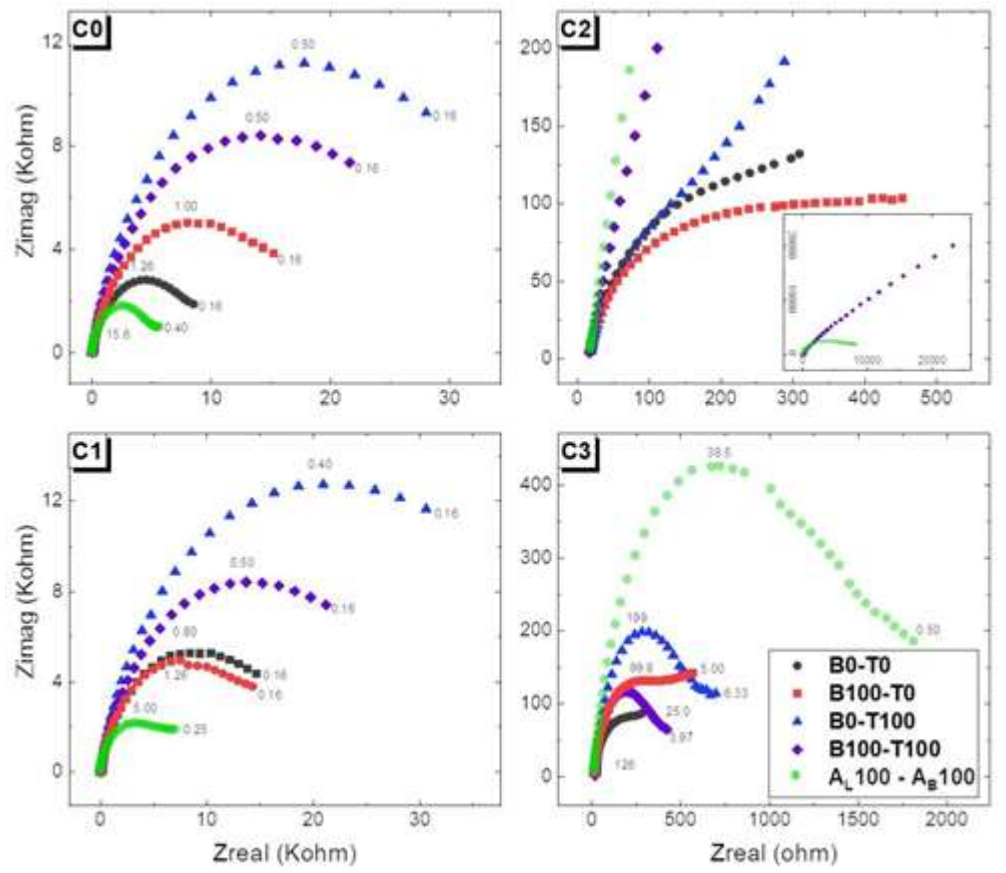
Figure 9: Nyquist plots for EIS data at four different stages of LSV experiments: C0, C1, C2 and C3, for different baths compositions, without additives (B0-T0), with C7H6O2 + Triton X-100, and with commercial additives.
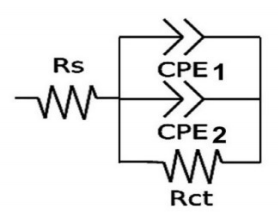
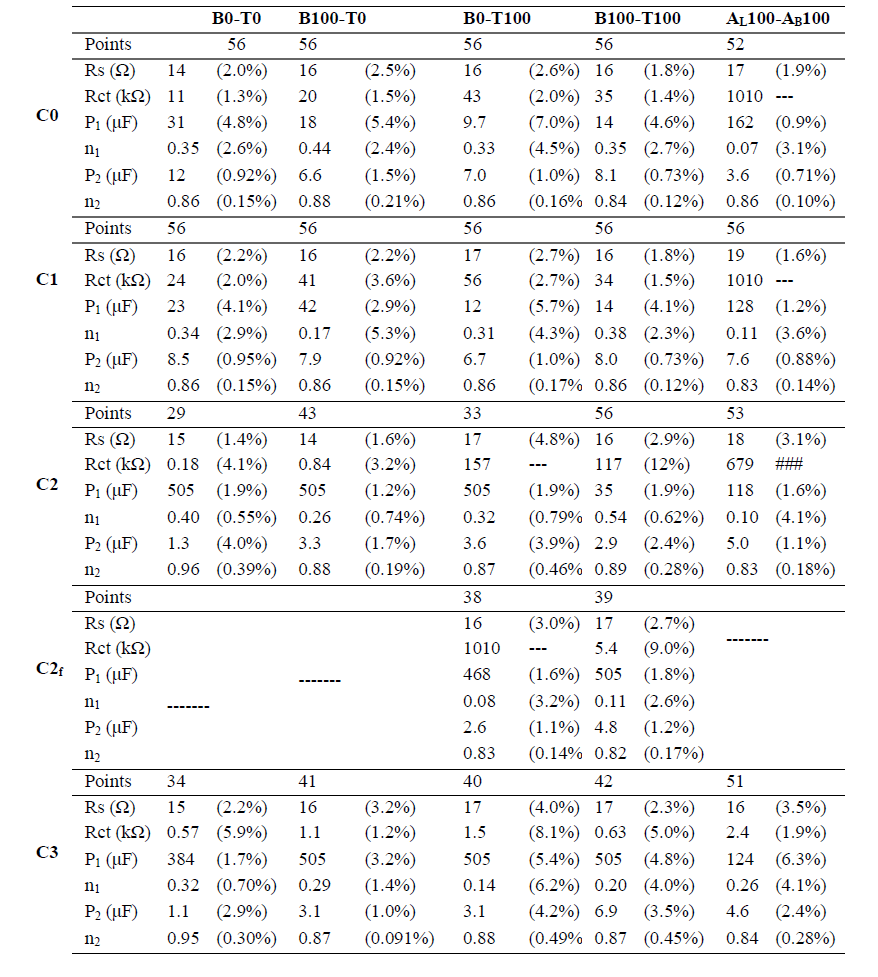
Electrical parameters were determined by fitting EIS data from 50 KHz to the value plotted in Fig. 10, from at least three independent experiments to an EC that included the following elements: Rs, in series with three branches in parallel, one which corresponds to the electron Rct, and the others to CPE1 and CPE2, representing Cdl non-ideal behavior, in different areas of the electrode surface (Fig. 10 and Table 2).
Fitting was performed using Echem Analyst™ Software. Rs between WE and RE presented similar values for all experiments, indicating high reproducibility in the generation of the electrochemical system setup. Rct is a manifestation of two effects: potential energy related to the oxidation event at the electrode; and the redox species barrier that reached the electrode, due to electrostatic repulsion or steric hindrance.
Table 2 Electrical parameters determined by fitting EIS data (from 50 KHz to the value plotted in Fig. 6), from at least three independent experiments, to the proposed EC.
A CPE that simulates the capacitor non-ideal behavior can be modeled as a series through the combination of surface modification capacitance and Cdl. CPE impedance only has an imaginary component:
where Q0 is a constant, ω is frequency and n is surface roughness. A value of n from 0.5 to 1, associated with CPE, indicates a rough electrode 20-22.
All experiments were carried out at the correspondent OCP, amplitude of 10 mV and in the frequency range from 50 kHz to 0.1 Hz. The fitting was performed until the frequency data were plotted in the graphs, in order to use only one EC that would fit all spectra and allow for the comparison between them.
EIS experiments were carried out for different bath compositions: without additives; with 9 x 10⁻³ M C7H6O2; with 1 x 10⁻² M Triton X-100; with both (B100-T100); and with commercial additives. They were performed for different stages of the deposit formation: C0 (no deposition, initial state); C1 (deposition at underpotential); C2 (nucleation); and C3 (massive deposition). All the experiments were performed at OCP of the correspondent surface stage. In order to compare the different EP baths at LSV four stages, the lower frequency data points (where the mass transport control was involved) were sacrificed, so that all the data sets could be fitted within the same EC. Nyquist plots of EIS experiments for the remaining data points are shown in Fig. 9, indicating the last frequency considered in the fitting.
In general terms, at C0 and C1, the five baths showed similar spectra with a wide capacitive/resistive semicircle that remained open. No diffusion impedance was identified in the studied frequency range. However, the frequency range that could be described by the proposed circuit for the commercial additive was a little more limited.
The change in behavior at C2, where the nuclei were already formed, is also worth mentioning. At C2, all baths presented strikingly different behaviors, particularly, commercial baths and B100-T100. This was expected, considering that nucleation is strongly conditioned by Ct and additives type, as well as by the modification undergone by the surface in previous stages of the process. Despite this, the entire frequency range could be fitted within the EC.
At C3, the semicircles were smaller and almost closed, in accordance with a fairly covered surface, in which Rct was facilitated. Nevertheless, the semicircle shape alteration in the mixtures without Triton X-100 was less evident. Additionally, at C3, the range of frequencies that could be described by the proposed circuit was more extended for the commercial additive than for C7H6O2 and Triton X-100 mixtures, which indicates that the mass transport effect was less important at this stage. It is worth mentioning that EIS revealed differences between commercial and proposed baths that were not present in LSV, which shows the importance of the former for the study of ED processes. The evolution of each of the EC elements for the different ED stages in each of the solutions is discussed below.
Fig. 11 presents the changes in these three circuit elements throughout deposit formation. The existence of two different capacitive elements (CPE1 and CPE2), in parallel to the opposite behavior that fit EIS, can be interpreted in terms of two different zones on the electrode surface. CPE1 was two orders of magnitude higher than CPE2, and while the former increased with Zn nuclei formation and growth, the latter showed the opposite behavior. CPE2 would correspond to Cdl over the bare electrode surface, and CPE1 to that over the surface covered with Zn. This hypothesis can be assumed, since there was relatively little variation in CPE2 value among the different solutions, and even throughout the ED process. Its decrease could be related to a reduction in the original area of the treated surface while Zn deposit was formed. The n value from 0.8 to 1 emphasizes the notion that CPE2 could be related to the electrode initial sanded surface. CPE1 increased considerably during the nucleation stage, except for the mix of commercial additives, which, at the beginning of the process, showed greater, though almost constant, values. The smaller the n parameter, the larger the deviation from the ideal capacitor. In CPE1 case, the value was very low and, despite some fluctuation, remained below 0.6. CPE1 also evidenced the synergetic effect of the C7H6O2 and Triton X-100 mixture, which behaved very differently from each separate compound at the C3 stage. In spite of these differences, it is remarkable that CPE1 and CPE2 n values obtained for the proposed mixture of additives were of the same order as those of the commercial blend.
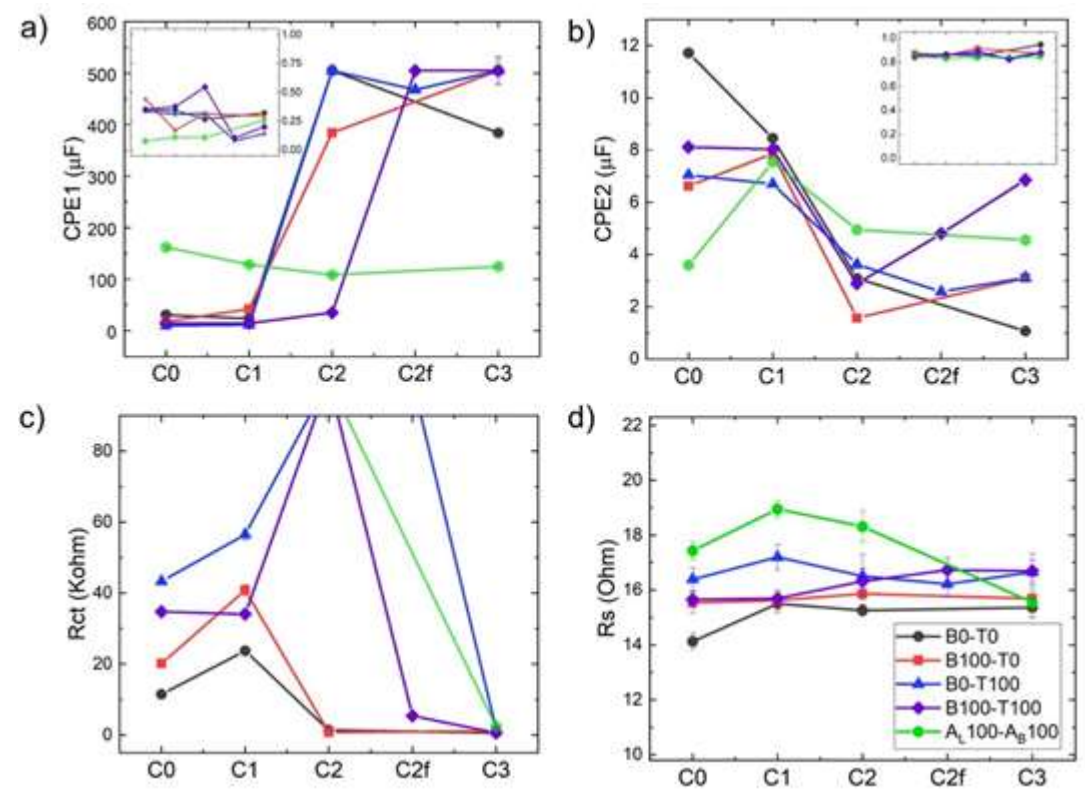
Figure 11 Circuit elements from three independent experiments throughout the deposit formation at C0, C1, C2, C2f (at the end of zone C2) and C3: a) CPE1 and n1 (inset); b) CPE2 and n2 (inset); c) Rct; and d) Rs.
Regarding Rct, this element can be associated to the charge transfer of the reduction in Zn. It is important to note that high Rct, as it was the commercial additive case, hindered the faradaic reaction in all stages prior to C3. Rct increased from C0 to C1, in all cases, but for the optimized mix, which had a constant value. This may be due to a simultaneous reaction, such as HER. The higher values observed for CPE1 in the commercial mixture could also be ascribed to this reaction. According to our findings, 100% Triton X-100 ensured that the nucleation process was limited by a high Rct (19). Although it was not enough to match commercial reagents, 100% Triton X-100 kept Rct high at C0 and C1. With the optimal proposed Ct (B100-T100), C7H6O2 caused Rct to decrease at the end of the nucleation stage (C2f), which seemed to improve the deposit final form (see Fig. 5). Changes in Rct contributed to explain the increase in I that was observed throughout the process (LSV of Fig. 6b). Rs presented values in the 16±2 ohm range, which shows the good reproducibility achieved in the setup assembly (Fig. 6d and Table 2).
As in (14), C7H6O2 did not seem to act independently, but to closely interact with Triton X-100. The behavior exhibited by the additives mixture was intermediate between that of each of the individual compounds. The variation in the surface capacity, due to ED (CPE1) between C2 and C3 zones, turned out to be the parameter most altered by the synergism between the two additives.
Conclusion
In the present work, a combination of tools was employed to study the additives composition in EP baths. In this way, a new combination of additives, Triton X-100 and C7H6O2, was introduced, electrochemically establishing the Ct that matched the commercial additives performance. These model systems were assessed by classical electrochemical techniques, such as LSV and EIS, which allowed to compare their scope in the study of the additives effect on ED. The characteristic initial stages (C0), deposition to underpotential (C1), nucleation (C2) and massive deposition (C3) were analyzed by LSV and EIS.
LSV proved to be an efficient technique to evaluate the additives Ct in EP baths, being potentially useful to plan their reconditioning and reuse.
In particular, EIS results were related to the elements of an EC. The differences detected at C0 and C1 for commercial additives were due to the high Rct effect. The capacitive behavior at these stages had the same order of values. When Triton X-100 and C7H6O2 were at the ideal Ct in the mix, 1 x 10⁻² M, and 9 x 10⁻³ M, respectively, C2 and C3 exhibited behaviors analogous to those of commercial mixtures. This analogy refers to the values or trends obtained for EC elements, which also seemed to correspond to the deposits final appearance. The synergetic effect between both compounds was also revealed by this study, which found that CPE related to Zn ED (CPE1) was the one that best proved this effect.
The present study featured electrochemical tools as an alternative to evaluate complex mixtures, including commercial additives and their components. This evaluation ranged from the additives Ct to the synergic effects of new mixtures. The introduction of mixtures with a more rational design has the potential to enhance industrial processes quality. Thus, the treatment or subsequent reuse of solutions is simplified by more environmentally-friendly formulations. LSV showed an easy and fast correlation between the final appearance of the deposit and the E-I ratio of C2 and C3, both related with additives Ct. Furthermore, EIS enabled a thorough study of each of the stages in ED evolution by associating it with an EC. This technique promises to be of great help in the design of new additives mixtures.
Acknowledgements
This work was partially supported by Universidad de Buenos Aires (20020170100341BA), CONICET (Consejo Nacional de Investigaciones Científicas y Técnicas) (11220150100291CO), OPCW (Organisation for the Prohibition of Chemical Weapons) P(L/ICA/ICB/210497/17) and ANPCYT (Agencia Nacional de Promoción de la Investigación, el Desarrollo Tecnológico y la Innovación) (PICT-2015-0801). G. A. González is from CONICET, V. E. Diz is from UBA and C. Costa acknowledges Universidad de Buenos Aires for her doctoral fellowship. The authors acknowledge Dra. María Claudia Marchi from CMA - UBA/CONICET for SEM images.
Author’s contributions
Cecilia Daniela Costa: carried out the experiments. Virginia E. Diz: supervised the project. Graciela Alicia González: wrote the manuscript with the support from the other authors; supervised the project.
Statements and declarations
On behalf of all authors, the corresponding author states that there was no conflict of interest.
List of abbreviations
AC: alternating current
AFM: atomic force microscopy
C7H6O2: benzoic acid
CA: chronoamperometry
Cdl: double layer capacitance
CE: counter electrode
CMC: critical micelle concentration
CPE: constant phase element
Ct: concentration
CTAB: hexadecyltrimethylammonium bromide
E: potential
E* a: activation energy
EC: equivalent circuit
ED: electrodeposition
EIS: electrochemical impedance spectroscopy
EP: electroplating/electroplated
EQCM: electrochemical quartz crystal microbalance
H3BO3: boric acid
HCl: hydrochloric acid
HER: hydrogen evolution reaction
I: current
Ia: anodic current
Ic: cathodic current
j: current potential
KCl: potassium chloride
KNO3: potassium nitrate
LSV: linear sweep voltammetry
OCP: open circuit potential
Rct: charge transfer resistance
RE: reference electrode
Rs: electrolyte resistance
SEM: scanning electron microscopy
SR: scan rate
STM: scanning tunneling microscope
WE: working electrode
ZnCl₂: zinc chloride


