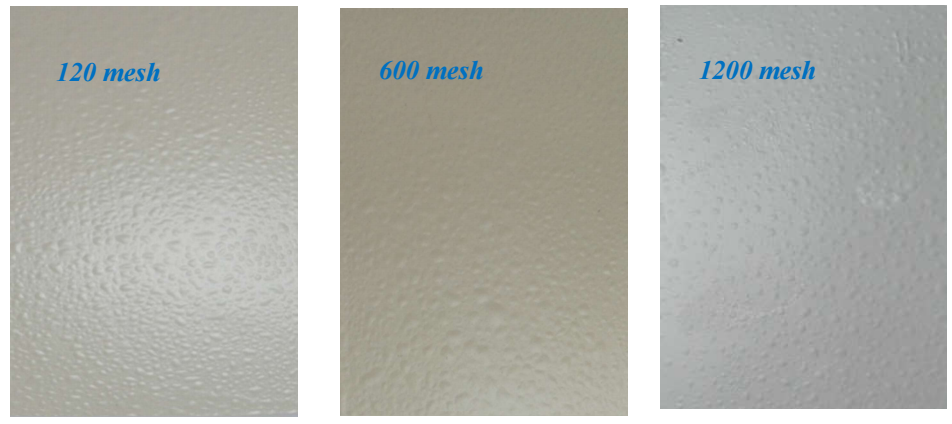
Introduction
Corrosion is an extremely crucial problem that is of concern in many different applications for oil production. Corrosion is mainly caused by the conveyed fluids diversity, the variety of materials used, the equipment ageing and, more particularly, the performance of the coating protection 1,2.
The passive protection of the metal installations against corrosion is ensured by metallic or organic coatings, such as anti-corrosive EC and varnishes. The use of organic coatings is one of the most efficient and economical used methods to protect metals. Organic coatings limit the flow of the aggressive elements by creating a physical barrier. Most coatings are not perfect, and, consequently, the metal contact with the corrosive medium is inevitable. The coating barrier properties are linked to various intrinsic parameters, such as its thickness, polymer matrix, fillers, pigments and additives, solvent, adherence, and chemical composition (metal/coating interface). It is acknowledged that water absorption onto coatings is an important topic 3,4, because it is an initial step in their degradation process.
A painting is a fluid preparation, that can be spread out in thin layers over all kinds of materials (called supports) to form, after drying or reticulation (hardening), a thin coating. In their design, paintings are a particular composite material, since they generally comprise many compounds (resins, solvents, pigments, loads and additives), which confer them specific physico-chemical properties. Solvents are the most common compound used in paintings.
Barrier property of an organic coating, for the corrosion protection of metallic substrates, is a loosely defined concept that encompasses, depending on the authors: low permeability to water and O, even if all polymers usually absorb water to various extents, depending on their chemical composition and IT; prevention of exposure to water and O at the metal/coating interface (wet adhesion); and limitation of electrical icorr, due to high electrical resistivity in the coating 5-11.
A protection system by paintings generally consists of several layers, each of them with a precise purpose. It includes a primary, one layer or several intermediate ones and a top coat. Corrosion resistance of the covered steel structures is strongly influenced by their surface quality. This is why surface preparations of materials, specially polishing operations, are crucial, since they allow to modify their properties. After these treatments, the surface becomes very active 12-15.
The aim of the present work was: to investigate the effect of CS surface roughness on the performance of EC currently used for corrosion protection, by stationary and non stationary Ec methods; and to assess the corrosion behaviour of CS covered by a painting EC, in three surface states, immersed in a 3.5% NaCl solution. Several Ec techniques were used: Ecorr (follow-up of E, according to IT), Tafel method, cathodic delamination test (CA) and EIS. EIS took a large part in this study, as it is widely used for the assessment of organic coatings barrier properties. The impedance response of an organic coating is generally monitored over IT in an electrolytic solution, representative of the operating environment. This monitoring serves to detect the appearance of corrosion signatures in the impedance spectra, hence predicting the coating lifetime. The coating performance is generally evaluated through parameters extracted from equivalent circuits, the physical origin of which is often debatable. The only test that does not belong to the Ec method is salt spray, which was carried to complete the results obtained by the various Ec techniques.
Experimental protocol
Samples and application
EC have been chosen for this study, since they are generally recognized for their higher adherence, good corrosion and unsticking resistance under cathodic polarization, which could explain why they are currently employed by certain gas and oil companies throughout the world 16-20.
The coatings preparation method was performed by selecting Zn₃(PO₄)₂, an anti-corrosive agent, as primary layer. The selected coating was a bi-component system painting: the base was a liquid EC that was homogeneously mixed with the hardener, an appropriate amount of polyamido-amine (versamid type) resin curing agent, with different additives. The samples were prepared at ENAP, Lakhdaria, Algeria.
Table 1 presents the coating formulation composition, and Table 2 shows the principal products incorporated in the anti-corrosive primary formulations.
Table 1: Centesimal formula of the coating.
| Components | wt% |
|---|---|
| EC Loads Additives Mix solvents | 51 30 0.3 18.7 |
Table 2: Principal products incorporated in the primary.
| Composition | wt% |
|---|---|
| EC Anti-corrosive agent (Zn₃(PO₄)₂) Pigments Loads Additives Mix solvents | 30.5 7.5 21 19.5 5.7 15.8 |
The films were deposited on CS electrodes. The painting application was carried out by an air gun with de-oiled air, dehydrated, vacuum-cleaned and compressed with a pressure of 2.5 bar, in an application cabin. The samples were simply degreased with xylene, then polished manually by using abrasive silicon carbide paper, and finally rinsed with acetone.
The films thickness values, obtained after drying (in the air), were measured using a magnetic thickness gauge positector 2000. The painted system was composed by a primary layer and a top coat of 25 + 3 and 25 + 3 µm, respectively.
The covering time between the primary and the top coat was 48 h, to ensure physical and chemical hardening.
The EC were conditioned for, at least one week, at 23+2 °C and 50+10% of relative humidity, before Ec measurements. These conditions were required for the pores opening, since, without them, the coating would act as an insulating physical barrier, hindering the presence of curves in Ec measurements.
EIS
A standard cell with three electrodes was used: WE was a CS coupon, with a surface of 32 cm2; RE was a SC; and AE was Pt. The electrodes were connected to the measuring equipment (EGG Mode l 273A potentiostat/galvanostat, with three entries).
The testing solution was 3.5% NaCl. Impedance measurements were carried out with a response frequency recorder, from 105 Hz to 1 mHz, with 5 points per decade.
Polarization curves
In order to plot the polarization curves, PDP measurement, with a E variation of +250 mV vs. Ecorr, at a SR of 0.166 mV/s, was performed. This test was carried out only once, at the start of the coating steel immersion, on a separate coating.
CA
CA consists in following I evolution vs. time, when the system is subjected to overpressure. Herein, cathodic delamination test was used, which consists in imposing on the electrode a E lower than its Ecorr, and measuring icorr vs. time. This test allows to evaluate the coating performances over time, under cathodic protection.
In order to simulate real conditions, all steel coatings were scratched until the metal surface appeared (coating surface scratch: 2 cm × 2 mm). Imposed E was 1.2 V/Ecorr.
Experimental results
Study of bare metal
Reduction E
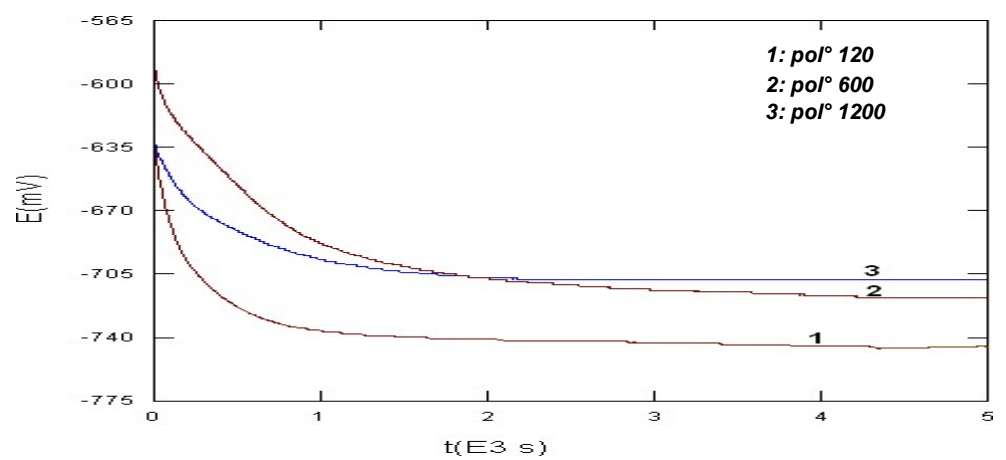
The follow-up curves of the free E during the bare metal corrosion, for three studied Ra values, are presented in Fig. 1. Whatever the considered surface Ra, E decreased, since the immersion start, from a noble value, to a stabilized one located from -700 to -750 mV/SCE. The following values resulted from several tests: 1 (120 mesh) = -746 mV/SCE; 2 (600 mesh) = -719 mV/SCE; 3 (1200 mesh) = -708 mV/SCE.
E became progressively less noble (Fig. 1) at the immersion beginning. There was a continuous attack on CS, and the free E stability shows that the systems that went through the corrosion process had the same kinetics during the samples immersion in NaCl 21.
Polarization curves
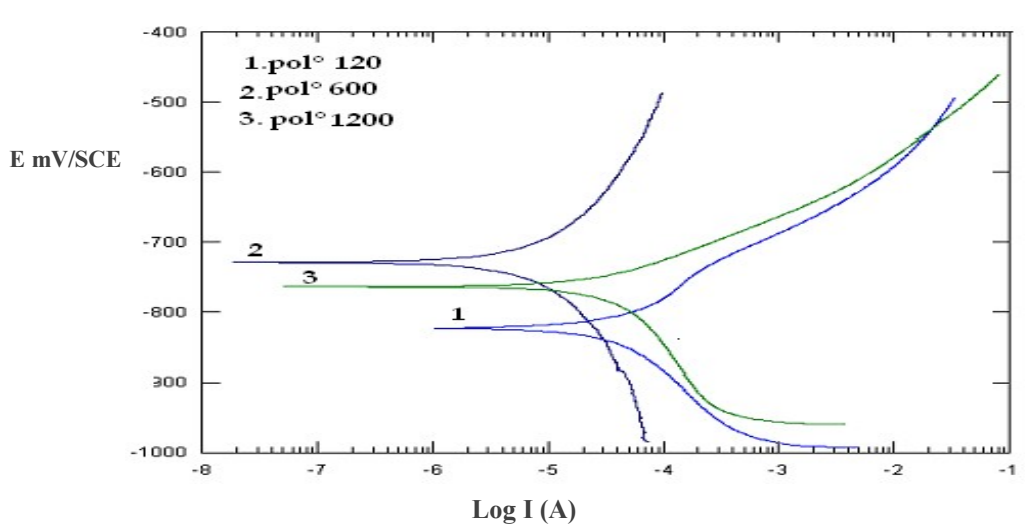
In order to determine Ec parameters for corrosion evolution, PDP plots were performed on the bare CS samples, at various surface states. Polarization curves were obtained by scanning E from +250 mV around free E. E scanning was done from the cathodic to the anodic field, at the SR of 0.166 mV/sec. This type of curve allowed determining Icorr and Ecorr. Fig. 2 represents polarisation curves obtained for the bare CS electrodes, in aerated conditions, for the three surface states. Measurements were done after free E stabilization. Ecorr and j values were obtained by the polarization curves (extrapolation method of Tafel lines). Ec parameters values obtained from these curves are shown in Table 3.
Table 3: Ec parameters values obtained from polarization curves.
| Mesh | Ecorr (mV/SC) | Icorr (µA/cm-2) |
|---|---|---|
| 120 | 823.1 | 37.96 |
| 600 | 728.0 | 25.46 |
| 1200 | 764.2 | 39.54 |
Polarization curves (Fig. 2) show that the surface state influenced E and J. It should be noted that Ecorr shifted in the negative direction of approxim. 58.9 mV/E for the surface polished at 120 mesh vs. CSE, compared to the surface polished at 1200 mesh. J values were larger for the electrodes polished at 120 and 1200 mesh, than for the one polished at 600 mesh.
EIS
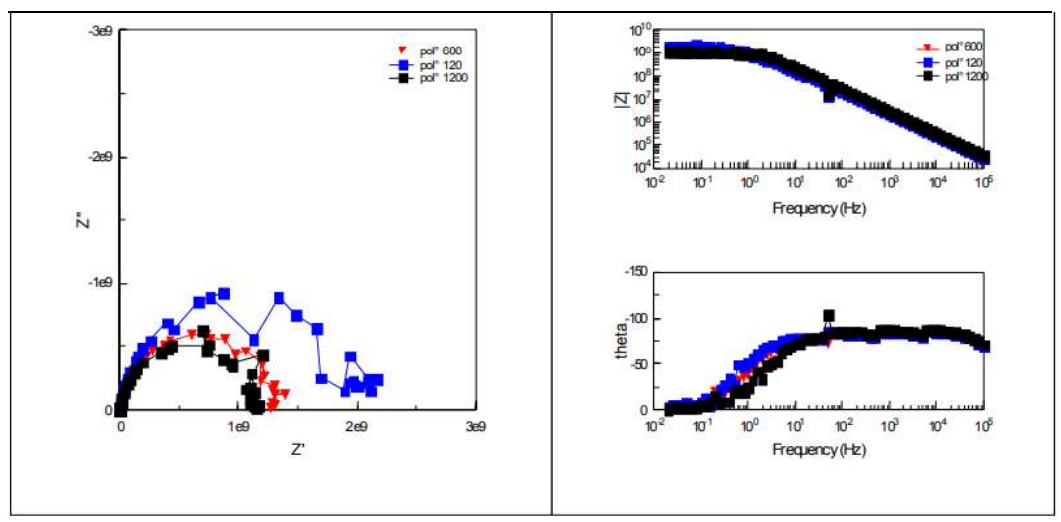
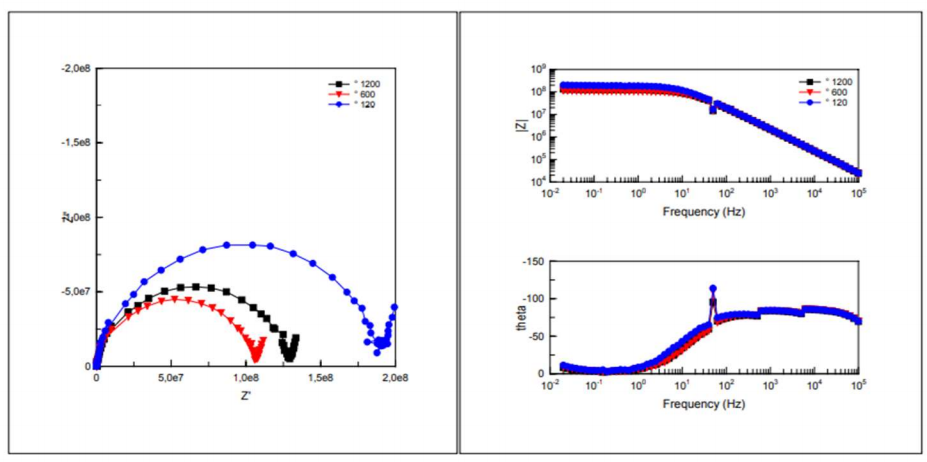
EIS was successfully applied for the study of CS corrosion mechanisms. EIS diagrams, in Nyquist and Bode representation of bare metal, obtained for various studied Ra values, are shown in Fig. 3.
Cres and Crev results obtained from these curves are shown in Table 4. Whatever the surface state, the impedance diagram was composed of a loop in the low frequencies field that reported corrosion phenomena at CS/electrolyte interface.
In Bode plot, impedance diagrams show the presence of only one time constant at low frequencies. Concerning the impedance phase, diagrams loops are similar for the three considered surface states.
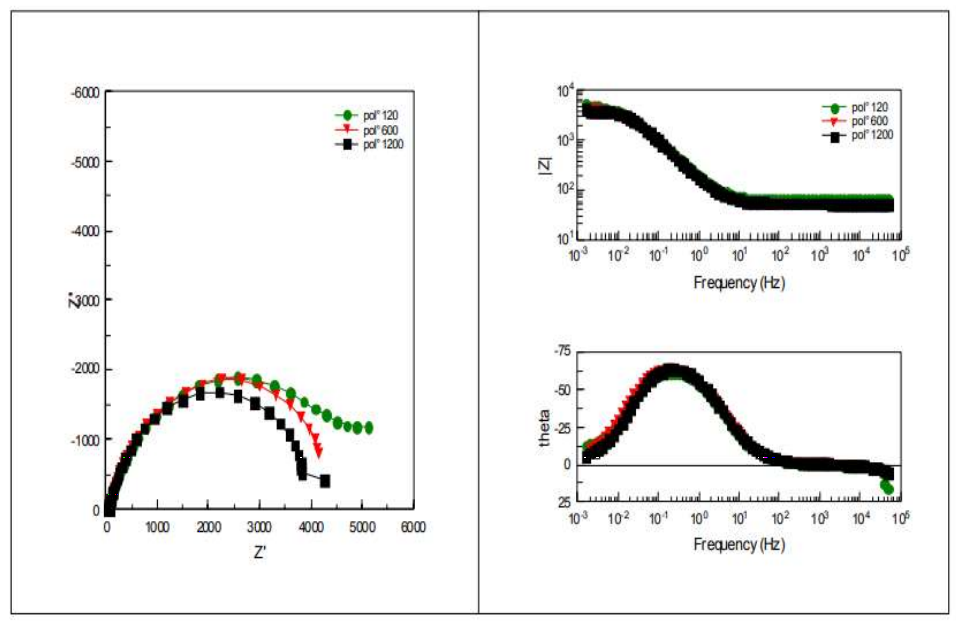
Figure 3: Impedance diagrams in the complex and Bode plan of bare CS in 3.5% NaCl, for the three surface states.
Table 4: Electric parameters of the metal-solution interface obtained during CS immersion in 3.5% NaCl.
| Mesh | Rp (Ω) | Cdl (Farads) |
| 120 | 5148.9 | 194.35 .10-5 |
| 600 | 4590.0 | 222.16 .10-5 |
| 1200 | 3281.2 | 201.79. 10-5 |
Rp values recorded after polishing with abrasive paper of grades 120, 600 and 1200 mesh, respectively (Table 4), show that they increased in the order: Rp (1200 mesh) < Rp (600 mesh) < Rp (120 mesh). One also noted an increase in the capacity with a decrease in Cres value. Rp decreased with increased Crev values. This behaviour was due to the increase in the corroded CS surface.
Study of the coating
E corr
Ecorr curves vs. IT of CS samples, for the studied surface states, are shown in Fig. 4. Ecorr shifted towards the negative direction, after two days IT. Then, it shifted towards the noble direction, and, finally, moved towards the negative direction, until the experiment end, at 91 days. E displacement towards the noble direction indicates that the cathodic/anodic reactions ratio increased, and also that O and water penetrated the coating, reaching the CS/coating interface. E shift towards more negative values indicates that the anodic/cathodic reactions ratio became significant. The increase in Ecorr towards increasingly positive values, over time, indicates that alkaline conditions were locally developed at the CS/coating interface. Ecorr displacement towards increasingly negative values, over time, indicates the formation of corrosion products and the limited coating service life 22,23.
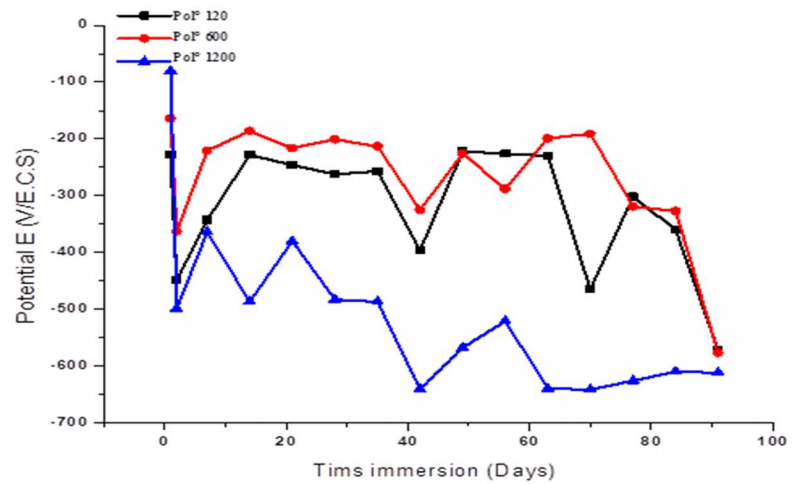
Figure 4: Follow-up of Ecorr during CS immersion in a NaCl 3.5 % medium, at different surface states.
EIS
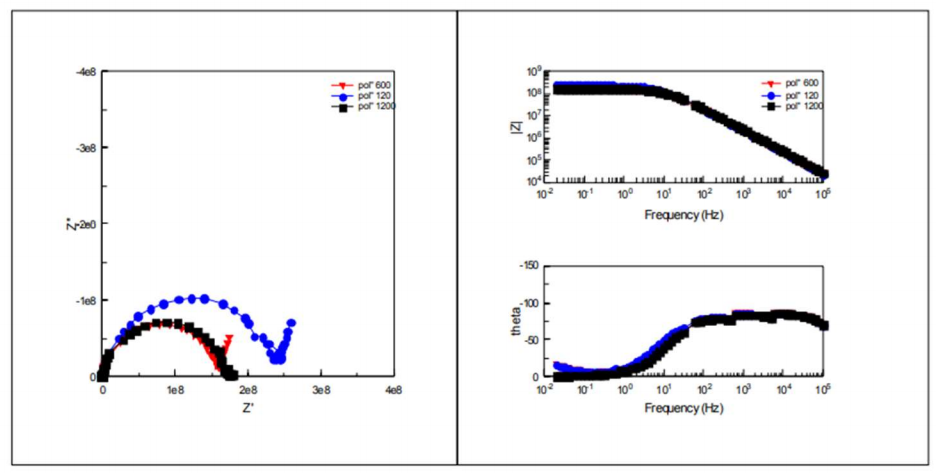
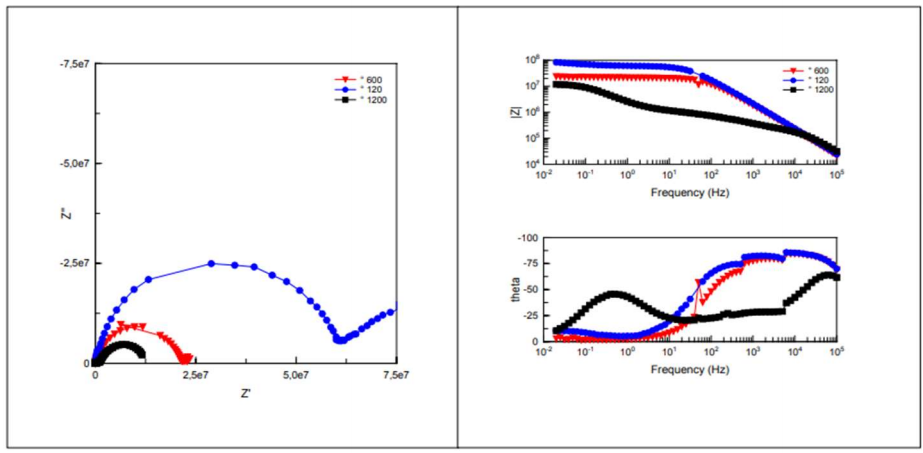
Low frequency impedance modulus (1 MHz) is commonly used to evaluate the overall anticorrosion performance of organic coatings 24-27. Figs. 5, 6, 7 and 8 present the impedance diagrams evolution, during IT of CS in the 3.5 % NaCl solution, for the EC, at different Ra values.
A collapse of the impedance was observed from 2 to 7 days IT for the three Ra values (109 → 108 Ω). Then, for longer IT, the impedance diagrams remained relatively stable, around average values (1.77.108, 1.44.108 and 1.16.108 Ω, for 120, 600 and 1200 mesh, respectively). Thus, the metal/coating system resisted corrosion. At the IT end (86-91 days), impedance had a visible evolution, but it was still significantly lower (107 Ω). Crev value was estimated at C = 10-11 F/cm-2, which is characteristic of an organic coating 28.
Impedance diagrams are characterized by two time-constants: high frequency field, which represents the coating properties, and low frequency field, which is attributed to phenomena occurring at depth in the paint pores.
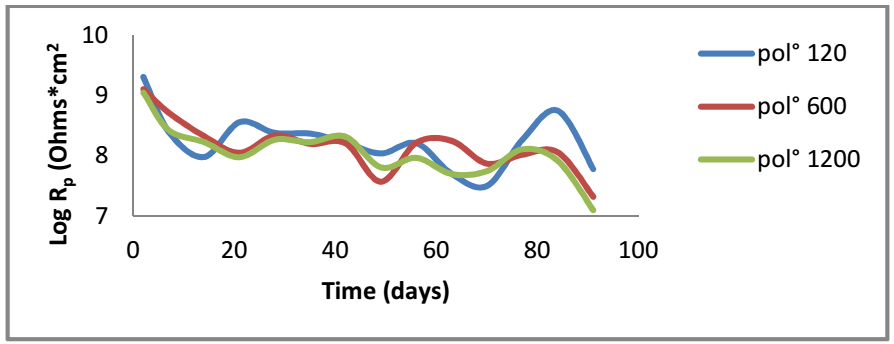
Rp and Crev values were extracted from Ec impedance diagrams, in order to assess changes in the coating properties with IT. Fig. 9 represents evolution of Rp values extracted from the high frequencies loop, which characterizes the EC effect of the three electrodes on the three surface states. The systems Rp and Crev values are shown in Tables 5 and 6, respectively.
Table 5: Rp values vs. IT.
| Mesh | IT (days) | 2 | 7 | 14 | 21 | 28 | 35 | 42 | 49 | 56 | 63 | 70 | 77 | 84 | 91 |
| 120* 120* | Rp 108 (Ω/cm2) | 20.05 | 2.54 | 0.92 | 3.71 | 2.43 | 2.39 | 1.68 | 1.10 | 1.64 | 0.51 | 0.33 | 1.91 | 0.57 | 0.62 |
| 600* | 13.27 | 5.28 | 2.15 | 1.43 | 2.32 | 1.60 | 1.65 | 0.37 | 1.66 | 1.79 | 0.76 | 1.07 | 1.16 | 0.21 | |
| 1200* | 11.41 | 2.70 | 1.70 | 0.97 | 1.88 | 1.71 | 2.12 | 0.65 | 0.94 | 0.49 | 0.57 | 1.30 | 0.83 | 0.13 |
Table 6: Crev values vs. IT.
| Mesh | IT (days) | 2 | 7 | 14 | 21 | 28 | 35 | 42 | 49 | 56 | 63 | 70 | 77 | 84 | 91 |
| 120* 120* | Crev*10-10 (F/cm-1) | 1.12 | 1.09 | 9.90 | 1.09 | 0.95 | 1.01 | 1.09 | 1.02 | 0.92 | 0.84 | 0.95 | 0.92 | 0.83 | 0.87 |
| 600* | 1.04 | 1.18 | 1.20 | 0.97 | 0.94 | 1.00 | 1.06 | 2.10 | 0.99 | 1.08 | 1.09 | 0.95 | 1.14 | 1.23 | |
| 1200* | 1.53 | 1.23 | 0.86 | 1.01 | 0.88 | 0.86 | 0.69 | 3.31 | 1.99 | 0.86 | 0.56 | 0.08 | 0.88 | 1010 |
According to Fig. 9, for the electrodes polished with 120 and 600 mesh, Cres values decreased in the first IT, then stabilized. This shows that, due to the system adhesion, corrosion protection remained rather significant and constant for a relatively long IT. At the experiment end (70-91 days), one noticed a decrease in Cres that was due to the electrolyte penetration in EC pores, which put CS in direct contact with NaCl.
In the case of the electrode polished with 1200 mesh, Cres values decreased with IT and were weaker than those observed for the other electrodes. This evolution was accompanied by an increase in Crev values. Rp and Crev evolution was due to the increase in the corroded MC surface under EC, which led to the formation of an oxides layer.
The increase in Cres during IT can be explained by the following phenomena: corrosion products growth on the material surface (in EC pores) had a barrier effect which slowed down CR; the localised character of corrosion involved a reduction in EC active surface, artificially inducing an increased Rp; and the decreased medium aggressiveness related, e.g., to the increase in pH, involved a deceleration in CR. Whatever the surface state, Rs value in EC pores decreased, due to their enlargement and hydration during IT.
According to this evolution, electrodes polished with 120 and 600 mesh showed a better barrier effect against the electrolyte than the one polished with 1200 mesh.
Crev values (Table 6) remained relatively stable over IT of the three polished electrodes (120, 600 and 1200 mesh). Stable or slightly increased Crev values were due to the solution saturation and accumulation in EC and under it 27.
For longer IT, Crev values of the electrode polished with 1200 mesh tended to increase, which agrees with various researches that employed Ec impedance measurements to study metals coatings degradation. Thus, due to the aggressive medium high polarity, the system dielectric constant and Crev increased, as written in eq. (1).
Absolute permittivity is the medium property that reveals the flux density generated at a given point, due to a certain electric field intensity at another point in that field. The increased ξr constant value involved higher Crev values 29,30. Rp values decreased significantly during the first 7 days IT, due to EC non-destructive delamination. Then, a relative Rp stability occurred for longer IT. Finally, a reduction in Rp happened due to EC detachment.
Test of cathodic delamination
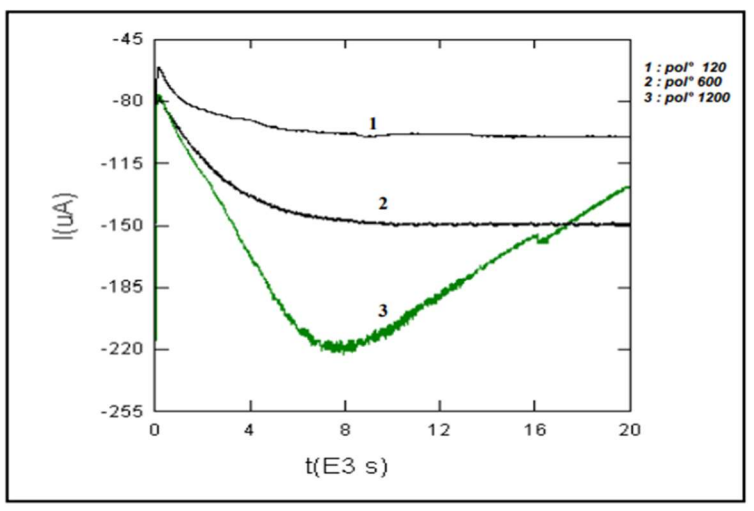
To protect steel structures, such as underground pipelines, cathodic protection is used in conjunction with organic coatings. Organic coatings, on the other hand, deteriorate with time. In addition, combining a cathodic protection with an organic coating causes a high alkalinity at the coating/steel interface, resulting in coating cathodic disbondment. As a result, more electric power is consumed over time, to preserve the steel structure. In the end, E demand may surpass the protection system designed capabilities 29-33. Herein, the protective E imposed on EC tested in different surface states was checked in order to assess its detachment. Fig. 10 shows EC amperometric curves for the three surface states.
The amperometric curve corresponding to EC of the electrode polished with 1200 had lower Cres for CS undercoating cathodic protection, because I increased from -218 to -125 µA. This did not happen with the other electrodes (600 and 120 mesh) of which cathodic I remained practically stable. As such, organic EC are incompatible with E cathodic protection.
It should be noted that EC with various Ra values underwent a cathodic delamination test for an overprotection of approxim. -600 mV/SCE, knowing that Eapplied - Ecorr = -1200 - (- 600) mV/SCE.
It was seen that the tested systems were not degraded, since neither delamination, nor blisters formation occurred around the scratches. This shows that EC systems adhered well on CS. However, the surface polished with 1200 mesh was almost mirror-like. Therefore, the coating detachment was easier.
Salt spray test
A salt spray test was carried out to complete the results obtained by various Ec techniques. This is an accelerated corrosion test generally defined as a method that enables to evaluate coatings performance, and of which results are obtained with shorter IT than those of natural exposure.
In this work, the solution was 7.69% NaCl, and room temperature was 35 ºC. IT was 15 days. The saline solution was periodically added after every 80 h. Blisters formation and CR of the EC metal plates were regularly evaluated by visual observations. Samples photographs were taken after 15 days IT in salt spray. Fig. 11 shows that the primer formulated with EC 1200 mesh had better anti-corrosion performance. The blisters are spaced apart, and their diameter is much smaller than that of the primer formulated by Zn₃(PO₄)₂ with 600 and 120 mesh, of which blisters are more numerous and close together.
Conclusion
A study on the influence of the substrate Ra was carried out by Ec techniques. The objective was to establish a link between the interface morphology (of the surface state) and the coating adhesion. Ruled by the bindings generated between CS and the deposited EC layer, adhesion results from physical and chemical bonds between the former and the latter. Two elements influenced EC adhesion: its microstructure and the interface morphology.
Ecorr variations with IT showed that CR of CS increased with its lower surface Ra (increase in the anodic/cathodic surfaces ratio).
Non-optimized paint application parameters led to porosities and low plastic deformation of EC and CS, i.e. a non-ideal coating microstructure. In this case, the interface rupture was facilitated, and adhesion level was low. The interface morphology was, in turn, ruled by Ra of CS before EC application. EC particles capture, associated with their lower rate of penetration into CS, was higher, thus increasing the system surface.
EC-based Zn₃(PO₄)₂ protected CS through passivation, by shifting E towards more electropositive values than those of the bare metal. Ec impedance measurements allowed to quickly evaluate parameters that agreed with what was observed using stationary methods. Cres and Crev measurements enabled to assess EC corrosion resistance brought by the anti-corrosive pigment.
EC did not detach during delamination tests, which shows that the system adhered well on CS. Thus, EC can be considered as good protection systems for metal structures in saline and aggressive media.
Finally, Ec tests enabled to highlight a correlation between the interface morphology and the adhesion level. A higher CR was obtained for rough interfaces (600 mesh), and compared to other experimental results (salt spray test).
Acknowledgments
The authors would like to thank the Laboratoire Traitement et Mise en Forme des Polymères Fibreux /Faculté Sciences de l’Ingénieurs and M’hamed Bougara University of Boumerdes, for funding this study.
Authors’ contributions
Naima Boudieb: collected the data; inserted data or analysis tools; performed the analysis; wrote the paper. Moussa Bounoughaz: conceived and designed the analysis; inserted data or analysis tools; performed the analysis; wrote the paper. Zohra Ghebache: wrote the paper. Fahim Hamidouche: realized salt spray test observations and interpretation of their results.
Abbreviations
AE: auxiliary electrode
CA: Chronoamperometry
Cdl: double layer capacity
CR: corrosion rate
Cres: coating resistance
Crev: coating capacity
CS: carbon steel
e: coating thickness
E: potential
Ec: electrochemical
EC: epoxy coating
Ecorr: corrosion potential
EIS: electrochemical impedance spectroscopy
ENAP: Enterprise national algérienne des peintures (Algerian national painting company)
I: current
Icorr: corrosion current
IT: immersion time
J: current density
PDP: potentiodynamic polarization
RE: reference electrode
Rp: polarization resistance
Rs: solution resistance
S: exposed surface
SCE: saturated calomel electrode
SR: scan rate
WE: working electrode
Zn₃(PO₄)₂: zinc phosphate
Symbols definition
ξo: vacuum permeability
ξ: medium absolute permittivity
ξr: coating relative permittivity


