


 Inglês (pdf)
 Artigo em XML
 Referências do artigo
 Enviar este artigo por email
 Citado por SciELO
  Similares em
SciELO
Similares em
SciELO 
 Permalink
Introduction
Corrosion is the destruction of metals due to chemical interaction or electrochemical reaction with their environment. MS is an alloy that can be used in industries for functional and aesthetic purposes. It is largely employed in manufacturing applications such as machinery, due to its work ability without defects, and economic feasibility 1,2. Acidic solutions are generally used for the removal of rust and scale in industrial processes. HCl is widely used in steel and ferrous alloys pickling, cleaning and descaling. CI are often used in these processes to control metal dissolution 3-5. The role of an inhibitor is to form a barrier against acid attack. The protective action is often associated with chemical or physical adsorption involving a variation in the charge of the adsorbed substance and its transfer from one phase to the other. Most organic inhibitors for steel corrosion in different aggressive media are organic compounds containing N, S, O and P atoms, or N-hetero cyclic compounds with polar groups. These groups of atoms or bonds facilitate electronic interactions between organic CI and metal surfaces, thereby aiding their adsorption onto steel. In the past few years, the quest for eco-friendly compounds as CI has shifted the research focus onto exploring the potential application of expired drugs 6-15. Recently, many expired drugs have been reported to be very effective CI for MS protection against acidic media, to promote eco-friendly environments 16-19.
Most drugs work effectively in the corrosive blood environment of our body. This led to the motivation of the present study to find out the effect of expired EGS on MS protection in an acidic solution. Herein, MS corrosion resistance properties due to EGS were investigated in HCl solutions by WL and electrochemical methods. MS surface morphologies were assessed by SEM, EDX and AFM techniques. EGS excellence as CI or additive is based on its environmentally friendliness, since its molecules have N and O as active center atoms.
Experimental techniques
Materials
MS specimens were made from the same sheet of the following composition: C - 0.1%, S - 0.026%, P - 0.06%, Mn - 0.4% and the balance Fe. MS specimens with dimensions 1.0 × 4.0 × 0.2 cm were polished to mirror finish, degreased with trichloroethylene, and used for WL and surface examination studies.
MS specimen encapsulated in Teflon with an exposed cross section of 1cm2 was used as working electrode in PDP studies. The electrode surface was polished to mirror finish and degreased with trichloroethylene. 1 M HCl was prepared by diluting HCl analytical grade with double distilled water. MS cylindrical rods of the same composition, embedded in PTFE, with an exposed area of 1 cm2, were used for PDP and EIS measurements. The electrode was polished using a sequence of emery papers of different grades, and then degreased with acetone.
All chemicals used in this work were of analytical grade, and the solutions were prepared using distilled water. Stock solutions from the examined EGS were prepared by liquefying the suitable weight of pure solid drug in double distilled water. The test solutions were prepared using a 1 M HCl solution with various Ct of EGS. The blank solution was used for comparisons. All tests were done at room T, in magnetically stirred solutions.
Inhibitor characteristics
The inhibitor compound was purchased as expired EGS drug from a pharmaceutical store. EGS name and molecular structure is given in Fig. 1.
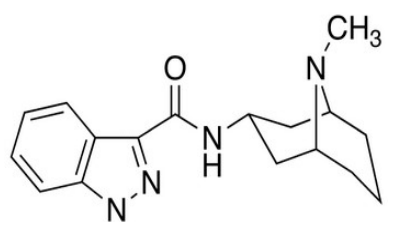
Figure 1: 1-Methyl-N-((1R,3r, 5S)-9-methyl-9-azabicyclo[3.3.1]nonan-3-yl)-1H-indazole-3-carboxamide.
EGS, with molecular weight of 312.4, is a serotonin 5-HT3 receptor antagonist used as an antiemetic to treat nausea and vomiting, due to chemotherapy and radiotherapy, which is soluble in water 20. Its main effect is to reduce the vagus nerve activity, which is a nerve that activates the vomiting center in medulla oblongata. It does not significantly mitigate vomiting, due to motion sickness. This drug does not have any effect on dopamine receptors or muscarinic receptors.
Inhibitor preparation
Double distilled water was used wherever necessary in the solutions preparation. Analytical grade HCl was taken as such and diluted to the required Ct. The required Ct of EGS stock solution was prepared by dissolving it in a minimum amount of ethanol, and making up to the desired volume with double distilled water. Then, the required volume from EGS stock solution was added to the HCl solution, for obtaining the desired Ct. For all the studies, the same volume of ethanol was used to dissolve EGS.
WL measurements
Weight of the three polished MS specimens was measured before and after immersion in various test solutions of 1 M HCl with different Ct of EGS, for 2 h. IE(%) were calculated from eq. (1) 21,22.
 (1)
(1)
where CR1 and CR2 are CR without and with EGS, respectively. CR, in mmd, was calculating using the following formula:
 (2)
(2)
where W is WL in gram, a is the specimen area in cm2, d is thickness (7.8 cm) and t is IT in h.
Electrochemical study
In the present work, CI of MS immersed in various test solutions was measured by PDP study. EIS measurements were performed in a CHI- electrochemical work station with impedance model 660A.
Polarization study
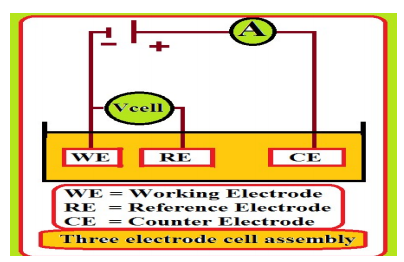
Polarization studies were carried out in a three-electrode cell assembly (Fig. 2). SCE, Pt and MS were reference, counter and working electrodes, respectively. From the polarization study, corrosion parameters such as Ecorr, Icorr, (a, (c and LPR values were measured 23,24.
AC impedance spectra
The same instrument and set-up used for polarization study was employed to record AC impedance spectra. A time interval of 5 to 10 min was given for the system to attain OPC steady state. The real (Z’) and imaginary (-Z”) parts of the cell impedance were measured in ohms, at various frequencies. AC impedance spectra were recorded with initial potential (V) of 0, high (1-105 Hz) and low (1 Hz) frequencies, amplitude (V) of 0.005 and quiet time (s) of 2. From Nyquist plot, Rct and Cdl values were calculated 25,26.
Surface examinations
MS specimens were immersed in HCl without and with EGS, at various Ct, for 2 h. Then, the samples were taken out and dried. The nature of the film formed on the MS surface was analyzed by SEM, EDX and AFM surface analytical techniques.
SEM analysis
MS specimens immersed in various test solutions for 2 h were taken out, rinsed with double distilled water, dried and subjected to surface examination 27. Surface morphology measurements of the MS surface were carried out by SEM (JEOL MODEL JSM 6390).
EDX analysis
The elements present on the MS surface immersed in HCl, for 2 h, with and without EGS, were examined by EDX. Then, they were removed, quickly rinsed and dried. The analysis was performed on Quantex 200 with X Flash-6130 EDX.
AFM analysis
The MS specimens immersed, for one day, in various test solutions, were taken out, rinsed with double distilled water, dried and subjected to surface examination 28. MS surface morphology measurements were carried out by AFM, using SPM Veeco di Innova connected with the software version V7.00, at the scan rate of 0.7 Hz.
Results and discussion
WL measurements
CR and corrosion IE(%) were determined by WL method, before and after MS immersion in 1 M HCl. Corrosion parameters obtained by WL method, such as CR of MS immersed in 1 M HCl without and with expired EGS drugs, and their IE(%), are given in Table 1. It is seen that 0.001 M EGS gave 93.88 IE(%). With higher Ct of EGS, corrosion protection properties increased. This was due to an increase in the SC of MS by EGS, at higher Ct, which hindered its dissolution. The interface between hetero atoms in EGS and ions from the MS surface was due to higher IE(%). The occurrence of active constituents in EGS may been accountable for CI of MS, due to its anti-corrosive properties. The same hypothesis has been reported by 29-33.
Table 1: CR, IE(%) and SC of MS immersed in 1 M HCl with various Ct of EGS, obtained by WL method, at 303 K.
| 1 M HCl | ||||
|---|---|---|---|---|
| S. No | Ct of EGS (M) | CR (mpy) | IE(%) | SC (θ) |
| 1 | blank | 0.8386 | - | - |
| 2 | 0.0000001 | 0.2995 | 64.28 | 0.6428 |
| 3 | 0.000001 | 0.2396 | 71.45 | 0.7145 |
| 4 | 0.00001 | 0.1797 | 78.57 | 0.7857 |
| 5 | 0.0001 | 0.1112 | 86.73 | 0.8673 |
| 6 | 0.001 | 0.0513 | 93.88 | 0.9388 |
Effect of T
The effect of T on MS corrosion in HCl with and without EGS is shown in Table 2. It can be seen that WL increased with higher T, without and with inhibitor. At high T, MS dissolution increased, and underwent severe corrosion. In electrochemical studies, T influence on the adsorption mechanism of EGS molecules onto the MS surface of demonstrates its main role. In fact, corrosion IE(%) of EGS and CR of MS were investigated for EGS inhibitor system, from 0.0000001 to 0.001 M, with T from 303 to 333 K 34. IE(%) and CR values are given in Table 2.
Table 2: Values for CR of MS, and IE(%) and SC of 0.001 M EGS, for various T, in 1 M HCl.
| 1 M HCl | ||||
|---|---|---|---|---|
| S. No | T (K) | CR (mpy) | IE(%) | SC (θ) |
| 1 | 303 | 0.0513 | 93.88 | 0.9388 |
| 2 | 308 | 0.0855 | 89.8 | 0.898 |
| 3 | 313 | 0.1283 | 84.7 | 0.847 |
| 4 | 318 | 0.2225 | 73.46 | 0.7346 |
| 5 | 323 | 0.3508 | 58.16 | 0.5816 |
| 6 | 328 | 0.4535 | 45.92 | 0.4592 |
| 7 | 333 | 0.5648 | 32.64 | 0.3264 |
IE(%) decreased from 93.88 to 32.64%, and CR increased from 0.0513 to 0.5648 (mpy), with a rise in T from 303 to 333 K, in 1 M HCl, at the maximum Ct (0.001 M) of EGS. T effect on MS dissolution and EGS molecules partial desorption from the metal surface increased with the inhibitor higher Ct 35.
PDP studies
PDP technique has been applied to observe the development of a defensive layer on the MS surface 36. When a protective film was developed on the MS surface, LPR values increased and icorr decreased. PDP arcs of MS submerged in 1 M HCl without and with EGS are shown in Fig. 3.
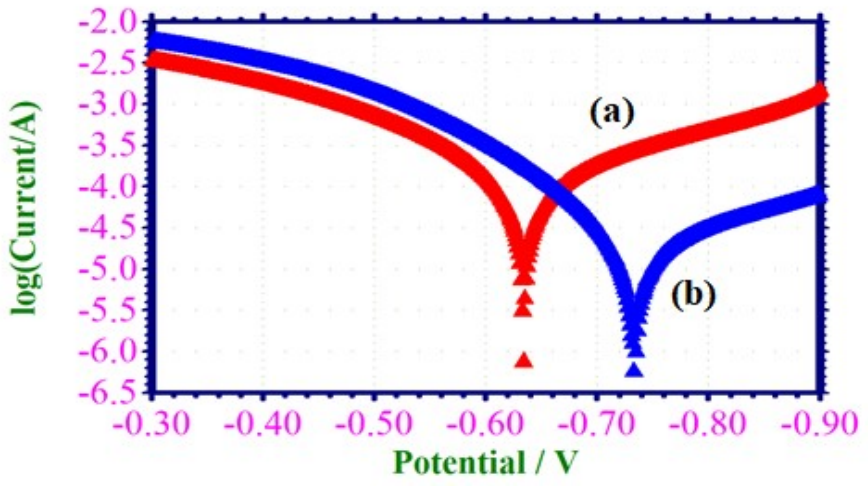
Corrosion parameters, namely, Ecorr, (c, (a, LPR and Icorr, are given in Table 3.
Table 3: PDP parameters for MS corrosion in 1 M HCl without and with EGS.
| Ct of EGS (M) | Ecorr mV/SCE | Tafel slopes | Icorr A/cm2 | LPR Ω/cm2 | |
|---|---|---|---|---|---|
| (a mV/dec | (c mV/dec | ||||
| blank | - 632 | 0.152 | 0.208 | 1.2730 × 10⁻⁴ | 291 |
| 0.001 | - 732 | 0.104 | 0.235 | 2.2010 × 10⁻⁵ | 1502 |
Fig. 3a shows that, for MS immersed in 1 M HCl, Ecorr was -632 mV vs. SCE. LPR value was 291 ohm/cm2. Value of icorr was 1.2730 × 10⁻⁴ A/cm2.
Ecorr shifted to the cathodic side (-732 mV vs. SCE) when 0.001 M EGS was added to 1 M HCl, due to the formation of a defensive layer on the MS surface (Fig. 3b). This film controlled the cathodic reaction of MS dissolution, by forming a Fe2+-EGS complex on the cathodic sites of the metal surface 37-41. EGS acts as cathodic type inhibitor, because, Ecorr shift went towards a more negative side than that of the blank. Increase in LPR and decrease in Icorr values indicate the strong corrosion resistant nature of the inhibitor system.
Analysis of AC impedance spectra
EIS have been used to validate the development of a defensive layer on the MS surface 42-44. If a defensive layer is formed on the MS surface, Rct increases, Cdl decreases and impedance log (z/ohm) increases. AC impedance spectra of MS immersed in 1 M HCl, without and with EGS, are shown in Fig. 4 (Nyquist plots), and the values are given in Table 4.
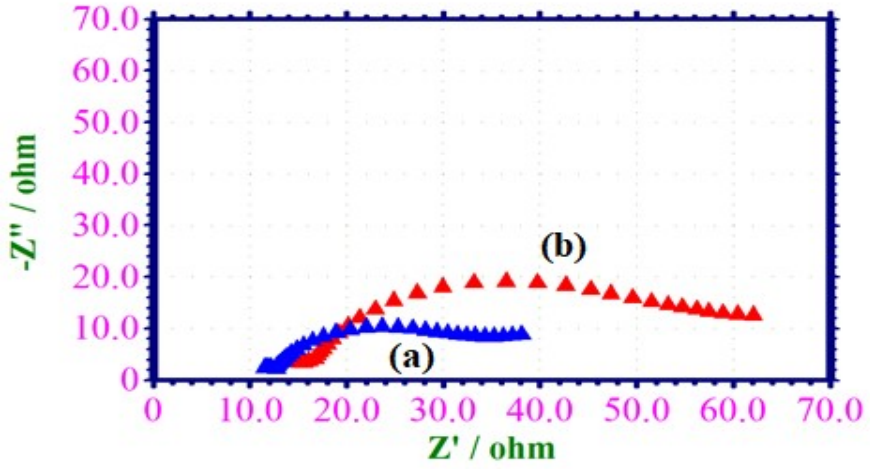
Figure 4: AC impedance spectra of MS immersed in: (a) 1 M HCl without EGS; and (b) 1 M HCl with 0.001 M EGS (Nyquist plots).
Table 4: EIS parameters from Nyquist plots for corrosion of MS immersed in 1 M HCl without and with EGS.
| Ct of EGS (M) | Nyquist plot | Impedance log (z/ohm) | Phase angle (º) | |
|---|---|---|---|---|
| Rt 𝛀/cm2 | Cdl F/cm2 | |||
| blank | 23.69 | 42.3779 × 10⁻⁶ | 0.502 | 25.9 |
| 0.001 | 46.76 | 76.6604 × 10⁻⁶ | 0.604 | 31.9 |
When MS was immersed in 1 M HCl, LPR value was 23.62 ohm/cm2, and Cdl value was 42.3779 × 10⁻⁶ F/cm-2. LPR value increased from 23.62 to 46.76 ohm/cm2, when 0.001 M EGS was added to 1 M HCl. Cdl value also decreased from 42.3779 × 10⁻⁶ to 76.6604 × 10⁻⁶ F/cm-2. Impedance value [log (z/ohm)] increased from 0.502 to 0.604. Furthermore, the inhibitor system phase angle increased from 25.9 to 31.9o, when compared to the blank system (45-47. This suggests that a defensive layer was formed on the MS surface.
Fig. 5 shows Bode plots.
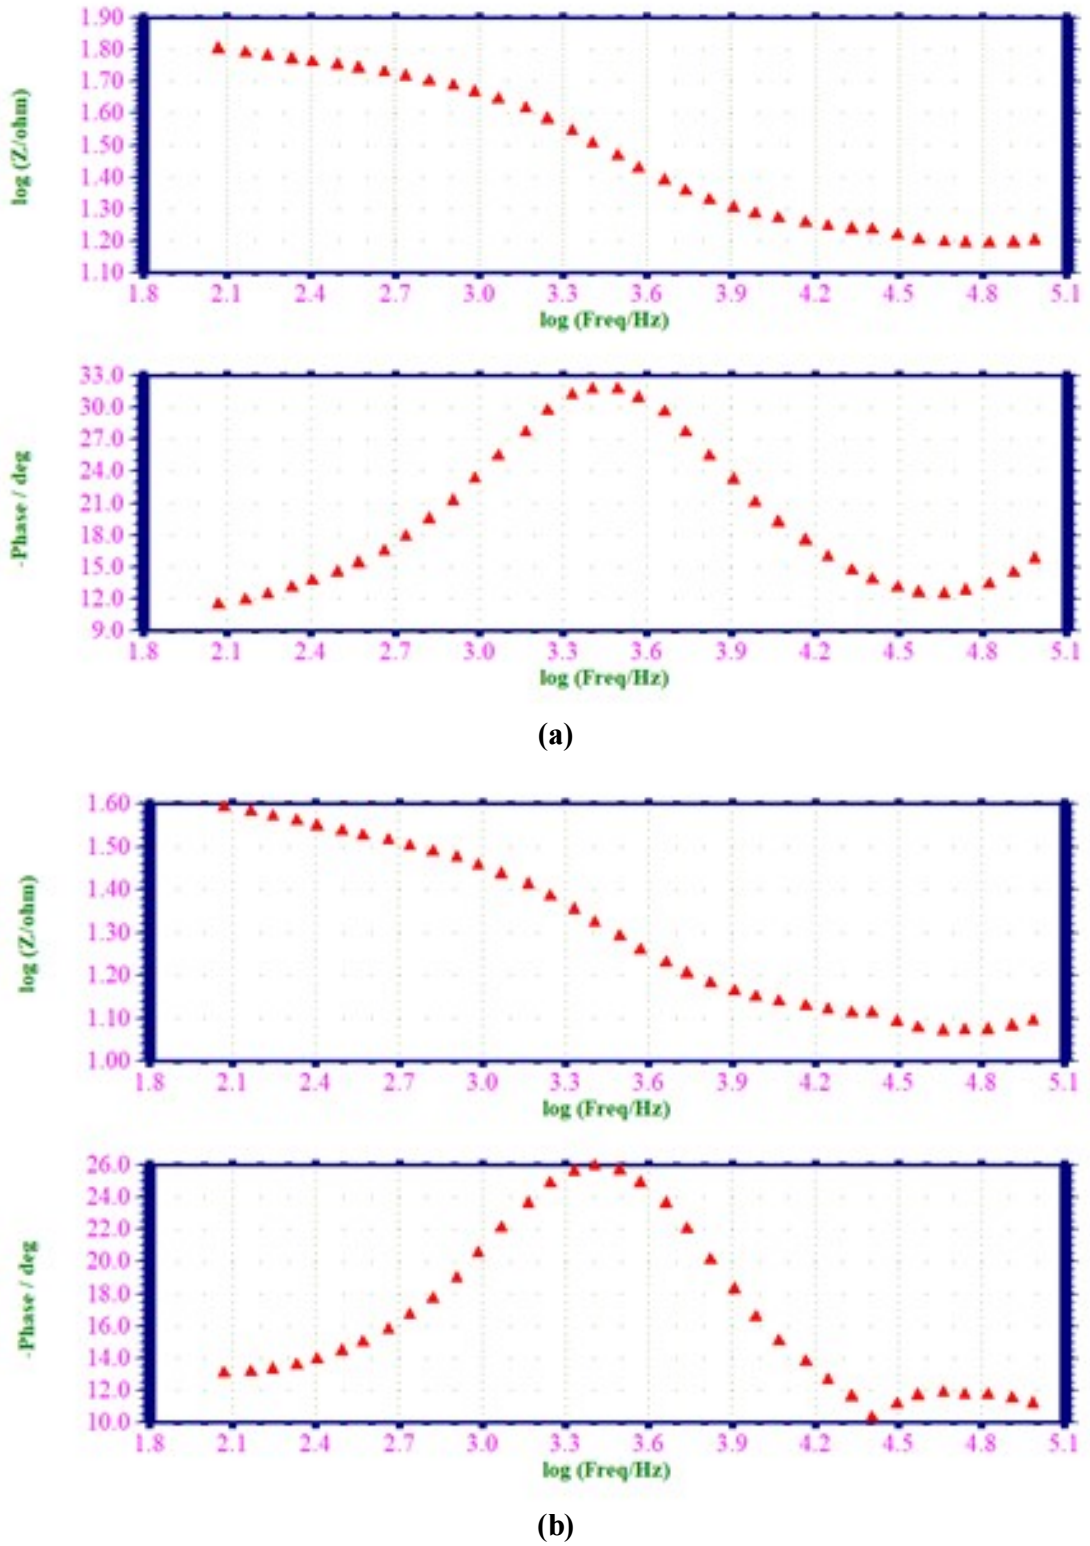
Figure 5: AC impedance spectra of MS immersed in 1 M HCl (Bode plot); (a) blank; and (b) with 0.001 M EGS (Bode Plot).
MS surface analysis by SEM
SEM pictures of the MS surface are examined without and with EGS 48,49, to understand the nature of the coating developed in the inhibitor absence and presence, and the extent of metallic corrosion (50). SEM images of MS immersed in 1 M HCl, for 2 h, without and with EGS, are shown in Figs. 6 (a-c) respectively.
Images of polished MS are shown (control) in Fig. 6a, which depict its smooth surface. The MS surface was corroded due to its dissolution in 1 M HCl (blank) (Fig. 6b), and it is rough. CR of the MS surface immersed in 1 M HCl with 0.001 M EGS (Fig. 6c) was suppressed, as it can be seen from the decrease in corroded areas. MS is almost free from corrosion, due to the formation of an insoluble complex on its surface. MS surface smoothness is almost equal to the polished one 51, as it was covered by a thin layer of EGS, which controlled its dissolution in 1 M HCl.
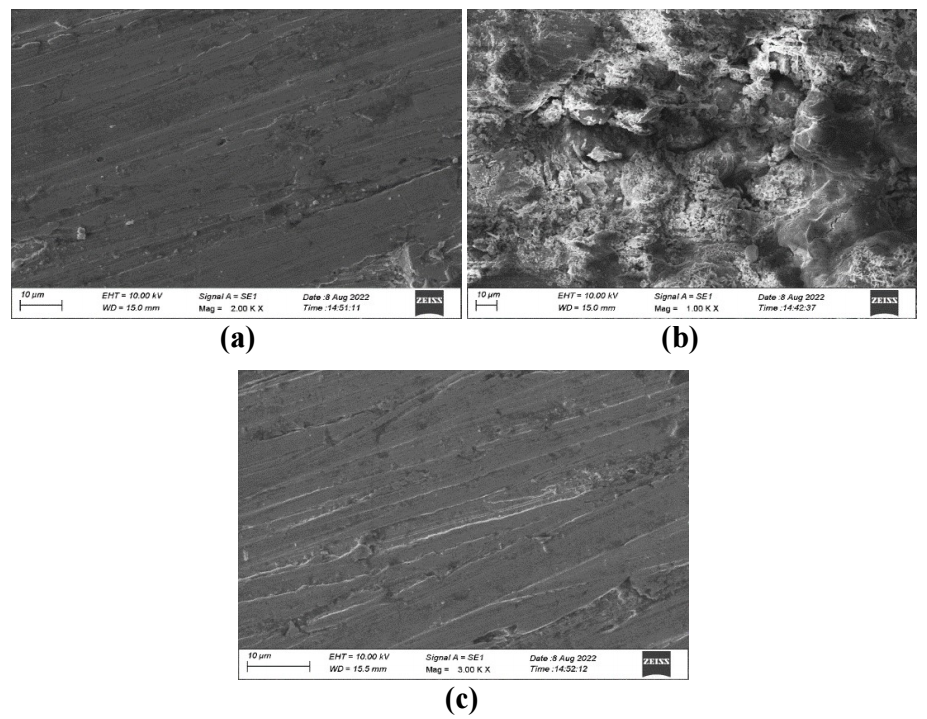
Figure 6: SEM image of MS coupon- (a) polished; (b) after immersion in 1 M HCl (blank); (c) after immersion in 1 M HCl with 0.001 M EGS.
Surface characterization of MS by EDX
EDX examinations of the MS surface were performed in the absence and presence of EGS system. EDX spectra have been used to determine the elements present on the MS surface before and after exposure to EGS 52-54.
EDX spectrum of MS (Fig. 7a) shows the characteristic peaks of some of the elements constituting the MS sample. EDX spectrum of MS immersed in 1 M HCl (Fig.7b) shows the dissolution in MS constituting elements. Moreover, Cl- presence caused MS damages by 1 M HCl. EDX spectrum of MS immersed in 1 M HCl and 0.001 M EGS (Fig. 7c) shows an additional line characteristic of Cl signals reduced intensity and of MS surface constituting elements increased strength signal. Fe signal appearance and O signal enhancement are due to EGS presence. These data show that the CS surface was covered with Fe, S, C, P, Ni, N and O atoms.
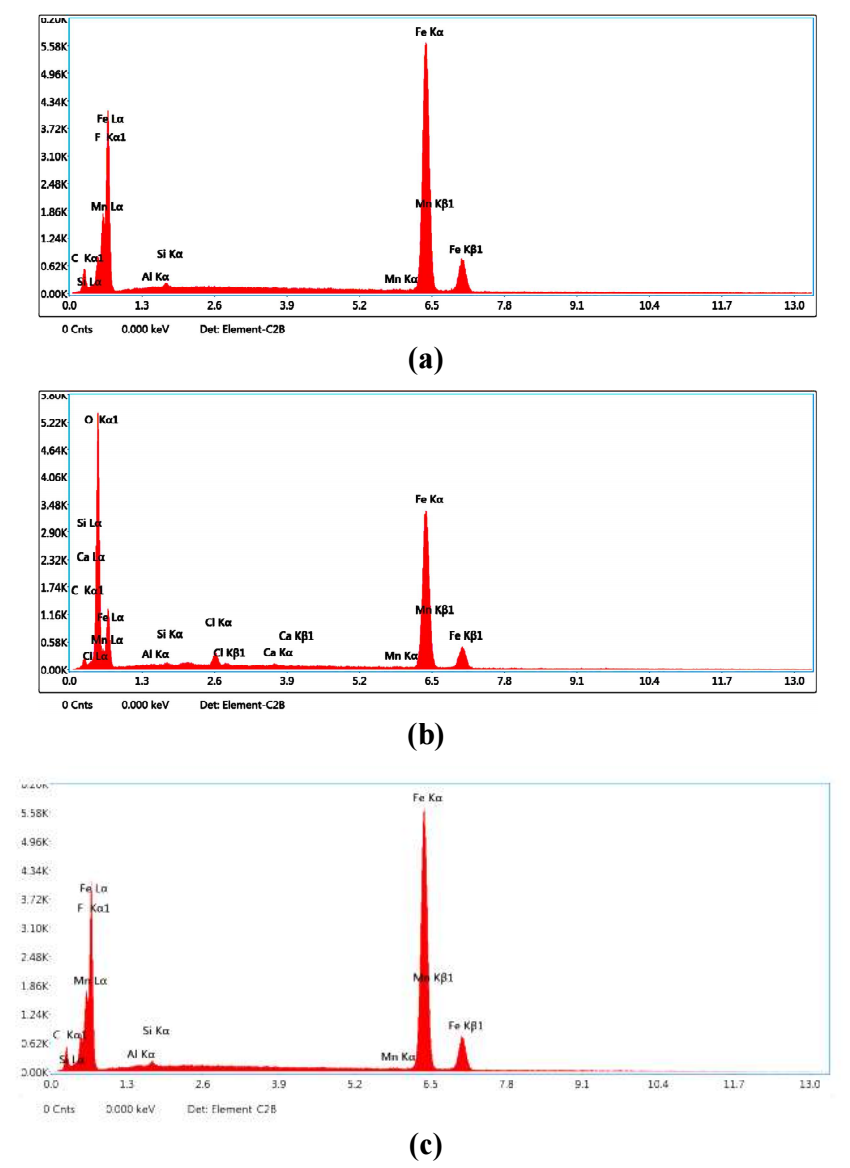
Figure 7: EDX spectra of MS specimen- (a) control; (b) immersed in 1 M HCl (blank); (c) immersed in 1 M HCl with 0.001 M EGS.
MS surface analysis by AFM
Figs. 8a-c show AFM morphologies and cross-sectional profiles for the MS surface: polished (control sample), in 1 M HCl (blank sample); and in 1 M HCl with 0.001 M EGS.
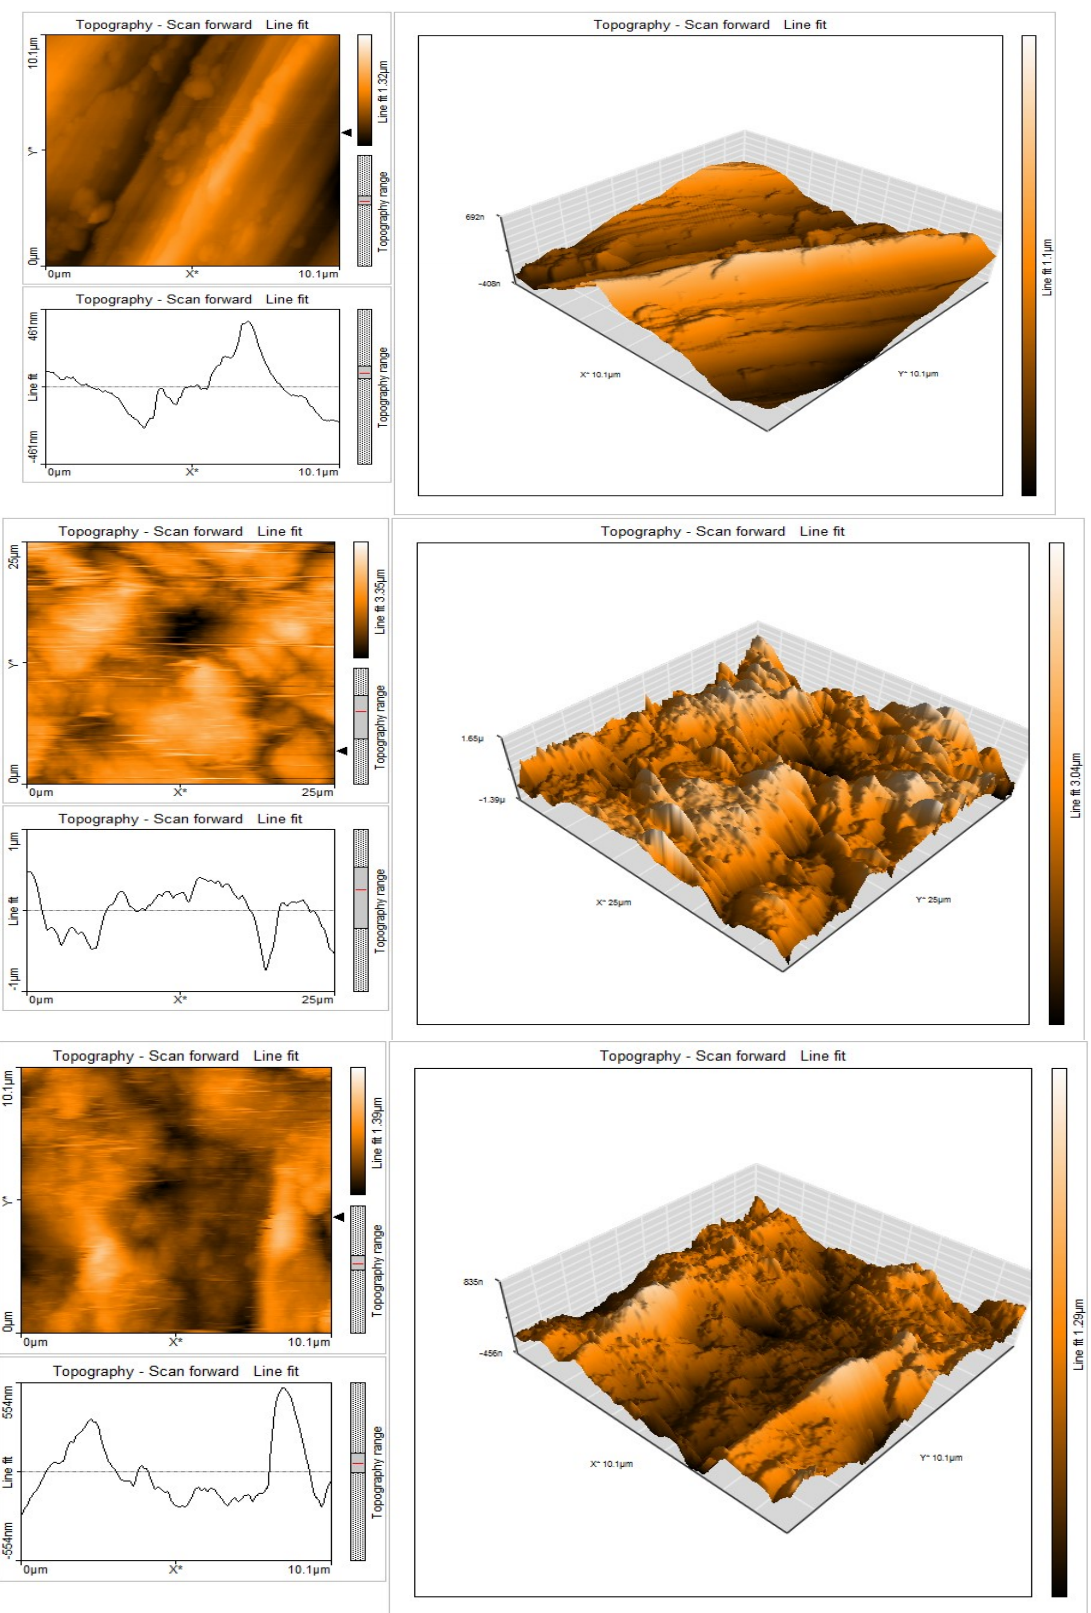
Figure 8: AFM cross sectional image of MS surfaces- (a) polished (control); (b) after immersion in 1 M HCl (blank); (c) after immersion in 1 M HCl with 0.001 M EGS.
Roughness in any surface is easily investigated by AFM studies. AFM provides direct insight into the changes in the surface morphology that take place at several hundred nanometers 54.
Topographical changes took place in the MS surface, i.e., corrosion and formation of a protective layer on its surface, without and with EGS, respectively. Herein, EGS effect on the MS surface corrosion in HCl was examined by AFM. This characterization contains three dimensional (3D images).
AFM images analyses were performed to obtain: the area and line surface roughness - Sa and Ra (average deviation of all points roughness profile from a mean line over the evaluation length); Sq and Rq (root-mean-square surface roughness- the average of the measured height deviations taken within the evaluation length and measured from the mean line); Sy and Ry (largest single peak-to-valley height in five adjoining sampling heights); and Sp and Rp (maximum profile peak height), which indicates the point along the sampling length at which the curve is highest.
AFM parameters for area and line surface roughness are given in Tables 5 and 6, respectively.
| MS surface samples | Sa nm | Sq nm | Sy nm | Sp nm |
|---|---|---|---|---|
| Polished | 136.47 | 168.68 | 892.96 | 476.88 |
| In 1 M HCl | 379.59 | 476.21 | 3295.4 | 1530.6 |
| In 1 M HCl + 0.001 M EGS | 155.57 | 187.28 | 1149.6 | 639.8 |
Table 6: AFM data for MS immersed in HCl without and with EGS (line roughness).
| MS surface samples | Ra nm | Rq nm | Ry nm | Rp nm |
|---|---|---|---|---|
| Polished | 119.44 | 161.1 | 684.87 | 406.66 |
| In 1 M HCl | 344.72 | 393.18 | 1359.9 | 726.51 |
| In 1 M HCl + 0.001 M EGS | 181.52 | 199.83 | 675.66 | 365.55 |
Sa and Ra values for CS in HCl (blank) are the highest. With 0.001 M EGS, this value decreased, but is higher than that of the polished MS surface, because the inhibitor formed a layer that covered the MS surface. This film was found to be smooth. The same happened with Sq, Rq, Sy, Ry and Sp and Rp55-56.
Conclusions
In the present study, EGS inhibition of MS corrosion in 1 M HCl was tested. With higher Ct of EGS, an increase in its IE(%) and a decrease in CR of MS in 1 M HCl medium were observed. 0.001 M EGS obtained maximum IE(%) of 93.88%. PDP studies revealed that EGS performed as a cathodic type of inhibitor. According to EIS, there was an increase in LPR and a decrease in Cdl. This behavior was due to the formation of a dense protective layer on the MS/HCl surface, which was characterized by SEM. Furthermore, EDX showed MS smoother surface with EGS than without it. Ra value of MS was lower than that of the blank, and higher than that of the polished sample, which was confirmed by AFM. EGS acted as an efficient inhibitor of MS corrosion in a 1 M HCl medium. The outcome of the study may find application in the pickling industry.
Acknowledgements
The authors are thankful to the Principal and College Management Committee Members of Jamal Mohamed College (Autonomous), for providing necessary facilities, and to DBT and DST-FIST, for providing instrumental facilities to carry out research work.
Authors’ contributions
S. Musthafa Kani: contributed to writing of the original draft, validation, investigation, supervision and methodology. M. Anwar Sathiq: contributed to review and editing. S. S. Syed Abuthahir: involved in the characterization analysis of the study.
Abbreviations
AC: alternating current
AFM: atomic force microscopy
Cdl: double layer capacitance
CI: corrosion inhibitor/inhibition
CR: corrosion rate
Ct: concentration
Ecorr: corrosion potential
EDX: energy-dispersive X-ray spectroscopy
EGS: Granisetron (C18H24N4O)
EIS: electrochemical impedance spectroscopy
HCl: hydrochloric acid
Icorr: corrosion current
IE%: inhibition efficiency
IT: immersion time
LPR: linear polarization resistance
MS: mild steel
OCP: open circuit potential
PDP: potentiodynamic polarization
PTFE: polytetrafluoroethylene
Ra: average surface roughness
R2: regression coefficient
Rct: charge transfer resistance
SC: surface coverage (θ)
SCE: saturated calomel electrode
SEM: scanning electron microscopy
T: temperature
WL: weight loss

