Introduction
Tourism constitutes a fundamental pillar in the global economic dynamics, driving the growth of various sectors (Telfer & Sharpley, 2015). This extensive range of influences underscores the importance of tourism as a driver of economic development and a fertile ground for research and innovation in understanding consumer behaviour.
Within the realm of tourism and hospitality, previous studies have demonstrated how affective states play a crucial role in influencing tourists' motivations, actions, decisions, and satisfaction levels (Goossens, 2000; Tsai, 2007). However, the measurement of these emotions, traditionally conducted through subjective tools such as surveys and questionnaires, often proves insufficient to capture the complexity of tourist experiences (Ziegel et al., 1998). In this context, neurotourism emerges as a pioneering application or integration of neurosciences within the tourism sector aimed at refining marketing strategies directed towards tourists (Panyik & Gonçalves, 2017; Alsharif et al., 2023). Neuroscience presents itself as a revolutionary interdisciplinary tool and approach that seeks to transform our understanding of tourists' decisions and preferences, offering an objective basis for designing and implementing more enriching and satisfying tourist experiences (Agarwal & Dutta, 2015).
Psychophysiological techniques, such as Eye-Tracking (hereafter ET) and Galvanic Skin Response (hereafter GSR), are emerging as valuable methods for analysing how tourists visually process images of destinations, offering significant advantages in understanding the psychological and emotional processes underlying reservation decisions (Boz & Koç, 2022; Kim & Kim, 2024; Xie, Zhang & Ma, 2023) or even in analysing the type of navigation used with Travel 2.0 tools (Muñoz-Leiva et al., 2016).
These techniques, by recording eye movements and changes in pupil contraction or dilation (Casado-Aranda et al., 2023), reveal the unconscious behaviour of individuals in response to different visual stimuli (Ahn et al., 2018; Scott, Le et al., 2020), typically in a controlled environment (Duchowski, 2002; Bielikova et al., 2018). Researchers sometimes combine ET techniques with other neuroscientific methods, such as EEG (Electroencephalogram). For example, the Babaç & Yüncü (2022) study evaluates the user experience on specific websites. The tourism sector, characterised by the intangibility of its products, greatly benefits from analysing travellers' visual attention through images (Rakić & Chambers, 2010; Li et al., 2016). These not only shape the perception of the destination (Espelt & Benito, 2005) but also impact purchase decisions (Underwood & Klein, 2002) or booking tourist services (Lustigová et al., 2021). The destination image, defined as an attitudinal construct that includes knowledge, emotions, and overall impressions (Baloglu & McCleary, 1999; Tasci & Gartner, 2007), is more influenced by visual elements than by actual features, conveying ideas and values as well (Mackay & Fesenmaier, 2000).
Eye tracking has been applied in marketing research, particularly over the last decade, due to the interest in studying the visual attention of consumers and users (Muñoz-Leiva, 2023). ET applied to tourism enables marketing professionals to optimise resources, advertising strategies, and content (Wedel & Pieters, 2008), ensuring that a destination's most attractive and differentiating aspects are effectively highlighted (Savin et al., 2022). Moreover, the detailed analysis of viewing patterns helps predict consumer behaviour, allowing for the development of more personalised and effective campaigns to enhance the tourist experience and promote destination choice (Le et al., 2020).
GSR, a psychophysiological technique, serves to detect emotional activation through changes in skin, sweat and electricity, reflecting emotional arousal (McCleary, 1950). This methodology allows for the measurement of activation, impact, and emotional valence, revealing whether reactions to a stimulus are positive or negative. Guerrero-Rodríguez et al. (2020) investigated how a promotional video affects perception and the intention to visit a tourist destination, concluding that, although the video had a significant impact, the mode of viewing did not alter the results, and psychophysiological measures did not always coincide with self-reports. Similarly, Li et al., 2016 used GSR to analyse emotional responses to tourist advertisements, finding coherence between the reported affective experience and the collected emotional data, demonstrating the effectiveness of these techniques in capturing instant emotional responses. Scott et al. (2016) compared two versions of a tourism advertisement, finding that block advertisements are more effective at capturing attention than those with text. Deng Lin & Chen (2021) explored how first impressions and visual appeal of photographs influence the intention to visit a destination, concluding that natural and professional images improve perception and choice intention. These studies underline the importance of ET in understanding visual attention and decision-making in tourism.
1.1 Innovation: Neurotourism and Brand Personality
Despite the growing importance of neurotourism, few studies have ventured to address tourism destination brand logos through ET and GSR techniques. The sole notable study to date is that of Lourenção et al. (2020), which examines how logos influence tourists' visual attention and their perception of advertisement effectiveness. However, some recent works have indeed addressed the integration of neuroscience in tourism, for example by analysing tourist behaviours (Ma et al., 2014), managing tourism marketing (Giudici et al., 2017), and studies examining the directions and usage of neurotourism (Cardoso et al., 2024; Li et al., 2023). Nonetheless, no study has addressed the Brand Personality (BP) of tourism destination brand logos and directly linked it to neurotourism techniques, nor on images generated by artificial intelligence representing the BP dimensions of the destination.
BP is the theoretical construct underpinning our research with the employed neuroscientific methods (ET and GSR). Its use is justified from the perspective of evidence in the academic literature that defends the notion that a destination's BP exerts a notable influence both on the image tourists perceive of it (Ekinci & Hosany, 2006; Papadimitriou et al., 2015) as well as on their behaviour (Baloglu et al., 2014; Hultman et al., 2015).
The BP construct, introduced in the 1990s by Aaker and Fournier, has been established as a distinctive mechanism that enriches a brand's value (Aaker & Fournier, 1995). According to Aaker (1997), BP encapsulates a set of human attributes associated with a brand, organised into five key dimensions: sincerity, excitement, sophistication, competence, and ruggedness. Research on BP has shown a historical preference for quantitative methodologies, particularly surveys, alongside traditional techniques such as SEM and PLS, which have predominated in this field for years. However, this approach presents limitations, including biases (Westland, 2014). In this context, neuroscience stands out as a promising field, offering techniques capable of revealing consumers' direct and unconscious reactions to brands. This allows for a deeper understanding of how tourists form brand associations in their minds, as suggested by Kotsi et al. (2018). ET methods, in particular, provide objective measures of participants' attention and interest, aiding in measuring both conscious and unconscious attention, thus avoiding biases and validity issues in data collection, as argued by Scott et al. (2020), and overcoming the limitations of self-report instruments that depend on individual reflection and memory, susceptible to exogenous influences, according to Schwarz (1999).
The study presented constitutes a significant contribution to research in the field of BP and tourist consumer behaviour, standing out for pioneering the integration of neurotourism techniques, specifically ET and GSR, in analysing tourism destinatination brand logos and AI-generated images of renowned European cities.
The main objective of this research is to identify and establish attention patterns in the areas of interest (AOIs) and GSRs related to the different dimensions of BP. Through the use of ET, we aim to delve deeper into understanding how tourist consumers perceive and react emotionally to these logos, thereby facilitating a more detailed comprehension of the interaction between the visual presentation of destinations and consumer psychology. In addition to establishing certain design-stimulus guidelines for those managing the destination's corporate image.
Following the introduction, the manuscript is structured into multiple sections. The second section covers a theoretical framework that breaks down the BP dimensions according to Aaker (1997) and explores the application of ET and GSR techniques in the study of tourism destinatination brand logos. The methodology is detailed in a third section, describing the initial design and selection of stimuli based on tourism destinatination brand logos representing the five dimensions (sincerity, sophistication, excitement, competence, and ruggedness) of BP, as well as the specific design for ET and measurement parameters. The results are presented in the fourth section, revealing significant differences in attention and emotional reaction towards the logos/dimensions based on gender or BP. The fifth section addresses conclusions and discussions, highlighting the theoretical and practical contributions of the study, and the sixth section notes the limitations and suggests directions for future research, concluding with a reflection on the study's implications in the field of tourism marketing and neuroscience.
2.Literature review
2.1 Brand Personality dimensions
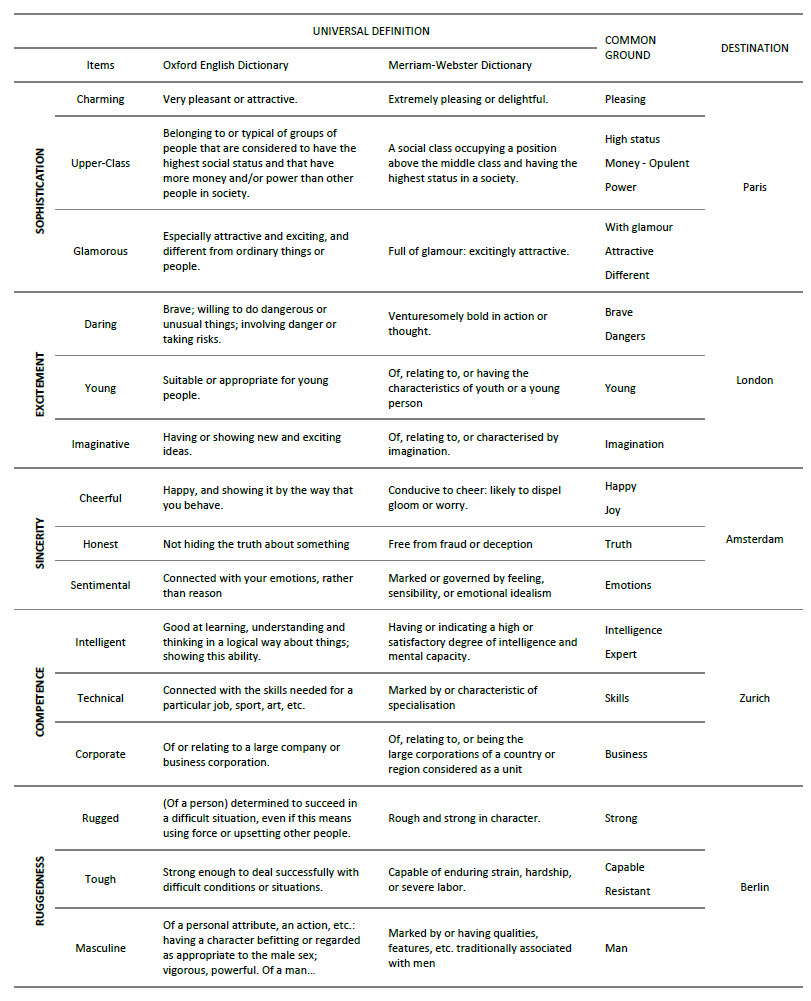
In the field of branding and brand management, Jennifer Aaker's (1997) Brand Personality (BP) model emerges as a crucial theoretical foundation, defining five essential dimensions that shape the brand identity from the consumer's perspective. These dimensions, which include Sincerity, Excitement, Competence, Sophistication, and Ruggedness, are characterised by a specific set of humanised traits that brands adopt to establish a deeper and more emotional connection with their audience. Sincerity relates to honesty and authenticity, positioning brands within this spectrum as genuine and trustworthy (Aaker, 1997). Excitement encompasses characteristics such as being exciting and imaginative, describing brands perceived as dynamic and stimulating (Aaker, 1997).
Competence, associated with efficiency and reliability, reflects brands that convey security and high quality (Aaker, 1997). Sophistication, which includes elegance and charm, identifies brands associated with luxury and exclusivity (Aaker, 1997). Lastly, Ruggedness is noted for its strength and resilience, outlining brands recognised for their durability (Aaker, 1997). This model has not only been pivotal in understanding the interaction between brands and consumers in general but has also found specific applications in tourism. Researchers like Hosany et al. (2006), Ekinci & Hosany (2006), Murphy et al. (2007), and Prayag (2007) have adapted these dimensions to explore the personality of tourist destinations, demonstrating how they influence consumer perception, satisfaction, and visitation intent. Or even in other tourist experiences, such as how customer brand personality influences the dining experience (Ismail, 2022). These studies collectively underscore the relevance of BP in developing tourism marketing strategies, encouraging communicative and positioning strategies that emotionally resonate with the audience, thereby fostering preference and loyalty towards the destination. Integrating these dimensions within tourism marketing enables professionals and academics to design brand experiences that facilitate a more intimate connection with consumers, effectively promoting the choice of one destination over another.
In the tourism context, applying brand personality theory helps understand how destinations can be perceived as entities with human traits, thus affecting destination image and tourist decisions (Ekinci & Hosany, 2006; Hosany et al., 2007). Destination image is defined as the overall perception that tourists have of a place, encompassing both cognitive aspects (knowledge and beliefs) and affective aspects (emotions and attitudes). In this study, advanced eye-tracking and GSR techniques captured both visual attention and emotional arousal of participants observing the AI-generated images of the destinations.
Brand personality consists of five dimensions: competence, excitement, ruggedness, sincerity, and sophistication. These dimensions apply not only to products and services but also to tourism destinations, influencing visitors' perceptions (Aaker, 1997; Ekinci & Hosany, 2006).
The destination image is the perception an individual or a group has of a place, formed by the sum of beliefs, ideas, and impressions about that location (Baloglu et al., 2014). This image is configured as a cognitive construct that involves a subjective knowledge of the destination (Chen & Phou, 2013). In contrast, the destination personality uses human personality traits to describe it, providing an emotional and symbolic framework that complements the physical and tangible characteristics of the place (Ekinci & Hosany, 2006; Chen and Phou, 2013).
Brand personality and destination image are distinct yet interrelated concepts (Hosany et al., 2007; Baloglu et al., 2014; Pereira et al., 2012). The destination image has positive effects on its personality, as brand personality can confirm or refute the image held of it (Chen & Phou, 2013; Pereira et al., 2012). Souiden et al. (2017) confirmed that image precedes personality, establishing that a positive destination image can enhance its personality, making the destination more attractive and distinctive to tourists (Qu et al., 2011).
Ekinci and Hosany (2006) argue that destination brand personality is an extension of the destination image, providing an emotional and symbolic framework that resonates with the tourists' personalities and aspirations (Murphy et al., 2007). This coherence between brand personality and destination image contributes to a clearer and stronger perception of the destination (Ekinci & Hosany, 2006). For instance, a destination projecting an image of adventure and nature should have a brand personality that reinforces these attributes (Qu et al., 2011).
Marketing campaigns that highlight brand personality can enhance the destination image by emphasising emotional and symbolic attributes that attract tourists (Pike et al., 2010). Brand personality acts as a narrative framework that encapsulates the destination's identity, allowing tourists to connect on a deeper level (Hosany et al., 2007). For example, a destination promoted as “adventurous” may use images and messages that evoke freedom, challenge, and wilderness, thereby consolidating its image (Boo et al., 2009). Different segments of tourists may perceive and value various dimensions of brand personality and destination image differently (Ekinci et al., 2013). Tailoring marketing strategies according to these segments can maximise tourist attraction and satisfaction (Dolnicar, 2004). For instance, young tourists might be attracted to a destination with a vibrant and modern personality, while older tourists might prefer more relaxed and sophisticated destinations (Smith et al., 2015).
Brand personality and destination image also significantly influence tourist behaviour. A well-defined and positive brand personality can increase familiarity and affection towards the destination, improving its overall image (Hosany & Ekinci, 2003). Tourists are more likely to consider destinations with an attractive brand personality and a positive image, as these destinations appear to offer more rewarding experiences (Jalilvand et al., 2012). A positive destination image enhances tourist satisfaction and their willingness to recommend the destination (Bigné et al., 2001).
Empirical studies have demonstrated that an attractive brand personality can increase tourists' intention to visit and their loyalty (Murphy et al., 2007; Qu et al., 2011). The combination of a strong brand personality and a positive destination image can maximise the impact on attracting and retaining tourists (Pike et al., 2010). Therefore, it is essential for destination managers to understand and manage both brand personality and destination image effectively to attract and retain tourists.
2.2 Eye tracking and GSR
ET is an advanced tool that enables eye movement tracking, offering a unique window into individuals' cognitive processing and underlying motivations (Rovira, 2016). This technique, grounded in the pioneering research of Just and Carpenter (1980), analyses the direction and fixation of gaze on computer screens, using infrared lights to reveal areas of interest and attention patterns during various tasks. The ability to determine which parts of the screen capture the user's attention provides valuable insights into visual and cognitive behaviour, underscoring the importance of selecting appropriate metrics and the ability to interpret the collected data (Duchowski, 2002).
In the realm of research, ET has established itself as an effective method for assessing the usability and design of products and services, allowing studies to be conducted before, during, or after their development or commercialisation (Goldberg & Wichansky, 2003). This technique is not limited to the observation of visual behaviour but is also complemented by other neuroscientific and biometric tools for a deeper understanding of human reactions.
The integration of GSR, which measures variations in the skin's electrical conductivity caused by sudomotor activity alongside ET, offers a more comprehensive approach to studying individuals' emotional and cognitive responses (Ngan & Yu, 2019). The synergy between ET and GSR opens new avenues in research, enabling not only an understanding of where and how attention is directed but also the emotions and motivations underlying these visual responses
3.Methodology
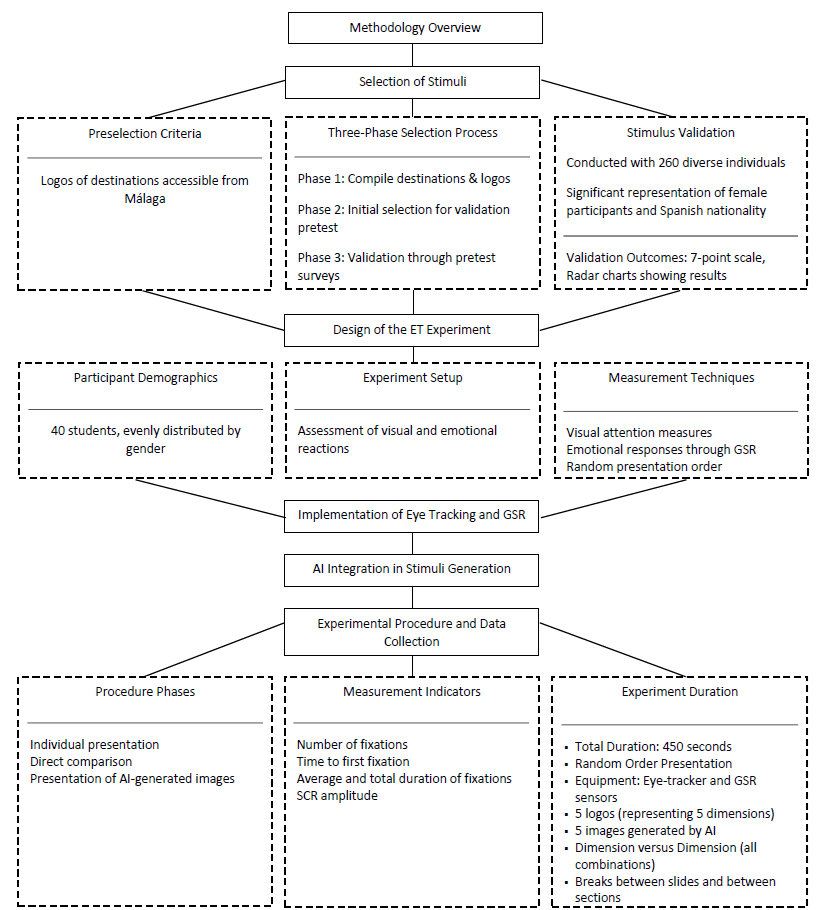
The study addresses the methodology in two main segments: the selection of stimuli and the design of the ET. Initially, tourism destination brand logos accessible from Málaga are preselected for a pretest based on flight frequency and the representation of the BP dimensions. Fifteen logos are chosen after a three-phase process, including generating images with DALL-E to represent these dimensions. Subsequently, an ET experiment was designed with 40 students to assess their visual and emotional reactions to these logos/dimensions, following Aaker's (1997) BP theory. Measures of visual attention and emotional responses are incorporated, with stimuli presented in a random order to avoid biases, highlighting the importance of attention and emotions in the perception of BP. This study used ET and GSR to analyse gender-specific attention and emotional responses to tourism destination brand logos and AI-generated images. Eye-tracking precisely measured attentional focus, recording metrics like fixation duration and sequence, which revealed how different elements of the logos, each representing a dimension of brand personality, captivated and maintained viewer attention.
Simultaneously, GSR assessed arousal levels, which were highly sensitive to emotional stimulation from engaging visual or emotional content, allowing us to track the intensity of responses through changes in skin conductance. Together, these techniques provided a comprehensive view of how brand personality dimensions influence gender-specific reactions, enhancing our understanding of consumer behaviour and informing more effective marketing strategies in the tourism sector. The adoption of psychophysiological techniques has recently increased, partly due to their ability to provide real-time data (Bastiaansen et al. 2019). Furthermore, research utilising these measures can yield crucial information that cannot be acquired through conscious introspection or self-reports (Kim et al., 2014).
3.1 Eye tracking and GSR
For the selection of stimuli to be incorporated into the experiment, the sample has been delimited to those tourism destination brand logos corresponding to destinations accessible via direct flights from the city of Málaga, operated by low-cost airlines. This preselection is based on the proximity of the destinations, which present a real viability of being visited and that potentially have been or could be visited by the students of the University of Málaga in the future.
For this purpose, a selection was developed through three distinct phases. In phase 1, an exhaustive list of all available destinations and their respective destination brand logos was compiled. Subsequently, this list was organised based on the frequency of direct flights, as detailed in Table 1.
Table 1 Connections and Frequency of Direct Low-Cost Flights from Málaga
| Destination | Frequency | Airlines |
| London | 8 | Wizzair, Vueling, Easyjet, Ryanair, Jet2 |
| Stockholm | 5 | Norwegian, Ryanair, Eurowings |
| Brussels | 4 | Vueling, Ryanair, Transavia |
| Glasgow | 4 | Easyjet, Ryanair, Jet2 |
| Lyon | 4 | Volotea, Vueling, Easyjet, Transavia |
| Paris | 4 | Vueling, Transavia, Ryanair, Easyjet |
| Amsterdam | 3 | Vueling, Easyjet, Transavia |
| Berlin | 3 | Easyjet, Ryanair, Eurowings |
| Dusseldorf | 3 | Ryanair, Eurowings |
| Manchester | 3 | Easyjet, Ryanair, Jet2 |
| Oslo | 3 | Norwegian, Ryanair |
| Rome | 3 | Wizzair, Vueling, Ryanair |
Source: Own elaboration
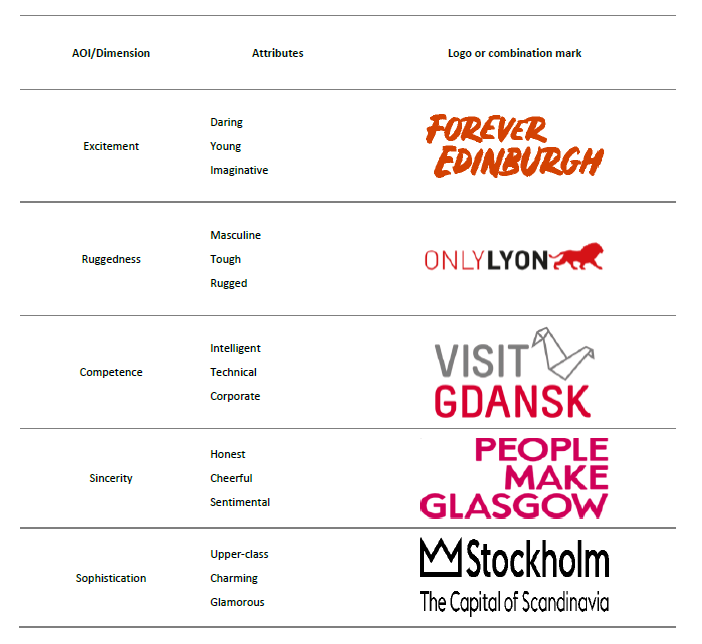
During phase 2, the selection of logos for a validation pretest began, focusing on those that, a priori, most adequately represented the dimensions of BP according to Aaker's 1997 scale, which includes Sophistication, Ruggedness, Excitement, Sincerity, and Competence. In phase 3, three pretest surveys were designed to validate the final stimuli to be used. A total of 15 logos were selected, distributed as five for each questionnaire, that is, the five dimensions across the five logos. Questionnaire A included Amsterdam, Paris, Edinburgh, Bilbao, and Gdansk; B included Palma de Mallorca, Stockholm, Manchester, Lyon, and Hamburg; and C included Glasgow, Budapest, Katowice, Berlin, and Cologne.
The pretest questions were structured using a 7-point semantic differential scale, with attributes corresponding to the aforementioned dimensions (for example, for "Sophistication": lower-class to upper-class, ungainly to charming, and plain to glamorous).
The results of the stimulus validation pretest were used to choose the tourism destination brand logos that could most consensually and faithfully represent the different dimensions of Aaker's (1997) BP (see Appendix A). Radar Chart 1 shows an example of the means obtained in the "Excitement" dimension for the Edinburgh logo, with the attribute "Young" being prominent within the same dimension.
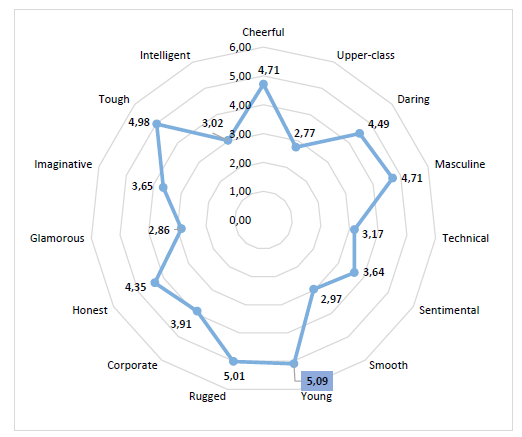
Radar chart 1 - Average results of the validation pretest for the Edinburgh logo stimulus. Source: Own elaboration
The stimulus validation test was conducted by a diverse group of 260 individuals, highlighting young students' travel preferences and behaviours. In summary, there was a significant female representation (61.65%) and a predominance of Spanish nationality (90.09%). The age distribution revealed a notable concentration of individuals born between 2001 and 2003, indicating a predominantly young population, with 72.22% of students and 22.57% combining studies and work.
In terms of travel expenditure, the majority trend is to invest between €401 and €600, with 29.25% of respondents selecting this range, followed by 26.14% spending between €200 and €400. The most common travel frequency is 2-4 times yearly (61.26%), evidencing a pronounced interest in exploring new destinations. Destination choice is primarily based on online research or consultations (59.97%) and recommendations from friends or family (29.43%), underscoring the importance of social networks and word of mouth in travel planning.
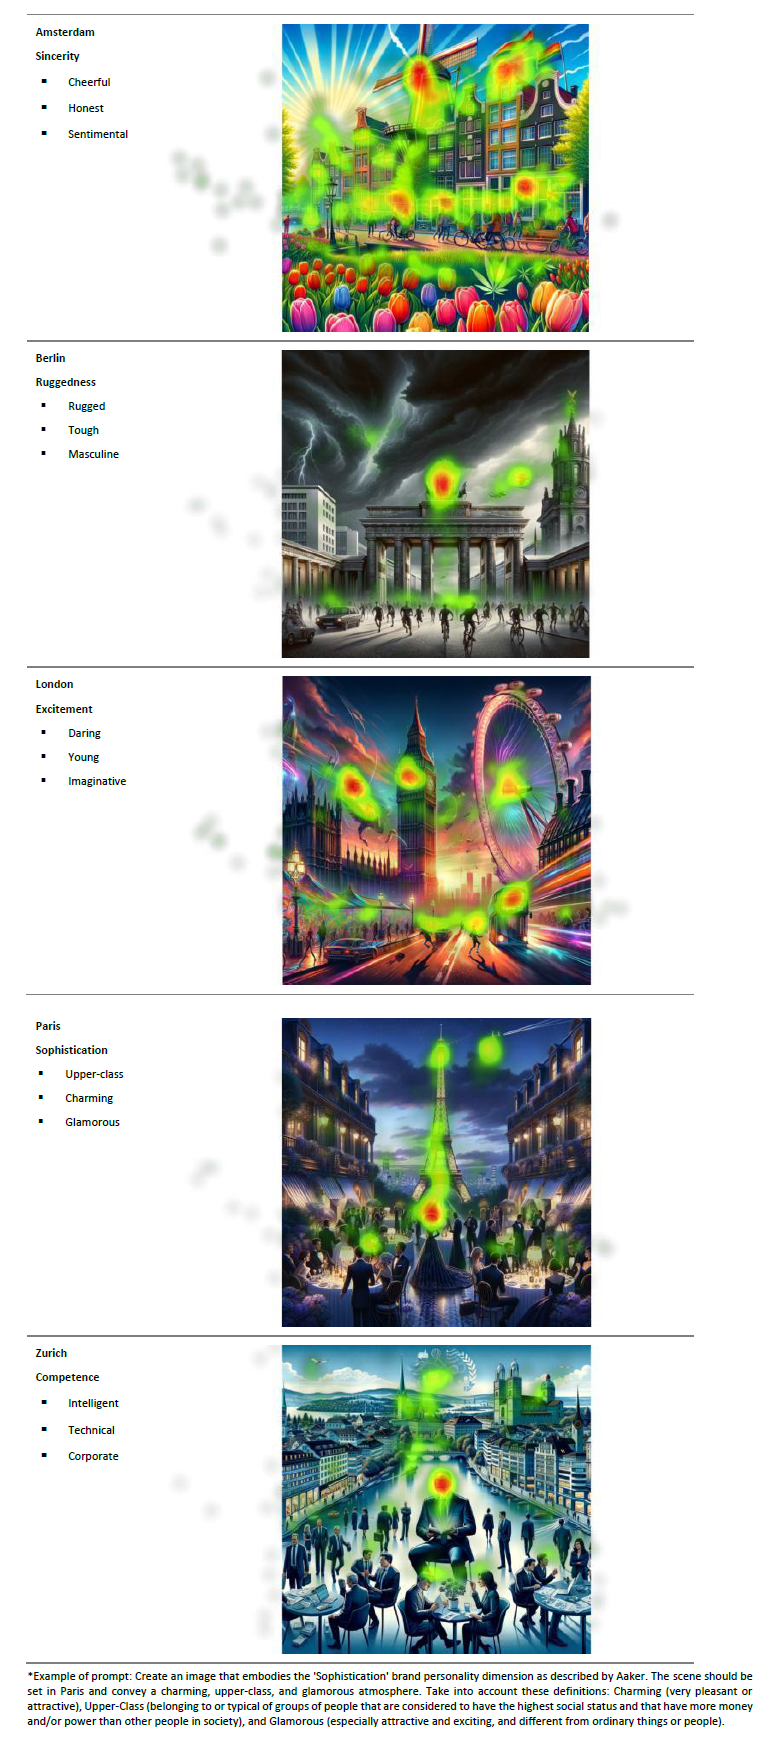
A small validation test was also conducted to select five images generated using artificial intelligence with DALL-E, which faithfully represented the five dimensions of BP in five popular destinations (Amsterdam, Paris, Berlin, London, and Zurich). For this purpose, images were generated based on prompts containing the dimensions' definitions and key attributes, as detailed in Appendix B.
3.2 Eye tracking and GSR
The study incorporated 40 university students, who were carefully selected based on their prior exposure to global cultures, with each having visited at least three foreign cities. This selection criterion was essential to ensure a broad perspective in their responses to international brands. The participants were evenly distributed by gender, with 20 males and 20 females contributing to a balanced demographic profile. The average age of the male participants was 21.5 years, while the average age for the female participants was slightly higher at 25.0 years, resulting in an overall average age of 23.25 years for the group.
The primary objective of the research was to assess these students' visual and emotional reactions to a series of corporate logos. These logos were strategically chosen to represent various dimensions of Brand Personality (BP) as proposed by Aaker in 1997, specifically focusing on Sincerity, Sophistication, Excitement, Competence, and Ruggedness. This selection aimed to explore how each dimension influences the attention and emotional response of observers, providing a basis for detailed comparisons between the characteristics associated with each logo.
The experimental procedure was divided into three essential parts, organised to facilitate a systematic comparison between the personality dimensions represented by the logos. Initially, each logo was presented individually, allowing for a detailed observation of the responses evoked by each personality dimension. This phase was followed by a direct comparison between pairs of logos, pitting the personality dimensions against each other to assess comparative reactions. The experimentation concluded with the presentation of artificial intelligence-generated images, representative of each dimension, to examine the responses in an innovative context (see Image 1). Each section was designed to maximise the collection of data on visual attention and emotional responses, incorporating strategic pauses to minimise fatigue and maintain objectivity.
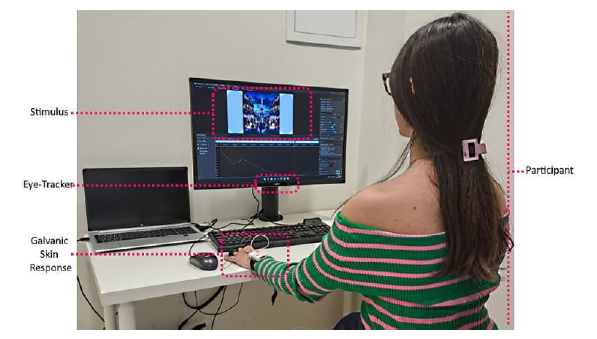
Image 1 Participant undergoing the experiment with Eye-Tracker and Galvanic Skin Response sensors to measure reactions to stimuli. Source: Own elaboration
To ensure the integrity of the study, stimuli were presented in a random order, thus avoiding any potential bias in the participants' responses. The total duration of the experiment was 450 seconds (7 minutes and 30 seconds), including all phases and rest periods.
The key indicators assessed in this study encompassed both visual metrics and the physiological responses of participants. Among these, the number of fixations was included, indicating how many times a participant's gaze stopped on specific areas, suggesting points of interest or attention. The time to first fixation informs us about the speed with which an element captures attention from the start of the presentation, while the average and total duration of these fixations offers a measure of initial and overall interest towards the presented stimuli. Furthermore, the Skin Conductance Response (SCR) amplitude to emotional stimuli was analysed, providing valuable insight into the intensity of participants' emotional reactions.
The employment of non-parametric statistical tests in our study is underpinned by the specific nature and characteristics of the collected data. Non-parametric tests such as Mann-Whitney and Wilcoxon were chosen due to the inability to assume normal distributions in the participants' responses, particularly when evaluating emotional and visual reactions to subjective stimuli like corporate logos. These data types, often ordinal or failing to meet the homogeneity of variance requirements necessary for parametric tests, call for an alternative analytical approach. Non-parametric tests offer robustness in scenarios where data distributions are unknown or likely to be non-normal due to subjective responses. Given the study's relatively small sample size and the repeated measures from the same sample, non-parametric methods provide greater flexibility and more direct interpretation. Therefore, the decision to utilise non-parametric methods is based on statistical appropriateness and robustness concerning the data characteristics, making these tests less susceptible to outliers and skewed distributions, which is crucial in psychological and emotional measurements. Despite perceptions regarding their rigour, non-parametric tests are widely recognised and accepted in behavioural and psychological research under such conditions.
The central purpose of this design was to investigate the differences in visual attention and emotional responses towards the BP dimensions represented by the selected logos, both among the dimensions themselves and the differences between genders.
Figure 1 below provides a succinct summary of the methodology employed in our study. It illustrates the comprehensive process from the initial selection of stimuli to the final execution of the eye tracking (ET) experiment, ensuring a methodological clarity that supports the findings presented.
4. Results
Aaker's (1997) Brand Personality (BP) theory provides a robust framework for interpreting these results. The exploration of emotional and visual responses towards tourism destination brand logos, embodying the dimensions of BP, has revealed significant differences. Analyses conducted through non-parametric statistical tests, such as the Mann-Whitney U test and the Wilcoxon test, have uncovered variations in attention and initial reaction between genders and among the dimensions.
4.1 Sophistication vs Sincerity (Stockholm vs Glasgow)
Two of the dimensions that show significant differences between each other are "Sophistication" represented by the Stockholm logo and "Sincerity" represented by the Glasgow logo.
The application of the Mann-Whitney U test reveals that there are significant differences in how genders visually process logos associated with "Sophistication" and "Sincerity". The statistical significance (as seen in Table 2) in measures such as "time to first fixation (p=0.043)", "number of fixations (p=0.003)", or "total fixation duration (p=0.009)" suggests that BP exerts a notable influence on the speed and depth with which visual stimuli are processed, reflecting a distinct emotional or cognitive resonance with the values that each dimension represents.
Table 2 Significant results with independent samples: sophistication vs sincerity
| Technique | Group | Hypothesis testing | Parameter | Statistic | P | AOI/Dimension vs Dimension | Logo or combination mark representation |
| Eye-tracking | Masculine vs Feminine | Mann-Whitney U | Time to the first fixation | 125 | 0.043** | Sophistication vs Sincerity | Stockholm vs Glasgow |
| Number of fixations | 91 | 0.003*** | |||||
| The average duration in the first fixation | 125 | 0.043** | |||||
| The total duration of fixation | 104 | 0.009** |
** p < .05, *** p < .005. Source: Own elaboration based on statistical software data
Differences in visual attention and emotional response can be understood through how individuals project their identities and aspirations onto the brands they choose. According to self-categorisation theory (Turner & Onorato, 2014), individuals are drawn to brands that reflect or complement their self-concept. Therefore, the observed differences could reflect variations in how the values associated with "Sophistication" and "Sincerity" align with gender self-perception and cultural norms.
Furthermore, the self-image congruity theory (Sirgy, 1982) suggests that consumers prefer products and brands that are congruent with their ideal image. This could explain why certain BP dimensions capture attention more quickly and elicit stronger emotional responses, as individuals react not only to the logo's aesthetics but also to what the logo represents about themselves and their values.
In the analysis of the "time to first fixation" metric in the comparison between Sophistication vs Sincerity segmented by gender, it is observed that, on average, time to first fixation is shorter in women than in men (see Figure 2). Specifically, the average duration to first fixation recorded for the female gender is 209.3 milliseconds, in contrast to the 254.8 milliseconds average observed for the male gender. These results suggest a predisposition of the female gender to direct their attention more immediately towards logos that evoke the dimensions of "Sophistication", indicating a possible differential resonance with these BP attributes according to gender.
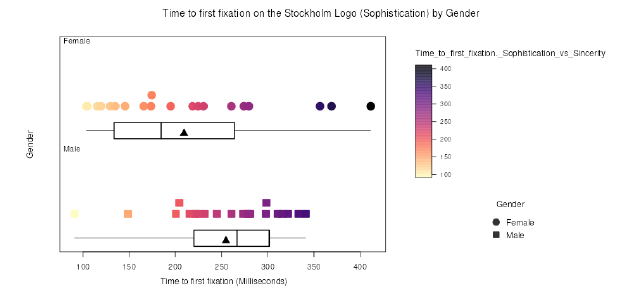
Figure 2 Time to the first fixation on Stockholm. Source: Own elaboration based on statistical software data
In the analysis of the variable "Number of fixations in the comparison between Sophistication vs Sincerity", differences in visual fixation behaviour between genders were also observed. Women displayed a broader range in the number of fixations, with a minimum of 6 and a maximum of 31, and an average of 17.45 fixations, indicating a tendency to inspect these logos more thoroughly or for a longer period (Table 3). The standard deviation within the female group was 7.112, reflecting some variability in their fixation behaviour. However, men showed a minimum of 1 fixation and a maximum of 29, with an average of 14.70 fixations. The standard deviation in this group was 7.399, also indicating a comparable variability in fixation behaviour among male individuals. These differences suggest a greater inclination by women to devote attention to the visual elements of logos representing "Sophistication" (Stockholm) compared to men. This pattern could indicate variations in attention or interest generated by the characteristics associated with each tourism destination brand logo according to gender.
Table 3 Significant results with independent samples: Sincerity
| Technique | Groups | Hypothesis testing | Parameter | Statistic | P | AOI/Dimension | Logo or combination mark representation |
| Eye-tracking | Masculine vs Feminine | Mann-Whitney U | Number of fixations | 115.5 | 0.023** | Sincerity | Glasgow |
| The average duration in the first fixation | 91 | 0.003*** | |||||
| The total duration of fixation | 114 | 0.020** | |||||
| SCR- galvanic response | Masculine vs Feminine | Mann-Whitney U | ER SCR Amplitude | 151 | 0.048** |
** p < .05, *** p < .005. Source: Own elaboration based on statistical software data
The significant differences achieved through the Mann-Whitney U test shown in Table 3 also suggest that the data should be analysed more deeply. On the one hand, women not only exhibited a higher number of fixations, with an average of 25.65 and a wider interquartile range (IQR) (Figure 3), but they also demonstrated a more varied and intense attention to the logo. This trend suggests a more detailed exploration and a heightened affinity towards the values of authenticity, warmth, and reliability that 'Sincerity' suggests, reflecting a gender-based preference or differential valuation. On the other hand, men displayed a more consistent but less intense attention pattern towards the Glasgow logo, with an average of 19.75 fixations and a narrower IQR. The disparity in both the number of fixations and the total duration of these, indicated by the standard deviations (Women = 8.074, Men = 7.383), not only underscores sustained interest and attention but also a deeper focus on the logo that represents the values of 'Sincerity'. These differences highlight how gender can influence the attention and processing of values transmitted through the tourism destination brand logo, indicating differentiated attention that possibly reflects a distinct emotional or evaluative resonance with the BP attributes.
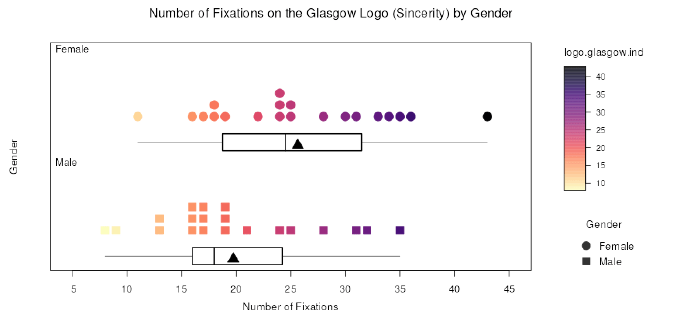
Figure 3 Number of first fixation on Glasgow. Source: Own elaboration based on statistical software data
The heat map in Figure 4 illustrates a notable difference in the intensity of attention between the logos of Stockholm and Glasgow, each representative of the BP dimensions: sophistication and sincerity, respectively. The intensity of the heat map over the Stockholm logo suggests that the design elements capture attention in a more dispersed manner, which may indicate that the brand's sophistication requires more complex cognitive processing or invites a more detailed evaluation. In contrast, the greater concentration of attention in the centre of the Glasgow logo reflects more direct communication and possibly more effective transmission of sincerity as a brand value. This focused response could indicate that sincerity is an attribute more immediately recognisable or valued by consumers. The distribution and intensity of the colours on the heat map may be clear indications of attractiveness or interest with the viewers, which in turn could reflect the effectiveness with which each logo communicates its respective BP dimensions.

Figure 4 Heat map of two dimensions: Sophistication (Stockholm) vs. Sincerity (Glasgow). Source: Tobii Pro Lab software
The significant difference in the amplitude of the SCR response (SCR Amplitude ER (p=0.048 for "Sophistication" and p=0.02 for "Sincerity"), according to the Mann-Whitney U test shown in Table 4, indicates a distinct physiological reaction to the logos, evidencing an underlying emotional activation. The greater amplitude in response to "Sophistication" might suggest that this dimension elicits a more intense emotional response, possibly due to the perception of exclusivity, elegance, and prestige associated with it. The self-congruity theory (Sirgy, 1982), which suggests that consumers are more drawn to brands whose personality aligns with their own self-image or aspirations, supports this. Moreover, based on the theory of visual information processing (Turvey, 1977; Neisser, 2014), the attributes associated with "Sophistication" could require more complex cognitive processing, reflected in a longer fixation duration and a more intense SCR response, whereas "Sincerity" might evoke a more immediate and direct emotional connection, leading to a greater number of fixations. This dichotomy between sophistication and sincerity illustrates how consumers, influenced by their gender and associated cultural norms, may tend to identify and emotionally connect with brands that reflect or complement their self-concept.
Table 4 Significant Results in SCR with independent samples: Sincerity and Sophistication
| Technique | Groups | Hypothesis testing | Parameter | Statistic | P | AOI/Dimension | Logo or combination mark |
| SCR- galvanic response | Masculine vs Feminine | Mann-Whitney U | ER SCR Amplitude | 151 | 0.048** | Sincerity | Glasgow |
| 150 | 0.02** | Sophistication | Stockholm |
** p < .05, *** p < .005. Source: Own elaboration based on statistical software data
4.2 Excitement vs Ruggedness/Competence (Edinburgh vs Lyon/Gdansk)
Applying the Mann-Whitney U test again to analyse gender differences (male and female) in the reaction to logos representing the BP dimensions "Excitement" versus "Ruggedness" for Edinburgh and Lyon, and "Excitement" versus "Competence" for Edinburgh and Gdansk, reveals statistically significant findings that shed light on how BP influences the initial perception and reaction of men and women.
The test shows significant differences (see Table 5) in how genders visually process the logos associated with "Excitement" in comparison to "Ruggedness" and "Competence", with significance levels of p=0.008 and p=0.006, respectively, for the number of fixations. This indicates a differentiated attention towards the logos representing these BP dimensions. Moreover, the average duration in the first fixation presents values of p=0.047 and p=0.013, respectively, suggesting variations in the speed at which visual processing of these stimuli begins. The total duration of fixation, with a value of p=0.026, points to a divergence in the total time dedicated to examining the logos, suggesting that the BP dimensions "Excitement", associated with Edinburgh, and "Ruggedness" and "Competence", associated with Lyon and Gdansk respectively, significantly influence the depth of visual processing. This analysis allows a deep dive into consumer psychology, applying social psychology, marketing, and visual attention theories to interpret the results.
Table 5 Significant results with independent samples: Excitement vs Ruggedness and Excitement vs Competence
| Technique | Groups | Hypothesis testing | Parameter | Statistic | P | AOI/Dimension | Logo or combination mark representation |
| Eye-tracking | Masculine vs Feminine | Mann-Whitney U | Number of fixations | 95.5 | 0.008** | Excitement vs Ruggedness | Edinburgh vs Lyon |
| The average duration in the first fixation | 119 | 0.047** | |||||
| The total duration of fixation | 111 | 0.026** | |||||
| Number of fixations | 98.5 | 0.006** | Excitement vs Competence | Edinburgh vs Gdansk |
** p < .05, *** p < .005. Source: Own elaboration based on statistical software data
The intensity of the fixations on the image of the lion seen in Figure 5 suggests that this symbol significantly captures the attention of viewers, which can be justified by its symbolic charge and visual relevance. From the perspective of the optimal arousal theory (Hebb, 1955), the image of the lion could provoke an optimal level of activation that attracts and retains the viewer's attention. As a symbol of strength and power, the lion embodies the essence of "Ruggedness" and could evoke an instinctive response due to its cultural association with bravery and robustness.
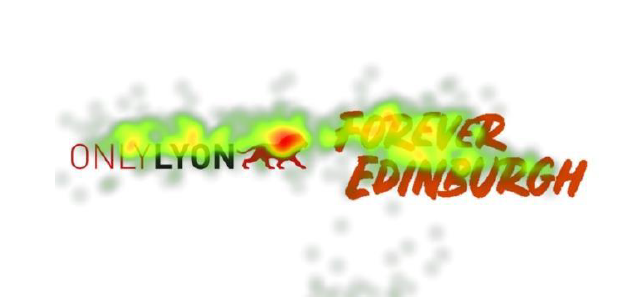
Figure 5 Heat map of two dimensions: Ruggedness (Lyon) vs. Excitement (Edinburgh). Source: Tobii Pro Lab software
Furthermore, the logo's visual prominence of the lion's head reflects key principles of embodied cognition (Lakoff, 2012), where visual representations that directly connect to human sensory and emotional experiences tend to be processed more deeply. In this case, the lion as an embodied image attracts an emotional response that may be more immediate and visceral, which is consistent with its visual appeal and cultural symbolism.
On the other hand, the Edinburgh logo, representing "Excitement", does not possess an equally distinctive and evocative symbol, and consequently, the same intensity in the ET response. This could explain the lesser presence of intense red areas compared to the Lyon logo, suggesting that while "Excitement" is an attractive quality, it may not compete with the direct visual impact of a powerful image like that of a lion. This analysis reveals how the inclusion of strong and culturally resonant graphic elements in a logo can significantly affect the viewer's attention and emotional connection to the BP dimensions.
4.3 Ruggedness vs Sophistication (Lyon vs Stockholm)
The Mann-Whitney U statistical test yielded a p-value of 0.019, indicating that there is a statistically significant difference in the visual attention that men and women pay to the Lyon logo represented by the Ruggedness dimension. A substantially higher average of fixations was recorded in male subjects (14.75) compared to female participants (10.40) (see Figure 6).
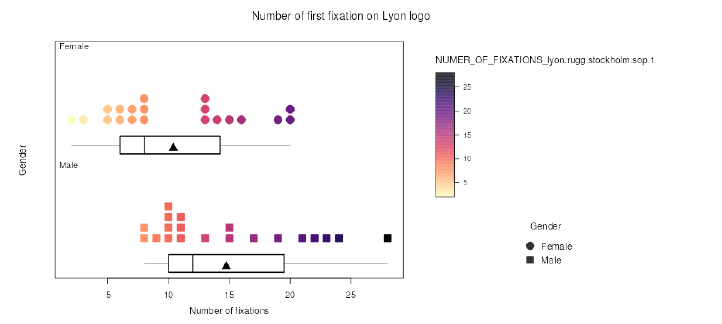
Figure 6 Number of first fixations on Lyon. Source: Own elaboration based on statistical software data
From the perspective of gender identity as proposed by Money (1985), interpretations in marketing (Hogg & Garrow, 2003), and the gender schema theory of Bem (1984), it is plausible to suggest that there is a greater identification of men with the attributes of "Ruggedness". This identification is potentially reinforced by the symbolism of the lion (see Figure 7), which culturally embodies strength and boldness, traditionally aligned with masculinity. According to this theory, consumer preferences are partly driven by the congruence between gender self-perception and brand image, which may result in a more intensive visual focus towards representations that reinforce one's gender identity (Starr & Zurbriggen, 2017). In line with the optimal arousal theory (Hebb, 1955; Wirtz et al., 2007), the emblematic figure of the lion could constitute a more powerful stimulus of activation for the male gender, capturing and holding their attention through a level of arousal congruent with an optimal state of alertness. This mechanism aligns with the notion that certain stimuli, by their nature or symbolic meaning, exert a more pronounced effect on the focusing and maintenance of attention.
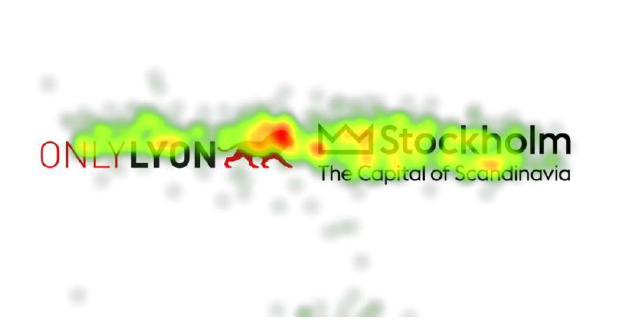
Figure 7 Heat map of two dimensions: Ruggedness (Lyon) vs. Sophistication (Stockholm). Source: Tobii Pro Lab software
Furthermore, applying the self-congruity theory (Sirgy, 1982), it could be inferred that men find a stronger alignment between their self-concept and the values projected by the logo. This identification phenomenon could influence the attraction to the brand, manifesting in increased visual attention. Embodied cognition (Lakoff, 2012) provides another layer of interpretation by suggesting that our cognitive responses are deeply rooted in bodily physical and sensory experiences. As a representation of power and strength, the lion might resonate more profoundly with men, evoking a more pronounced response due to the connection with personal and cultural experiences associated with these attributes (see Table 6).
Table 6 Significant results with independent samples: Ruggedness vs Sophistication
| Technique | Groups | Hypothesis testing | Parameter | Statistic | P | AOI/Dimension | Logo or combination mark |
| Eye-tracking | Masculine vs Feminine | Mann-Whitney U | Number of fixations | 106 | 0.019** | Ruggedness vs Sophistication | Lyon vs Stockholm |
** p < .05, *** p < .005. Source: Own elaboration based on statistical software data
4.4 Sophistication vs Competence (Stockholm vs Gdansk)
The analysis also shows significant differences in the visual interaction of participants with the logos of Stockholm and Gdansk, which are representative of the "Sophistication" and "Competence" dimensions, respectively. The statistical values (see Table 7) indicate a higher average number of fixations on the Stockholm logo (27.27) compared to Gdansk (21.82), with a p-value of < .001, and a longer average duration of the first fixation for Gdansk (0.4597 seconds) in relation to Stockholm (0.3187 seconds), with a p-value of 0.005.
Table 7 Significant results with the same group: Sophistication vs Competence
| Technique | Groups | Hypothesis testing | Parameter | Statistic | P | AOI/Dimension vs Dimension | Logo or combination mark |
| Eye-tracking | Same group | Wilcoxon | Number of fixations | 137 | < .001*** | Sophistication vs Competence | Stockholm vs Gdansk |
| The average duration in the first fixation | 615 | 0.005** |
** p < .05, *** p < .005. Source: Own elaboration based on statistical software data
These results can again be interpreted under the light of the optimal arousal theory (Hebb, 1955; Wirtz et al., 2007), suggesting that the Stockholm logo may have reached a level of arousal resulting in a higher number of fixations (see Figure 8), which could be attributed to a visual aesthetic that harmonises with the idea of "Sophistication". The Gdansk logo, although resulting in less frequent fixations, retains attention for longer periods during the first fixation, which could be interpreted as an indication of deeper cognitive processing associated with "Competence". Embodied cognition (Lakoff, 2012) could offer an additional perspective on how participants are experiencing these logos. While "Sophistication" might resonate more with aesthetic experiences or status, evoking quicker but perhaps more superficial attention, "Competence" may require a more thorough and reflective analysis, reflected in a longer duration of the first fixation. Finally, self-congruity (Sirgy, 1982) suggests that the personal aspirations or ideal self-concept of the participants might make "Sophistication" more attractive at first glance, leading to a higher number of initial fixations. On the other hand, "Competence" may resonate on a deeper level, possibly related to the consumer's internal evaluation of reliability and effectiveness, manifesting in more sustained though less frequent attention.
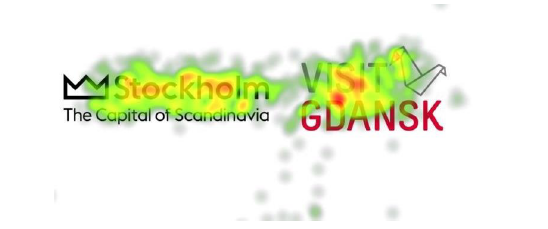
Figure 8 Heat map of two dimensions: Sophistication (Stockholm) vs. Competence (Gdansk). Source: Tobii Pro Lab software
On the other hand, based on the Information Processing Theory (Miller, 1956), it is suggested that the higher number of fixations on the Stockholm logo could be due to its sophisticated design containing subtle elements, such as the crown or the twist in the letter “f” that require more detailed analysis to be fully processed, highlighting the depth and luxury associated with sophistication. This could align with the Marketing Aesthetics Theory (Bloch, 1995), where the visual and aesthetic appeal inherent to the sophistication dimension could explain why participants devoted more time in their first fixation to the Stockholm logo, as they tend to be drawn towards designs they perceive as beautiful or luxurious. And with the Visual Persuasion Theory (Meyers-Levy & Peracchio, 1995), which could explain how the design of the Stockholm logo, by communicating quality and exclusivity through its complexity or visual space, requires greater attention from viewers to be fully appreciated and understood.
4.5 Sophistication vs Excitement (Stockholm vs Edinburgh)
As summarised in Table 8, there is a statistically significant difference (p < .001) in the number of fixations between the logos, indicating a clear divergence in the level of visual attention attracted by each BP dimension. This suggests that sophistication, represented by the Stockholm logo with an average of 27.27 fixations, captures more visual attention compared to excitement, represented by the Edinburgh logo with an average of 21.73 fixations. Furthermore, the average duration of the first fixation remains significantly longer for the logo associated with excitement (p = 0.007), with an average duration of 0.4352 seconds, in contrast to 0.1826 seconds for sophistication.
Table 8 Significant results with the same group: Sophistication vs Excitement
| Technique | Groups | Hypothesis testing | Parameter | Statistic | P | AOI/Dimension vs Dimension | Logo or combination mark |
| Eye-tracking | Same group | Wilcoxon | Number of fixations | 278 | < .001*** | Sophistication vs Excitement | Stockholm vs Edinburgh |
| The average duration in the first fixation | 607 | 0.007** |
** p < .05, *** p < .005. Source: Own elaboration based on statistical software data
From a psychological and marketing perspective, the significant difference in the number of fixations reinforces the idea that the attributes of sophistication possess a particular ability to capture and hold visual attention, possibly due to their association with aesthetic qualities and an air of exclusivity. This ability to attract more fixations could reflect a greater cognitive load associated with the processing and appreciation of sophistication. Although we did not directly assess working memory capacity in this study, the increased number of fixations suggests greater cognitive effort, aligning with the general principles of Sweller’s Cognitive Load Theory (1988).
On the other hand, the longer duration of the first fixation on logos associated with “excitement” suggests deeper initial processing or a higher level of attention with these stimuli. Based on Petty and Cacioppo's (1986) Elaboration Likelihood Model, this finding could indicate that excitement fosters a more elaborate evaluation than sophistication, possibly due to its dynamic and stimulating nature.
4.6 GSR Artificial Intelligence
The analysis of the GSR to images generated by artificial intelligence representing each dimension (see Appendix C) reveals significant differences in the emotional and physiological reaction between genders (see Figure 9). In the female group, GSR measurements range from 0.0480 to 8.793, reflecting a wide variability in responses, with an average of 0.9741 and a notable standard deviation of 1.911. This variability suggests that, although most responses are moderate, there are cases of extremely high reactions. In contrast, the male group shows a GSR range of 0.3958 to 8.599, with a significantly higher average of 2.3504 and a standard deviation of 1.918. This indicates that, on average, men exhibit a higher physiological activation to the same stimuli, with minimum responses higher than the lowest observed in women and a general trend towards higher galvanic responses. Both groups exhibit a wide dispersion of reactions, highlighting the heterogeneity in the attention and emotional response to AI-generated content, in addition to underlining how gender differences can influence interaction with advanced technologies.
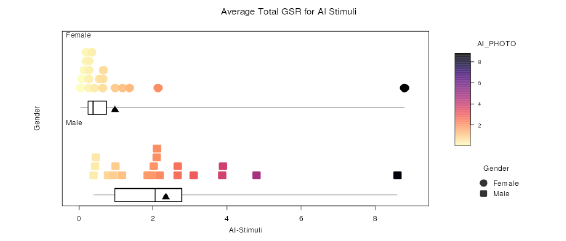
Figure 9 Average total GSR for AI Stimuli. Source: Own elaboration based on statistical software data.
On the other hand, reactions to AI-generated images are analysed, observing distinct patterns of attention and emotional response according to different evaluated dimensions: sincerity, sophistication, ruggedness, and excitement. Specifically, the sincerity dimension exhibits a distinct reaction pattern compared to the dimensions of sophistication, ruggedness, and excitement, as demonstrated by the number of fixations and the average duration of the first fixation, details of which are provided in Table 9. Notably, the excitement dimension significantly differs from ruggedness, particularly regarding the SCR.
Table 9 Significant results with the same group: Sophistication vs Excitement
| Technique | Groups | Hypothesis testing | Parameter | Statistic | P | AOI/Dimension | AI-photo |
| Eye-tracking | Masculine vs Feminine | Mann-Whitney U | Duration of the first fixation | 102 | 0.008** | Ruggedness | Berlin |
| Eye-tracking | Same group | Wilcoxon | Number of fixations | 559 | 0.006** | Sincerity vs Ruggedness | Amsterdam vs Berlin |
| 552 | 0.024** | Sincerity vs Sophistication | Amsterdam vs Paris | ||||
| 557 | 0.007** | Sincerity vs Excitement | Amsterdam vs London | ||||
| The average duration in the first fixation | 230 | 0.015** | Sincerity vs Ruggedness | Amsterdam vs Berlin | |||
| 212 | 0.007** | Sincerity vs Sophistication | Amsterdam vs Paris | ||||
| 218 | 0.009** | Sincerity vs Excitement | Amsterdam vs London | ||||
| SCR- galvanic response | Same group | Wilcoxon | ER SCR Amplitude | 42 | 0.024** | Excitement vs Ruggedness | London vs Berlin |
** p < .05, *** p < .005. Source: Own elaboration based on statistical software data
Relevant results obtained for the same study group indicate notable differences when comparing the dimensions of sophistication and excitement, both in ocular reactions through ET and emotional responses. The evaluation of the duration of the first fixation revealed a statistically significant difference in the attention of ruggedness between male and female participants, with a p-value of 0.008 in the Berlin images.
The application of the Wilcoxon test to analyse intragroup differences highlighted that the sincerity dimension, compared to those of ruggedness, sophistication, and excitement, generates significant differences both in the number of fixations and the average duration of the first fixation, in the comparisons between Amsterdam with Berlin, Paris, and London, respectively. The p-values range from 0.006 to 0.024, highlighting a differentiated focus and initial reaction towards the sincerity dimension compared to the other dimensions evaluated.
Additionally, concerning SCR, the contrast between the dimensions of excitement and ruggedness between London and Berlin shows a significant difference, with a p-value of 0.024, indicating a distinctive emotional response when contrasting these two dimensions.
The findings of this study suggest that both attention and emotional response to AI-generated images vary significantly depending on the dimension represented, identifying sincerity with a unique response pattern compared to the other dimensions evaluated and highlighting excitement for its prominence in terms of emotional response in contrast to ruggedness.
5.Discussion
The integration of neurotourism techniques such as ET and GSR in the study of BP in the tourism context offers a revolutionary perspective on how consumers perceive and react to tourism destination brand logos and AI-generated images. This pioneering approach, inspired by the sparse existing literature on the subject, particularly Lourenção et al. (2020), and based on the BP construct proposed by Aaker (1997), underscores the importance of the dimensions of sincerity, excitement, sophistication, competence, and ruggedness in shaping destination image and influencing consumer behaviour (Ekinci & Hosany, 2006; Papadimitriou et al., 2015; Baloglu et al., 2014; Hultman et al., 2015).
The findings of this study corroborate and expand previous understanding of BP, demonstrating how gender differences influence attention and emotional response towards tourism destination brand logos representing these key dimensions. This distinction highlights the relevance of self-image congruity theory (Sirgy, 1982) and self-categorisation theory (Turner et al., 1987), suggesting that the alignment between a destination's BP and consumers' self-perception may be a critical determinant in their attraction and loyalty to the destination. Traditional methods of measuring affective states, such as surveys and questionnaires, often fall short in capturing the complexity of tourist experiences due to their subjective nature and susceptibility to biases (Ziegel et al., 1998; Schwarz, 1999). In contrast, ET and GSR provide objective and precise measurements of visual attention and emotional arousal, respectively. ET tracks where and for how long a participant looks at different elements of a logo, while GSR measures physiological responses that indicate emotional activation.
Previous research has shown that destination image and BP are interrelated yet distinct concepts. The destination image encompasses both cognitive and affective aspects, shaping tourists' overall perception of a place (Baloglu et al., 2014; Chen & Phou, 2013). In contrast, BP uses human personality traits to describe the destination, providing an emotional and symbolic framework that complements its physical and tangible characteristics (Ekinci & Hosany, 2006). Studies by Hosany et al. (2006), Murphy et al. (2007), and Prayag (2007) have demonstrated how BP influences consumer perception, satisfaction, and visitation intent, underscoring the relevance of BP in tourism marketing strategies.
Our research supports these findings by demonstrating that the BP dimensions, particularly sincerity, excitement, and sophistication, significantly influence tourists' attention and emotional responses. This is consistent with the work of Jalilvand et al. (2012) and Qu et al. (2011), who found that a well-defined and attractive BP enhances tourists' intention to visit and loyalty to the destination.
The use of ET and GSR techniques in this study has provided a more accurate and objective assessment of the interaction between consumers and the brand's visual elements, avoiding the biases and validity issues associated with self-report instruments (Scott et al., 2020; Schwarz, 1999). This aligns with the argument by Kotsi et al. (2018) that neuroscience offers a promising field to reveal the direct and unconscious reactions of consumers towards brands.
Furthermore, the GSR analysis of AI-generated images representing BP dimensions has shown significant differences in emotional activation between genders. This finding underscores the importance of considering gender differences in designing marketing strategies and visual communications that seek to resonate with a broader audience (Ekinci et al., 2013; Smith et al., 2015).
The coherence between brand personality and destination image contributes to a clearer and stronger perception of the destination (Ekinci & Hosany, 2006). Marketing campaigns that highlight BP can enhance the destination image by emphasising emotional and symbolic attributes that attract tourists (Pike et al., 2010). This is particularly important as tourists are more likely to consider destinations with an attractive BP and a positive image, as these destinations appear to offer more rewarding experiences (Jalilvand et al., 2012).
5.1 Theoretical Implications
This study theoretically contributes to the emerging field of neurotourism by integrating ET and GSR technologies to explore the impact of tourism destination brand logos and AI-generated images on consumer perception and attention. By applying these neuroscientific methods, our research offers novel insights into the complex interaction between visual stimuli and the Brand Personality (BP) dimensions conceptualised by Aaker (1997): sincerity, excitement, sophistication, competence, and ruggedness. Significantly, it underscores differentiated processing and emotional responses by gender towards these BP dimensions, suggesting nuanced strategies for targeted marketing.
Furthermore, this research extends the theoretical framework of BP in the tourism context by demonstrating the applicability of neuroscientific methods to assess the emotional and cognitive bases of tourism destination brand logos effectiveness. It enriches the academic discourse on BP by providing empirical evidence of how specific visual elements of logos resonate with or diverge from perceived BP traits, thus influencing consumer attitudes and behaviours.
Additionally, by highlighting the different emotional and attentional responses elicited by logos and AI images, the study extends the boundaries of traditional marketing research methodologies. It advocates for a more interdisciplinary approach, combining insights from psychology, marketing, and neuroscience, to better understand the subtleties of consumer-brand interactions in the digital era. This work paves the way for future research on the strategic use of neuroscientific methods to enhance the design and communication of BPs in tourism and beyond.
5.2 Practical Implications
The implementation of advanced neuroscientific methods in this study allows for a more accurate and objective assessment of visual and emotional responses, overcoming the limitations of traditional methods based on self-reports. This methodology provides a solid foundation for the development of more personalised and effective tourism marketing strategies by offering valuable insights into the effectiveness of brand visual elements in communicating their core values.
Furthermore, this study sheds light on the practical applications of these techniques in logo design and brand strategies. By identifying specific attention patterns and emotional responses associated with different BP dimensions, marketing professionals can optimise the visual presentation of destinations to enhance the tourist experience and promote destination choice. The research also offers guidance for creating visual content that effectively aligns BP dimensions with the values and aspirations of the target audience.
This study not only validates the influence of BP dimensions on consumer behaviour but also emphasises the importance of integrating neuroscientific methods into the research of BP and the perception of tourism destination brand logos. The originality of the approach, along with the significant findings, advances our theoretical understanding and has profound practical implications for tourism marketing and destination management. By exploring the complexities of visual and emotional interaction with tourism destination brand logos, this study paves the way towards more effective and consumer-focused branding and marketing strategies, highlighting the need for visual communication that authentically resonates with the expectations and preferences of the target audience. The integration of consumer psychology and neuroscientific insights into logo design and brand strategies underscores the value of creating more meaningful and lasting connections with the target audience, paving the way for a future where neurotourism plays a crucial role in the evolution of tourism marketing.
6. Conclusions
Research on emotional and visual responses to tourism destination brand logos, incorporating the BP dimensions proposed by Aaker, has uncovered significant differences in perception and initial reaction between genders. Through the use of non-parametric statistical analyses, such as the Mann-Whitney U test and the Wilcoxon test, variations in how individuals of different genders process and respond to the attributes associated with certain cities have been identified. These differences highlight the complex interplay between self-perception, aspirations, and cultural norms, particularly in how the logos of Stockholm and Glasgow are perceived and valued. The distinct alignment of brand values with observers' ideal self-image resonates with self-image congruity theory and self-categorisation theory, underlining how "Sophistication" and "Sincerity" evoke a gender-specific emotional or cognitive resonance. This resonance is evidenced in measures such as time to first fixation, the number of fixations, and total fixation duration, emphasising the importance of considering gender differences in marketing and logo design.
Integrating these statistically significant findings broadens our understanding of how certain BP dimensions can influence attention capture and retention and elicit differentiated emotional responses. Moreover, from a neuroscientific perspective, variations in the number of fixations between men and women may reflect intrinsic differences in the neurological processes involved in visual and symbolic perception. In this regard, elements of "Sophistication" and "Excitement" stimulate the brain areas associated with emotional and visual activation differently, which may have implications for logo design and brand strategies that effectively communicate desired personality dimensions and align with the expectations and values of the target audience.
This study emphasises the relevance of employing techniques such as ET to gain insights into the effectiveness of brand visual elements in communicating their core values, revealing the potential of these tools to measure visual attention objectively. A logo's ability to attract attention and foster a deep emotional connection can significantly impact brand perception and consumer loyalty, highlighting the importance of carefully aligning the brand's visual presentation with desired communication and perception objectives.
7. Limitations and future research directions
Despite the significant findings and contributions of this study to the field of neurotourism and the understanding of emotional responses to brand stimuli, certain limitations need to be acknowledged, paving the way for future research. A key limitation arises from the geographical and demographic focus, as the study centred exclusively on participants and destinations accessible from Málaga, Spain. This focus suggests that specific cultural factors might influence the results, limiting their generalisation to other contexts or populations. Future research could benefit from replicating the study in different geographical and cultural settings to examine the universality of the findings.
Moreover, this study concentrated exclusively on visual and emotional responses measurable through ET and GSR, without considering other psychological or social factors that might influence the perception and reaction towards tourism destination brand logos. As AI technology continues to evolve, future research would benefit from exploring how differences in the perception of authenticity and the quality of AI-generated stimuli affect consumer response.
Finally, this study broke new ground by integrating neuroscientific methods into the research of tourism BP, yet much remains to be explored regarding how different combinations of stimuli (visual, auditory, tactile) might interact to influence consumer perception and behaviour. Future research could adopt a multimodal approach to examine how a combination of stimuli affects the overall consumer experience.
Credit author statement
Víctor Calderón-Fajardo: Conceptualization, Data curation, Formal analysis, Investigation, Methodology, Writing - original draft, Writing - review & editing. Rafael Anaya-Sánchez: Investigation, Methodology, Writing - review & editing. Francisco Rejón-Guardia: Investigation, Methodology, Writing - review & editing. Sebastian Molinillo: Funding acquisition, Project administration, Resources, Supervision, Writing - review & editing.


