INTRODUCTION
Because improving the maximal running velocity is important in many sports, various types of running training have been incorporated (Gajer, Thepaut-Mathieu, & Lehenaff, 1999; Mackala, 2007). For example, resistance training is a popular method supported by many reports on its effectiveness (Lockie, Murphy, Schultz, Knight, & Janse de Jonge, 2012; Young, Benton, & Pryor, 2001). One such training is the resisted sled sprint (RSS), in which a sled is pulled behind the athlete by a belt wrapped around their waist; this has been incorporated into several sports such as track and field, soccer, and rugby (Morin et al., 2017; Spinks, Murphy, Spinks, & Lockie, 2007; Tillaar, Teixeira, & Marinho, 2018). Furthermore, as the load of the RSS can be easily adjusted using the weights mounted on the sled, it can be performed at a load that suits the user. The loads used in studies reporting the effects of RSS training vary widely, ranging from light to heavy (Alcaraz, Carlos-Vivas, Oponjuru, & Martínez-Rodríguez, 2018; Grazioli et al., 2023; Morin et al., 2017). Although previous studies have reported the effects of RSS training using a variety of loads, few have analysed kinematics during RSS (Kawamori, Newton, & Nosaka, 2014; Morin et al., 2017; Spinks et al., 2007).
Some studies have reported that kinematics change during RSS compared to those during normal no-resistance running, and the overall running velocity, step frequency, and step length decrease (Lockie, Murphy, & Spinks, 2003; Martínez-Valencia et al., 2015; Zabaloy et al., 2022). Although the resisted loads in these studies ranged from 10 to 60% of body mass (BM), several reports have confirmed training effects at higher loads such as 80% and 150%BM (Morin et al., 2017; Winwood, Posthumus, Cronin, & Keogh, 2016). However, the existing literature lacks evidence about these effects with loads > 60%BM. Furthermore, to the best of our knowledge, there have been no reports in which the running distance during RSS was divided into several phases and changes in indices between phases were analysed. The physical training effect depends on load, repetitions, intensity, and duration (Haff & Triplett, 2016). Namely, dividing the certain-distance RSS into several running distances (phases) and clarifying the kinematic changes for each phase should provide useful knowledge when considering RSS training.
Theoretically, when ground surfaces are unified, the frictional resistance (F) acting on an object is proportional to the normal force (N) or weight (kg) of the object (Cross et al., 2017). Thus, the heavier the sled, the greater the force required to move it. In sports training, because running distance is determined according to its objectives, understanding the changes in kinematics during RSS could provide useful information for creating training workouts. Therefore, this study aimed to examine the effects of load differences on running velocity, step frequency, and step length during RSS in trained collegiate track and field athletes. We hypothesised that the running velocity would decrease in each phase and that the step frequency and step length would change when RSS loads were increased up to 80%BM.
METHODS
Participants
Twenty-one male athletes (height= 1.75± 0.05 m; BM= 67.6± 4.9 kg, age= 20.6± 1.3 years), including 13 short-distance sprinters and eight decathletes participated in the study; they were all members of the university track and field team (Tier 2 in McKay et al., 2022). As an inclusion criterion, from the viewpoint of injury prevention during running with additional resisted sled force, male collegiate track and field athletes with RSS training experience were recruited. Conversely, athletes with disabilities/injuries and no RSS training experience were excluded. The experiment was performed according to the Declaration of Helsinki, and informed consent was obtained from each participant, both verbally and in writing. This study was approved by our institutional ethics committee (589).
Procedures
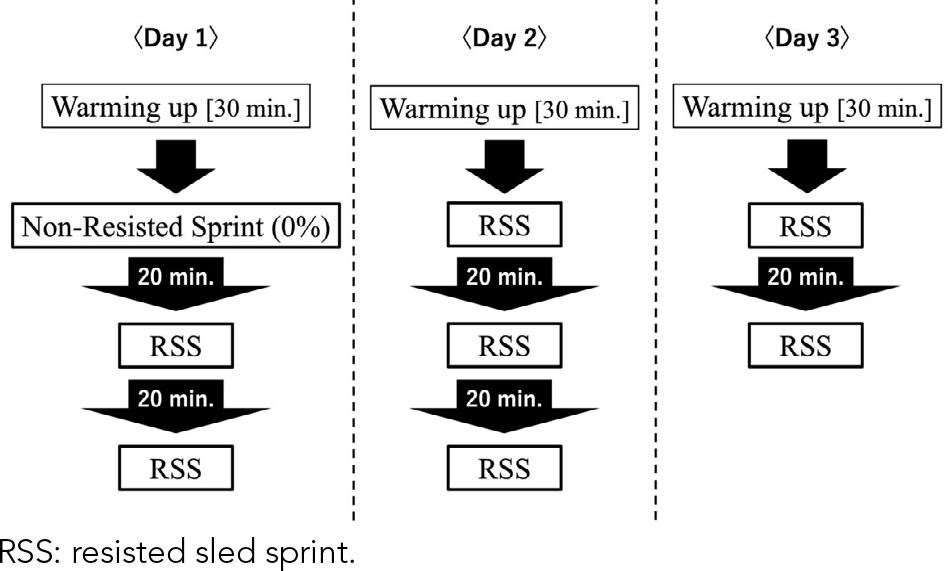
This was a prospective study with the following procedures. All tests were conducted on an outdoor playing field; participants wore short-distance spikes during the tests, and participants performed a 30-min standardised warm-up dedicated for sprinters before the test (Martínez-Valencia et al., 2015; Pantoja, Carvalho, Ribas, & Peyré-Tartaruga, 2018) (Figure 1). The tests consisted of a standing start with one hand on the ground (3-point start) followed by a starting signal given by a pistol to perform the RSS with maximum effort. With consideration of the rate of creatine phosphate recovery to eliminate the effects of fatigue, participants rested for 20 min between tests (Sahlin & Ren, 1989). Two to three tests were performed daily for a total of 3 days, with at least 48 hours between tests.
RSS load settings
Loads were individually set based on the participants’ BM measured prior to the study using the Fit Scan FS-E01 scale (Tanita, Tokyo, Japan). BM was rounded to one decimal place, and the following eight loads were used: no load (0%BM) and seven loads in 10% increments from 20% to 80%BM. The weight of the training sled (Training Sled, Lindsports, Osaka, Japan) used for the RSS was 12 kg. When heavier weights were evaluated, weight-training plates were used and adjusted in 1.25-kg increments; all participants first performed a no-load sprint (0%BM) test. To eliminate order effects on performance, loads for subsequent tests were randomly selected, and all loads were evaluated via the RSS.
Measurements
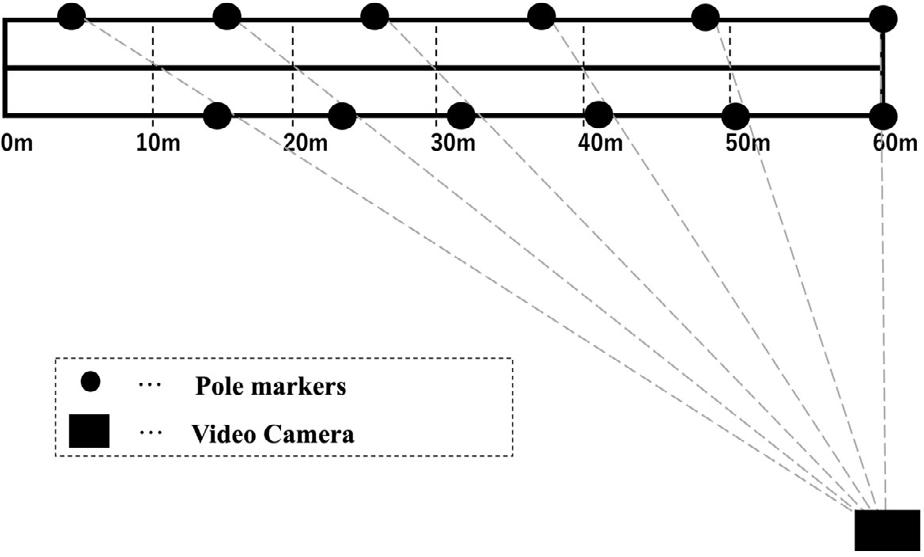
The sprint movements were recorded using a video camera (GC-LJ25B; JVC, Kanagawa, Japan, 240 fps) set up beside the goal line (60 m), with the camera panning from the gun to the first step after crossing the goal line. In this study, the 60 m was divided into six phases of 10 m each to measure the average velocity, step frequency, and step length at each phase.
Two lanes were used, and the participants were instructed to run on the centerline. To calculate the 10-m interval values for each phase, two pole markers were placed linearly to the participant’s torso through the camera’s viewfinder (Figure 2). An examiner confirmed the correct position of the poles before each trial.
Each sprint time was defined as the time (sec) from the flash of the starting pistol or the moment the participant’s torso passed through the pole until it passed the next pole, which was calculated using the number of frames. The number of steps (Steptotal) was determined using the following formula based on previous studies (Otsuka & Isaka, 2019) (Equation 1):
Where:
StepStart-pre30: the number of steps from the starting point or pole passage to the moment just before the next pole passage;
Tpre30: the time from the starting flash to grounding just before the body part passed the finish line;
Tpost30: the time from the start to grounding just after the body part passed the finish line.
Running velocity (m/sec) was obtained as a product of step frequency and step length (Equation 2).
Where:
Step frequency (Hz): the number of steps per second;
Step length (m): the distance travelled per step.
In this study, the average step frequency for each segment was determined from the number of steps and time required in each one, and the average step length was obtained by dividing the segment distance by the number of steps required.
Statistical processing
All values are expressed as mean± standard deviation (mean± SD) with 95% confidence interval (95% CI) and coefficient of variation (CV). A two-way repeated-measures analysis of variance (load × phase) was used to analyse the RSS performance variation with load differences. For cases in which the interaction was significant, we performed multiple comparisons using the Bonferroni post-hoc test for each factor. The effect sizes of the interaction with each factor were expressed using bias (η2): 0< η2≤ 0.04, without effect; 0.04< η2≤ 0.25, minimum; 0.25< η2≤ 0.64, moderate; and 0.64< η2, strong (Ferguson, 2009). The effect size in the Bonferroni post-hoc test was calculated using Cohen’s d, in which the effect sizes of magnitudes of 0.2, 0.5, and > 0.8 corresponded to small, moderate, and large, respectively (Cohen, 1988). Statistical significance was set at 5% (p< 0.05). We used IBM SPSS Statistics version 27.0 (IBM Corporation) software for statistical analysis.
RESULTS
Table 1 shows the mean± SD, 95% CI, and CV of running velocity, step frequency, and step length for six phases (0–10 m, 10–20 m, 20–30 m, 30–40 m, 40–50 m, and 50–60 m).
Table 1 Performance variables for running velocity, step frequency, and step length (mean± standard deviation).
| Measurement | 0~10 m | 10~20 m | 20~30 m | 30~40 m | 40~50 m | 50~60m | |||||||||||||
|---|---|---|---|---|---|---|---|---|---|---|---|---|---|---|---|---|---|---|---|
| Mean± SD | 95% CI | CV | Mean± SD | 95% CI | CV | Mean± SD | 95% CI | CV | Mean± SD | 95% CI | CV | Mean± SD | 95% CI | CV | Mean± SD | 95% CI | CV | ||
| Running Velocity (m/sec) | 0%BM | 4.72± 0.20 | 4.46–4.81 | 0.04 | 8.53± 0.29 | 8.40–8.66 | 0.03 | 8.95± 0.28 | 8.82–9.08 | 0.03 | 9.50± 0.28 | 9.37–9.62 | 0.03 | 9.47± 0.26 | 9.35–9.59 | 0.03 | 9.35± 0.35 | 9.19–9.51 | 0.04 |
| 20%BM | 4.16± 0.21 | 4.06–4.26 | 0.05 | 7.19± 0.31 | 7.05–7.33 | 0.04 | 7.48± 0.27 | 7.36–7.61 | 0.04 | 7.75± 0.37 | 7.57–7.92 | 0.05 | 7.60± 0.37 | 7.42–7.77 | 0.05 | 7.37± 0.39 | 7.19–7.55 | 0.05 | |
| 30%BM | 3.85± 0.20 | 3.76–3.95 | 0.05 | 6.47± 0.33 | 6.32–6.63 | 0.05 | 6.72± 0.39 | 6.54–6.90 | 0.06 | 6.88± 0.43 | 6.68–7.08 | 0.06 | 6.74± 0.47 | 6.53–6.96 | 0.07 | 6.45± 0.49 | 6.23–6.68 | 0.08 | |
| 40%BM | 3.62± 0.20 | 3.53–3.71 | 0.06 | 5.88± 0.28 | 5.75–6.01 | 0.05 | 5.99± 0.33 | 5.84–6.15 | 0.06 | 6.05± 0.40 | 5.87–6.24 | 0.07 | 5.88± 0.44 | 5.68–6.09 | 0.08 | 5.60± 0.45 | 5.39–5.81 | 0.08 | |
| 50%BM | 3.33± 0.28 | 3.20–3.46 | 0.08 | 5.20± 0.49 | 4.97–5.43 | 0.09 | 5.21± 0.51 | 4.98–5.45 | 0.1 | 5.27± 0.51 | 5.04–5.51 | 0.1 | 5.05± 0.58 | 4.78–5.32 | 0.12 | 4.75± 0.56 | 4.49–5.01 | 0.12 | |
| 60%BM | 3.00± 0.24 | 2.89–3.11 | 0.08 | 4.59± 0.47 | 4.37–4.81 | 0.1 | 4.44± 0.53 | 4.19–4.68 | 0.12 | 4.38± 0.50 | 4.15–4.62 | 0.11 | 4.13± 0.48 | 3.90–4.36 | 0.12 | 3.86± 0.51 | 3.62–4.10 | 0.13 | |
| 70%BM | 2.66± 0.36 | 2.49–2.83 | 0.13 | 3.98± 0.56 | 3.72–4.24 | 0.14 | 3.80± 0.63 | 3.51–4.09 | 0.17 | 3.67± 0.60 | 3.39–3.95 | 0.16 | 3.35± 0.66 | 3.04–3.66 | 0.2 | 3.02± 0.70 | 2.69–3.34 | 0.23 | |
| 80%BM | 2.52± 0.31 | 2.37–2.66 | 0.12 | 3.63± 0.51 | 3.39–3.87 | 0.14 | 3.44± 0.58 | 3.17–3.72 | 0.17 | 3.29± 0.58 | 3.02–3.56 | 0.18 | 3.02± 0.61 | 2.74–3.31 | 0.2 | 2.69± 0.75 | 2.35–3.04 | 0.28 | |
| Step Frequency (Hz) | 0%BM | 3.40± 0.19 | 3.32–3.49 | 0.06 | 4.45± 0.18 | 4.37–4.53 | 0.04 | 4.48± 0.19 | 4.39–4.57 | 0.04 | 4.49± 0.16 | 4.41–4.57 | 0.04 | 4.48± 0.18 | 4.40–4.56 | 0.04 | 4.30± 0.22 | 4.20–4.41 | 0.05 |
| 20%BM | 3.39± 0.18 | 3.31–3.48 | 0.05 | 4.29± 0.20 | 4.20–4.39 | 0.05 | 4.27± 0.20 | 4.18–4.36 | 0.05 | 4.22± 0.19 | 4.14–4.31 | 0.04 | 4.16± 0.20 | 4.07–4.25 | 0.05 | 3.94± 0.18 | 4.86–4.03 | 0.05 | |
| 30%BM | 3.32± 0.20 | 3.23–3.42 | 0.06 | 4.21± 0.22 | 4.11–4.32 | 0.05 | 4.16± 0.22 | 4.06–4.27 | 0.05 | 4.13± 0.20 | 4.04–4.23 | 0.05 | 4.03± 0.22 | 3.93–4.14 | 0.05 | 3.80± 0.23 | 3.70–3.91 | 0.06 | |
| 40%BM | 3.29± 0.26 | 3.17–3.41 | 0.08 | 4.11± 0.23 | 4.01–4.22 | 0.06 | 4.05± 0.24 | 3.94–4.16 | 0.06 | 3.99± 0.24 | 3.88–4.11 | 0.06 | 3.92± 0.22 | 3.82–4.03 | 0.06 | 3.72± 0.27 | 3.60–3.85 | 0.07 | |
| 50%BM | 3.17± 0.31 | 3.03–3.32 | 0.1 | 3.94± 0.41 | 3.75–4.14 | 0.1 | 3.89± 0.37 | 3.71–4.06 | 0.1 | 3.85± 0.31 | 3.71–3.99 | 0.08 | 3.76± 0.32 | 3.61–3.91 | 0.09 | 3.57± 0.31 | 3.42–3.72 | 0.09 | |
| 60%BM | 3.13± 0.22 | 3.03–3.24 | 0.07 | 3.79± 0.27 | 3.66–3.92 | 0.07 | 3.75± 0.27 | 3.62–3.87 | 0.07 | 3.64± 0.30 | 3.50–3.79 | 0.08 | 3.58± 0.25 | 3.47–3.70 | 0.07 | 3.46± 0.24 | 3.35–3.57 | 0.07 | |
| 70%BM | 2.99± 0.24 | 2.88–3.10 | 0.08 | 3.63± 0.27 | 3.51–3.76 | 0.07 | 3.59± 0.24 | 3.48–3.71 | 0.07 | 3.48± 0.24 | 3.37–3.60 | 0.07 | 3.37± 0.26 | 3.25–3.49 | 0.08 | 3.22± 0.26 | 3.10–3.34 | 0.08 | |
| 80%BM | 3.00± 0.26 | 2.88–3.12 | 0.09 | 3.61± 0.19 | 3.52–3.70 | 0.05 | 3.53± 0.23 | 3.42–3.63 | 0.06 | 3.41± 0.23 | 3.30–3.52 | 0.07 | 3.32± 0.26 | 3.20–3.44 | 0.08 | 3.22± 0.44 | 3.02–3.42 | 0.14 | |
| Step Length (m) | 0%BM | 1.39± 0.09 | 1.35–1.43 | 0.06 | 1.92± 0.10 | 1.87–1.97 | 0.05 | 2.00± 0.09 | 1.96–2.04 | 0.04 | 2.12± 0.07 | 2.09–2.15 | 0.03 | 2.12± 0.08 | 2.08–2.16 | 0.04 | 2.18± 0.10 | 2.13–2.23 | 0.05 |
| 20%BM | 1.23± 0.07 | 1.19–1.26 | 0.06 | 1.68± 0.10 | 1.63–1.72 | 0.06 | 1.76± 0.08 | 1.72–1.80 | 0.05 | 1.84± 0.10 | 1.79–1.88 | 0.05 | 1.83± 0.08 | 1.79–1.87 | 0.05 | 1.87± 0.10 | 1.83–1.91 | 0.05 | |
| 30%BM | 1.16± 0.08 | 1.13–1.20 | 0.07 | 1.54± 0.09 | 1.50–1.58 | 0.06 | 1.62± 0.10 | 1.57–1.66 | 0.06 | 1.66± 0.09 | 1.62–1.71 | 0.05 | 1.68± 0.12 | 1.62–1.73 | 0.07 | 1.70± 0.13 | 1.64–1.76 | 0.08 | |
| 40%BM | 1.11± 0.10 | 1.06–1.15 | 0.09 | 1.43± 0.08 | 1.40–1.47 | 0.06 | 1.48± 0.07 | 1.45–1.51 | 0.04 | 1.52± 0.08 | 1.48–1.56 | 0.05 | 1.50± 0.09 | 1.46–1.55 | 0.06 | 1.50± 0.10 | 1.46–1.55 | 0.07 | |
| 50%BM | 1.05± 0.07 | 1.02–1.09 | 0.07 | 1.32± 0.10 | 1.28–1.37 | 0.07 | 1.34± 0.09 | 1.30–1.39 | 0.07 | 1.37± 0.09 | 1.33–1.41 | 0.06 | 1.34± 0.11 | 1.29–1.39 | 0.08 | 1.33± 0.10 | 1.28–1.38 | 0.08 | |
| 60%BM | 0.96± 0.07 | 0.93–0.99 | 0.08 | 1.21± 0.09 | 1.17–1.26 | 0.08 | 1.18± 0.11 | 1.13–1.23 | 0.09 | 1.20± 0.10 | 1.16–1.25 | 0.09 | 1.15± 0.11 | 1.10–1.21 | 0.1 | 1.11± 0.11 | 1.06–1.17 | 0.1 | |
| 70%BM | 0.89± 0.08 | 0.85–0.93 | 0.09 | 1.09± 0.12 | 1.04–1.15 | 0.11 | 1.05± 0.14 | 0.99–1.12 | 0.13 | 1.05± 0.14 | 0.99–1.12 | 0.13 | 0.99± 0.15 | 0.92–1.06 | 0.15 | 0.93± 0.17 | 0.85–1.00 | 0.18 | |
| 80%BM | 0.84± 0.09 | 0.80–0.88 | 0.11 | 1.00± 0.11 | 0.95–1.05 | 0.11 | 0.97± 0.12 | 0.92–1.03 | 0.13 | 0.96± 0.13 | 0.90–1.02 | 0.13 | 0.91± 0.13 | 0.84–0.97 | 0.14 | 0.82± 0.15 | 0.76–0.89 | 0.18 | |
In the running velocity, significant load (p< 0.001, F= 726.134, η2= 0.94) and phase (p< 0.001, F= 1,244.209, η2= 0.77) effects were observed. In addition, a significant interaction was observed (p< 0.001, F= 182.041, η2= 0.54). In each phase, significant differences were identified between all loads, except for 70% and 80%BM (p< 0.001, d= 1.15–14.95); no significant differences were identified between 70 and 80%BM in any phase (p= 0.80–1.00, d= 0.15–0.65)
Regarding the step frequency, significant load (p< 0.001, F= 101.841, η2= 0.60) and phase (p< 0.001, F= 486.947, η2= 0.54) effects were observed. In addition, a significant interaction was noted (p< 0.001, F= 17.816, η2= 0.09). In each phase, significant differences were identified between all loads except 70 and 80%BM (p= 0.000–0.05, d= 0.13–5.45); no significant differences were identified between 70 and 80%BM in any phase (p= 0.06–1.00, d= 0.04–0.30).
In the step length, significant load (p< 0.001, F= 645.937, η2= 0.91) and phase (p< 0.001, F= 462.081, η2= 0.62) effects were observed. In addition, a significant interaction was confirmed (p< 0.001, F= 81.126, η2= 0.42). Significant differences were confirmed between all loads (p< 0.001, d= 0.59–10.67).
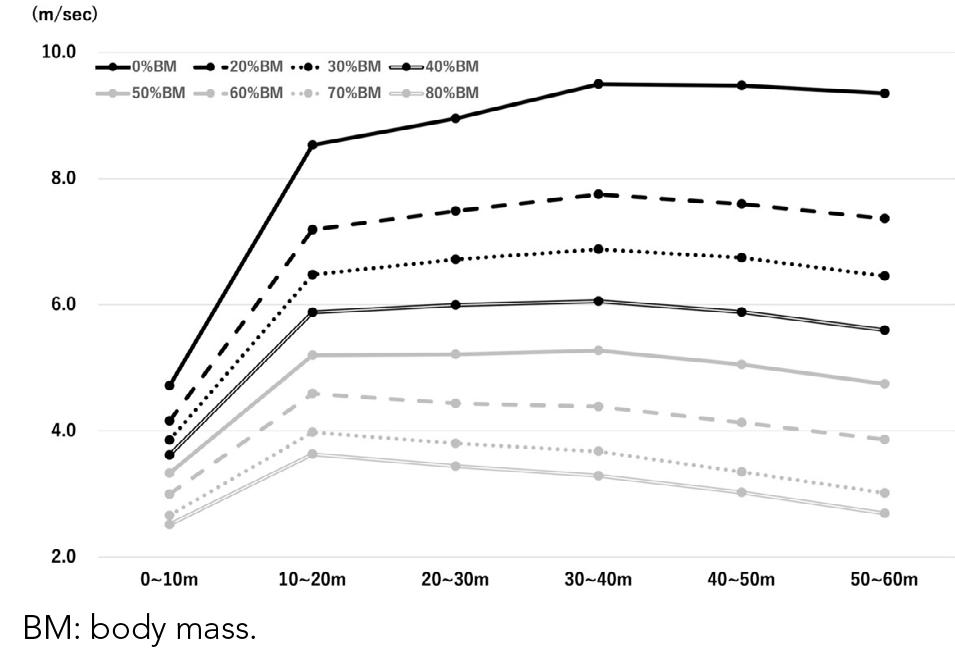
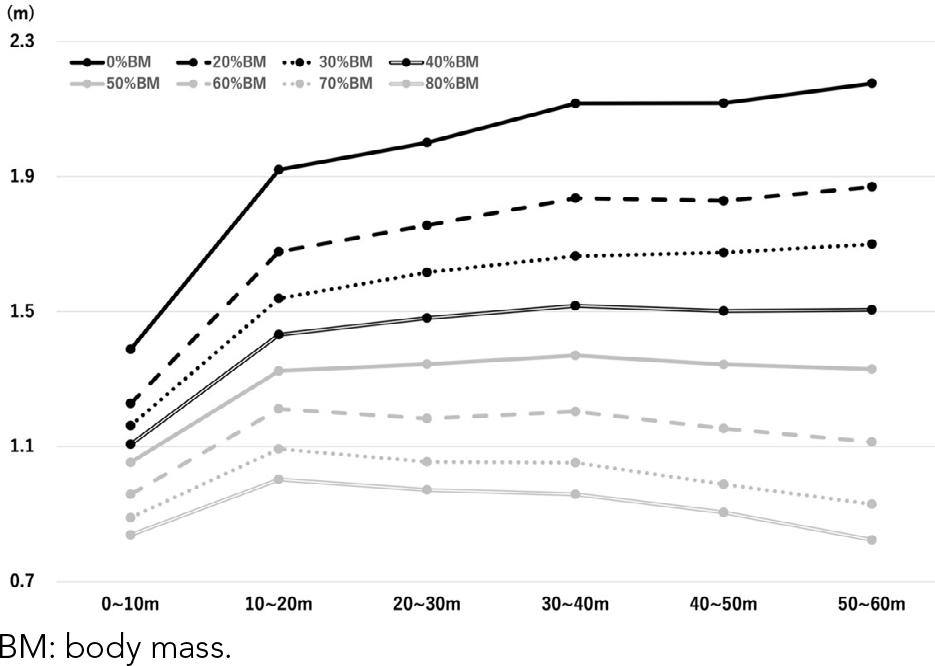
Running velocity, step frequency, and step length are shown in Figures 3–5. The maximum running velocity during the RSS was reached in the 30–40-m phase with 0–50%BM and 0%BM. At 0%BM, the velocity in the 30–40-m phase was maintained until the 50–60-m phase (p= 0.10–1.00, d= 0.11–0.39), while at 40% and 50%BM, the velocity was maintained in the 10–40-m phase (p= 0.53–1.00, d= 0.16–0.41). At 60–80%BM, the 10–20-m phase was the maximum running velocity phase. At 60% and 70%BM, participants maintained velocity in the 30–50-m phase (p= 0.71–1.00, d= 0.12–0.51), while at 80%BM, there was no velocity-maintaining phase (p= 0.000–0.03, d= 0.35–2.63).
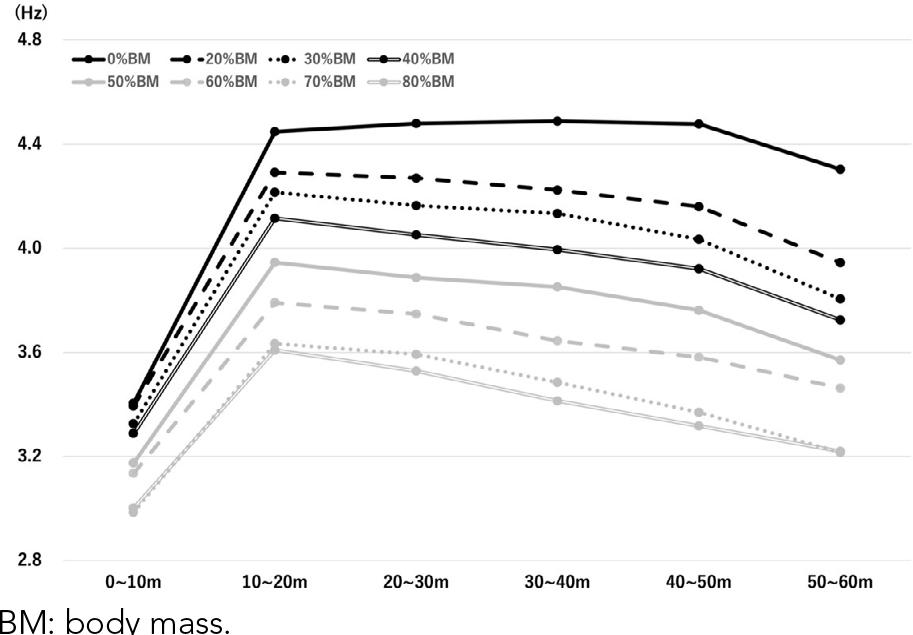
For 0%BM, the step frequency increased rapidly from 0 to 20 m (p< 0.001, d= 5.67), was maintained until 20–50 m (p= 1.00, d= 0.06–0.16), and then decreased in the 50–60-m phase (p< 0.001, d= 0.90). The maximum step frequency phases for 0%BM and 20–80%BM were the 30–40-m and 10–20-m phases, respectively. Step frequency was maintained in the 10–40-m phase for 20% and 50%BM, in the 20–40-m phase for 30%BM, in the 10–30-m and 30–50-m phases for 60%BM, in the 10–30-m phase for 70%BM, and in the 40–60-m phase for 80%BM (p= 0.06–1.00, d= 0.06–0.38).
The phases of maximum step length were the 50–60-m phase for 0–30%BM, the 30–40-m phase for 40–50%BM, and the 10–20-m phase for 60–80%BM. Step length was maintained in the 30–50-m phase for 0% and 20%BM, in the 30–60-m phase for 30%BM, in the 20–60-m phase for 40%BM, in the 10–60-m phase for 50%BM, in the 10–30-m and 30–60-m phases for 60%BM, and in the 10–40-m phase for 70% and 80%BM (p= 0.12–1.00, d= 0.00–0.53).
DISCUSSION
The aim of this study was to examine the effects of load differences on running velocity, step frequency, and step length during RSS in trained collegiate track and field athletes. The results showed that running velocity, step frequency, and step length decreased with increasing load; furthermore, the variations per 10 m also differed with different loads. These findings support our hypotheses.
Regarding the effect of RSS on running velocity, Martínez-Valencia et al. (2015) reported that sprint times increased significantly at 20 m and 30 m during the RSS with 10–20%BM compared with 0%BM. Similarly, Zabaloy et al. (2022) reported a significant increase in sprint time during acceleration (0–5 m) and maximal velocity (20–25 m) phases with increasing load in RSS with 0–50%BM. In this study, running velocity decreased significantly for 60 m with RSS loads of 20–80%BM compared with 0%BM. On the same ground surface, the weight of an object is proportional to the frictional force between the object and the ground (Cross et al., 2017). Therefore, an increase in the frictional force associated with sled weight should cause the runner’s propulsion velocity to decrease. The results of the present study support those reported by Martínez-Valencia et al. (2015) and Zabaloy et al. (2022); moreover, they indicate that RSS for at least 60 m with up to 80%BM decreased running velocity with increasing load.
Short-distance running (such as 100-m sprinting) is broken down into acceleration, maximum velocity, and deceleration phases (Mero, Komi, & Gregor, 1992; Schiffer, 2010). From a comprehensive point of view, the change in running velocity with running distance is maintained around the maximum running velocity after a rapid acceleration from the start, to approximately 30 m in both the 100-m run at the World Championships (Bissas, Walker, Tucker, Paradisis, & Merlino, 2017) and the 50-m run at a typical age of 11–12 years (Ito, 1986). However, in this study, by observing the change in running velocity with distance run during RSS, a significant interaction was observed between the change in velocity every 10 m and the difference in load. Additionally, the sprint time for each load ranged from 9.12–20.47 s for 20–80%BM loads, compared with 7.6 s for no load. Due to the relationship between exercise intensity and duration, the primary energy supply system for performing a given exercise changes with prolonged exercise duration (Medbø & Tabata, 1989; Ogita et al., 2003). In these contexts, there is no doubt that the same distance of RSS at different loads will have different intensities and main energy supply systems, which depend on its duration. Therefore, coaches and athletes need to take this difference into account when using RSS in training.
The velocity of cyclical movements that involve the repetition of similar actions—such as running (Mero et al., 1992) or swimming (Craig Jr. & Pendergast, 1979)—is calculated as the product of the frequency of movement per unit time (step frequency), and distance travelled in a single movement (step length). Zabaloy et al. (2022) reported that in RSS with loads of 10–50%BM, step length decreased with increasing loads, but step frequency did not. Conversely, Lockie et al. (2003) reported that step frequency and step length in RSS decreased with loads of 12.2 and 32.2%BM when compared with 0%BM load. Furthermore, step length decreased with increasing load, while step frequency did not change. In the present study, both step frequency and step length decreased significantly for 20–80%BM loads when compared with 0%BM load. However, step length decreased with increasing load, whereas step frequency decreased with increasing load from 0%BM to 70%BM with no significant difference between 70%BM and 80%BM. In the present study, the results were inconsistent with previous studies in step frequency and step length from 0%BM to 70%BM. The phase of maximum running velocity was the same at 0-50% BM, but the phase of maximum step length differed at 0-30% BM and 40-50% BM. It was suggested that the ratio of step frequency and step length differed according to RSS loads. This ratio between step frequency and step length is unique to each individual and automatised (Schiffer, 2010) but may be changed by RSS loads. This characteristic of each load is an important point for coaches and athletes to consider when conducting RSS in training. For example, if you aim to run close to a normal run (0% BM) during RSS, you may want to avoid using loads above 40% BM.
The participants in the studies by Lockie et al. (2003) and Zabaloy et al. (2022) were field athletes who were likely to be subjected to external loads due to contact with others, whereas those in this study were sprinters. For example, Pareja-Blanco et al. (2022) reported that the alterations induced by RSS in sprint velocity and running technique differed between elite sprinters and rugby union players. Furthermore, Murray et al. (2005) suggested that variation in RSS performance among participants was caused by leg strength relative to body weight, meaning that differences in events and muscle strength may have influenced the variables during sprinting associated with different loads during RSS. Furthermore, running velocity, step frequency, and step length decreased significantly with the increase in RSS load in all sprinting phases; however, the phases in which these maximum values appeared were partially matched. Specifically, the maximum running velocity and step length were observed in the 30–40-m phase for the 40% and 50%BM loads, while the maxima for all variables were found in the 10–20-m phase for the 60–80%BM loads. Generally, the changes in RSS velocity, step frequency, and step length with distance travelled varied with different loads, suggesting that the changes varied between runners.
In the running velocity, the CV became larger as the load increased and toward the later phases at 70%BM and 80%BM. This means that the difference in running velocity between participants expands with increasing load, i.e., the difference in exercise time between the top and the bottom participants expands with increasing load. From the perspective of changes in the energy supply system with exercise duration, the difference in exercise times between higher and lower levels may affect the training setting for athletes and coaches. Therefore, when groups with widely different performance levels perform RSS training, it may be better to set the load according to the rate of velocity loss rather than %BM. The CV of step length became larger with increasing load as well as running velocity, but the CV of step frequency was unaffected by load. The kinematics of RSS varied depending on the different events of the participants (Murray et al., 2005; Pareja-Blanco et al., 2022), and each participant’s muscle strength may have influenced the variation in step frequency and step length CV in the present study. Therefore, it will be necessary in the future to observe changes in kinematics across the various events and levels of participants. Body movement, ground reaction force, flight time, and contact time are also important indicators in addition to the measures in this study when analysing sprint performance (Hunter, Marshall, & McNair, 2004; Schiffer, 2010). Lockie et al. (2003) and Zabaloy et al. (2022) reported increased trunk leaning during RSS. Additionally, there is a close relationship between the ground reaction force and step frequency, step length, flight time, and ground contact time (Hunter et al., 2004), which has been used as an indicator to evaluate the effect of RSS training over a given period (Kawamori et al., 2014; Morin et al., 2017). In the future, it would be worthwhile to measure indicators to assess running performance that were not measured in this study.
CONCLUSIONS
This study aimed to investigate the effects of load differences on running velocity, step frequency, and step length during RSS in trained collegiate track and field athletes. Our results showed that running velocity in each phase, along with step frequency and step length, decreased with increasing RSS loads to 80%BM and maximum values of running velocity, step frequency, and step length in different phases according to the load. Therefore, athletes and coaches should consider that sprinting performance during RSS will vary with load.


