


 Inglês (pdf)
 Artigo em XML
 Referências do artigo
 Enviar este artigo por email
 Citado por SciELO
  Similares em
SciELO
Similares em
SciELO 
 Permalink
INTRODUCTION
The research interest in aquatic exercise related to sports performance or health and well-being increased remarkably in the past decades. It is consensual that swimming performance is mainly dependent on the swimmer's capacity to overcome water resistance by applying effective propulsive force in the water. On the other hand, the multidirectional load linked to the drag force acts favourably in developing body strength and promotes adherence to water fitness programs (Barbosa et al., 2007). Thus, the assessment of in-water forces is a key aspect of training control in competitive swimming (Santos et al., 2021b) and can help prescribe exercise in water fitness programs (Santos et al., 2019).
The assessment of in-water force has been done using different pressure systems (Santos et al., 2021a). However, some are based on in-house customised devices that are not commercially available, integrating four to eight sensors (e.g., Koga et al., 2022; Takagi & Wilson, 1999). In the last couple of years, a commercial system composed of two hand differential pressure sensors (i.e., Aquanex System) has been regularly used for research in swimming (Santos et al., 2021a) and water fitness (Santos et al., 2019, 2021a). In the specific case of swimming, this set-up allows displacement in front crawl without any constraints in stroke mechanics and efficiency (Santos et al., 2022b). Furthermore, it allows swift and real-time feedback for coaches and researchers to track down the in-water force data with accuracy (Santos et al., 2022a)
As far as our understanding goes, the system lacks validation for all aquatic activities and sports. Moreover, there is still no consensus on a gold standard method for measuring the in-water forces in the aquatic environment. So, the Wind Tunnel emerges here as an option for estimating hydrodynamic data (Hoffmann et al., 2016) and has been used regularly in cyclic sports for technology development (Bäckström et al., 2016). Therefore, this study aimed to validate the Aquanex System using the Wind Tunnel as a standard measurement device. It was hypothesised that the Aquanex System would meet the validation criteria to assess in-water forces.
METHODS
Experimental design
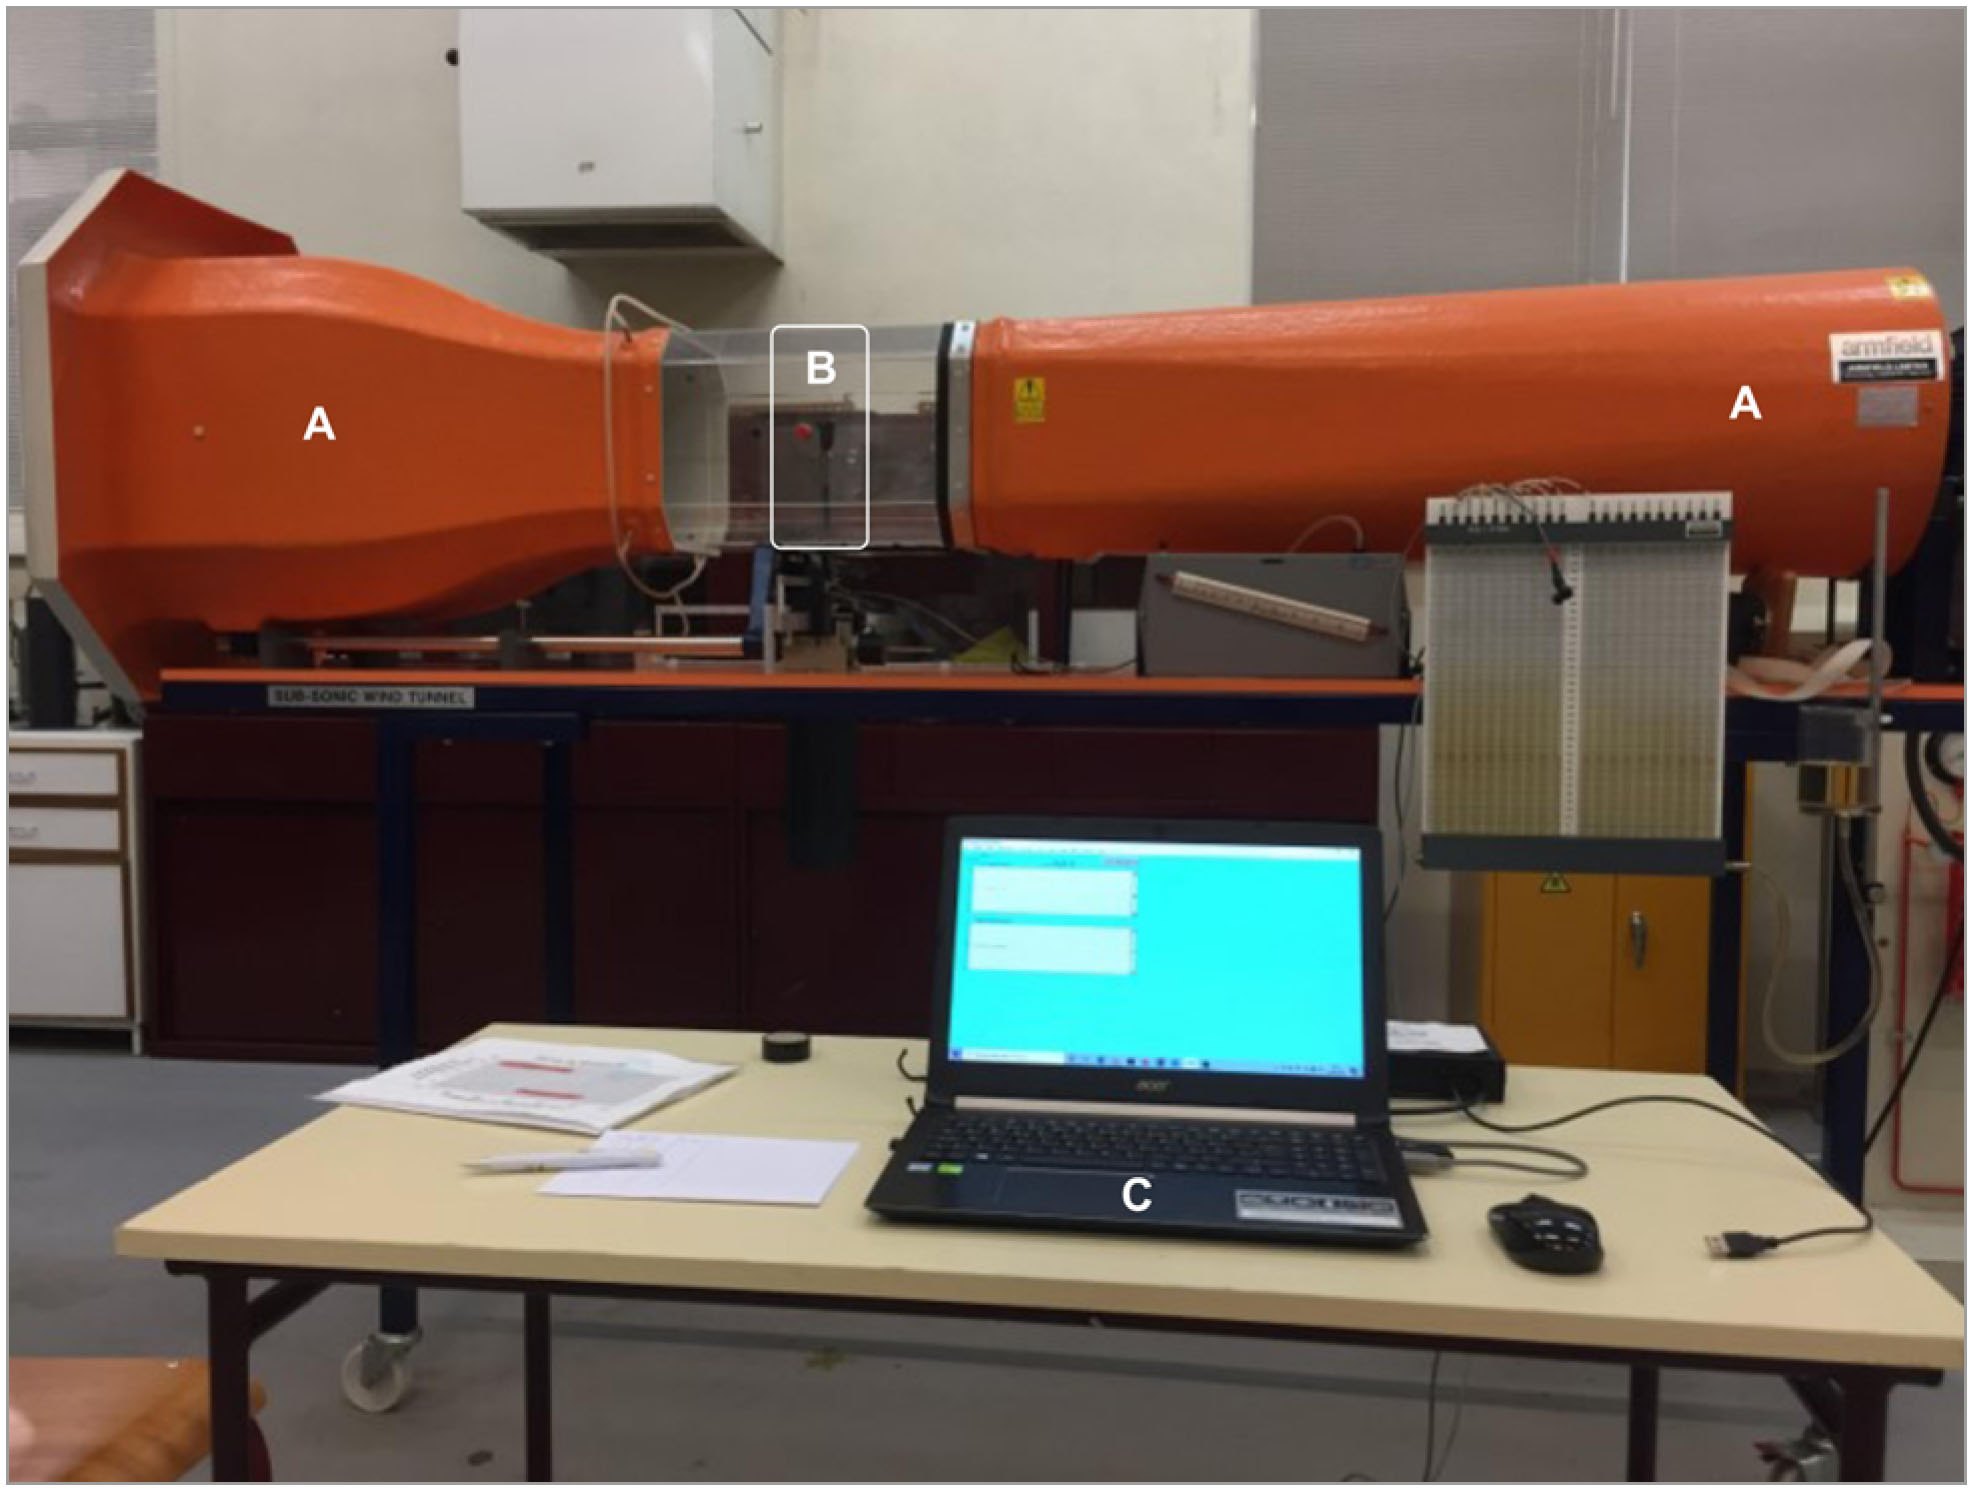
A differential pressure system (Aquanex v.4.1, Model DU2, Swimming Technology Research, Richmond, USA) used in aquatic exercise (Santos et al., 2021a) and previously reported as a reliable method in swimmers (Santos et al., 2022a) was considered for the present study. The Aquanex system is composed of two hand sensors commonly positioned between the third and fourth proximal phalanges and metacarpals of the practitioners (Santos et al., 2022a). For validity purposes, one sensor (Type A, 3.18 cm × 1.91 cm x 2.54 cm; 0.226 kg) was placed inside a subsonic open-circuit suction type Wind Tunnel (model C2, Armfield Limited, Ringwood, United Kingdom) composed of a test section (octagonal form, 30,4 cm x 30,4 cm x 45,7 cm) and a fan (Axial Propellor Fan, Armfield Limited, Ringwood, United Kingdom). The fan system allows the insufflation of the air inside the test section imposed by an electric motor frequency inverter (DV-700, Panasonic, Osaka, Japan).
The sensor was fixed vertically with a rigid iron oriented to the cone at the base of the test section inside the Wind Tunnel and attached to a two-channel A/D converter connected to a laptop with the Aquanex software (Figure 1). Before all measurements, the system was properly calibrated (force equal to zero) as previously reported (Santos et al., 2022a). The force output acquired with the system (in Newton, N) was derived by multiplying the pressure by the area (Santos et al., 2021b). To measure the mean force (FMEAN, N) of both methods, the air was sucked through the test section by the fan located at the rear of the Wind Tunnel. A range of twenty-two frequencies (i.e., velocities) were controlled through the frequency inverter starting at 12Hz and increasing by 2Hz, up to 54Hz. Afterwards, the FMEAN acting on the sensor at each velocity was obtained by considering the frontal area of the sensor.
Statistical analysis
The normality and homoscedasticity of the data were checked using the Shapiro-Wilk and Levene tests, respectively. The mean and one standard deviation (M± 1SD) were computed as descriptive statistics. A paired sample t-test was used to compare the FMEAN between both methods. Simple linear regression models between both methods were computed for FMEAN. As a rule of thumb, effect sizes were interpreted as: (i) very weak if R2< 0.04, weak if 0.04≥ R2< 0.16, moderate if 0.16≥ R2< 0.49, high if 0.49≥ R2< 0.81, and very high if 0.81≥ R2< 1.0. The Bland-Altman plots with 95% limits of agreement (LoA) were used to display the systematic differences between the two methods. The bias (mean difference), standard deviation (SD), and upper and lower LoA were calculated (Bland & Altman, 1986).
The validation was analyzed considering three validation criteria, as previously reported (Barbosa et al., 2011): (i) p> 0.05 in a paired t-test; (ii) R2≥ 0.49 in a simple linear regression model; and (iii) at least 80% of the plots within the limits of agreement in the Bland-Altman plots. All statistical analyses were performed in the SPSS software (v.27, IBM, SPSS Inc., Chicago, IL, USA) and GraphPad Prism (v.9, GraphPad Software, San Diego, CA, USA).
RESULTS
No differences in FMEAN were found when comparing the Aquanex System and the Wind Tunnel (Aquanex System: 0.250± 0.087 N, Wind Tunnel: 0.244± 0.086 N; p= 0.884). Linear regression models between both methods showed significant relationships with a high effect (R2= 0.573, p< 0.001) for FMEAN (Figure 2). The Bland-Altman method revealed that 95.5% of the plots (i.e., more than 80%) were within the upper and lower LoA (Figure 3), and the bias was small (0.002 N).
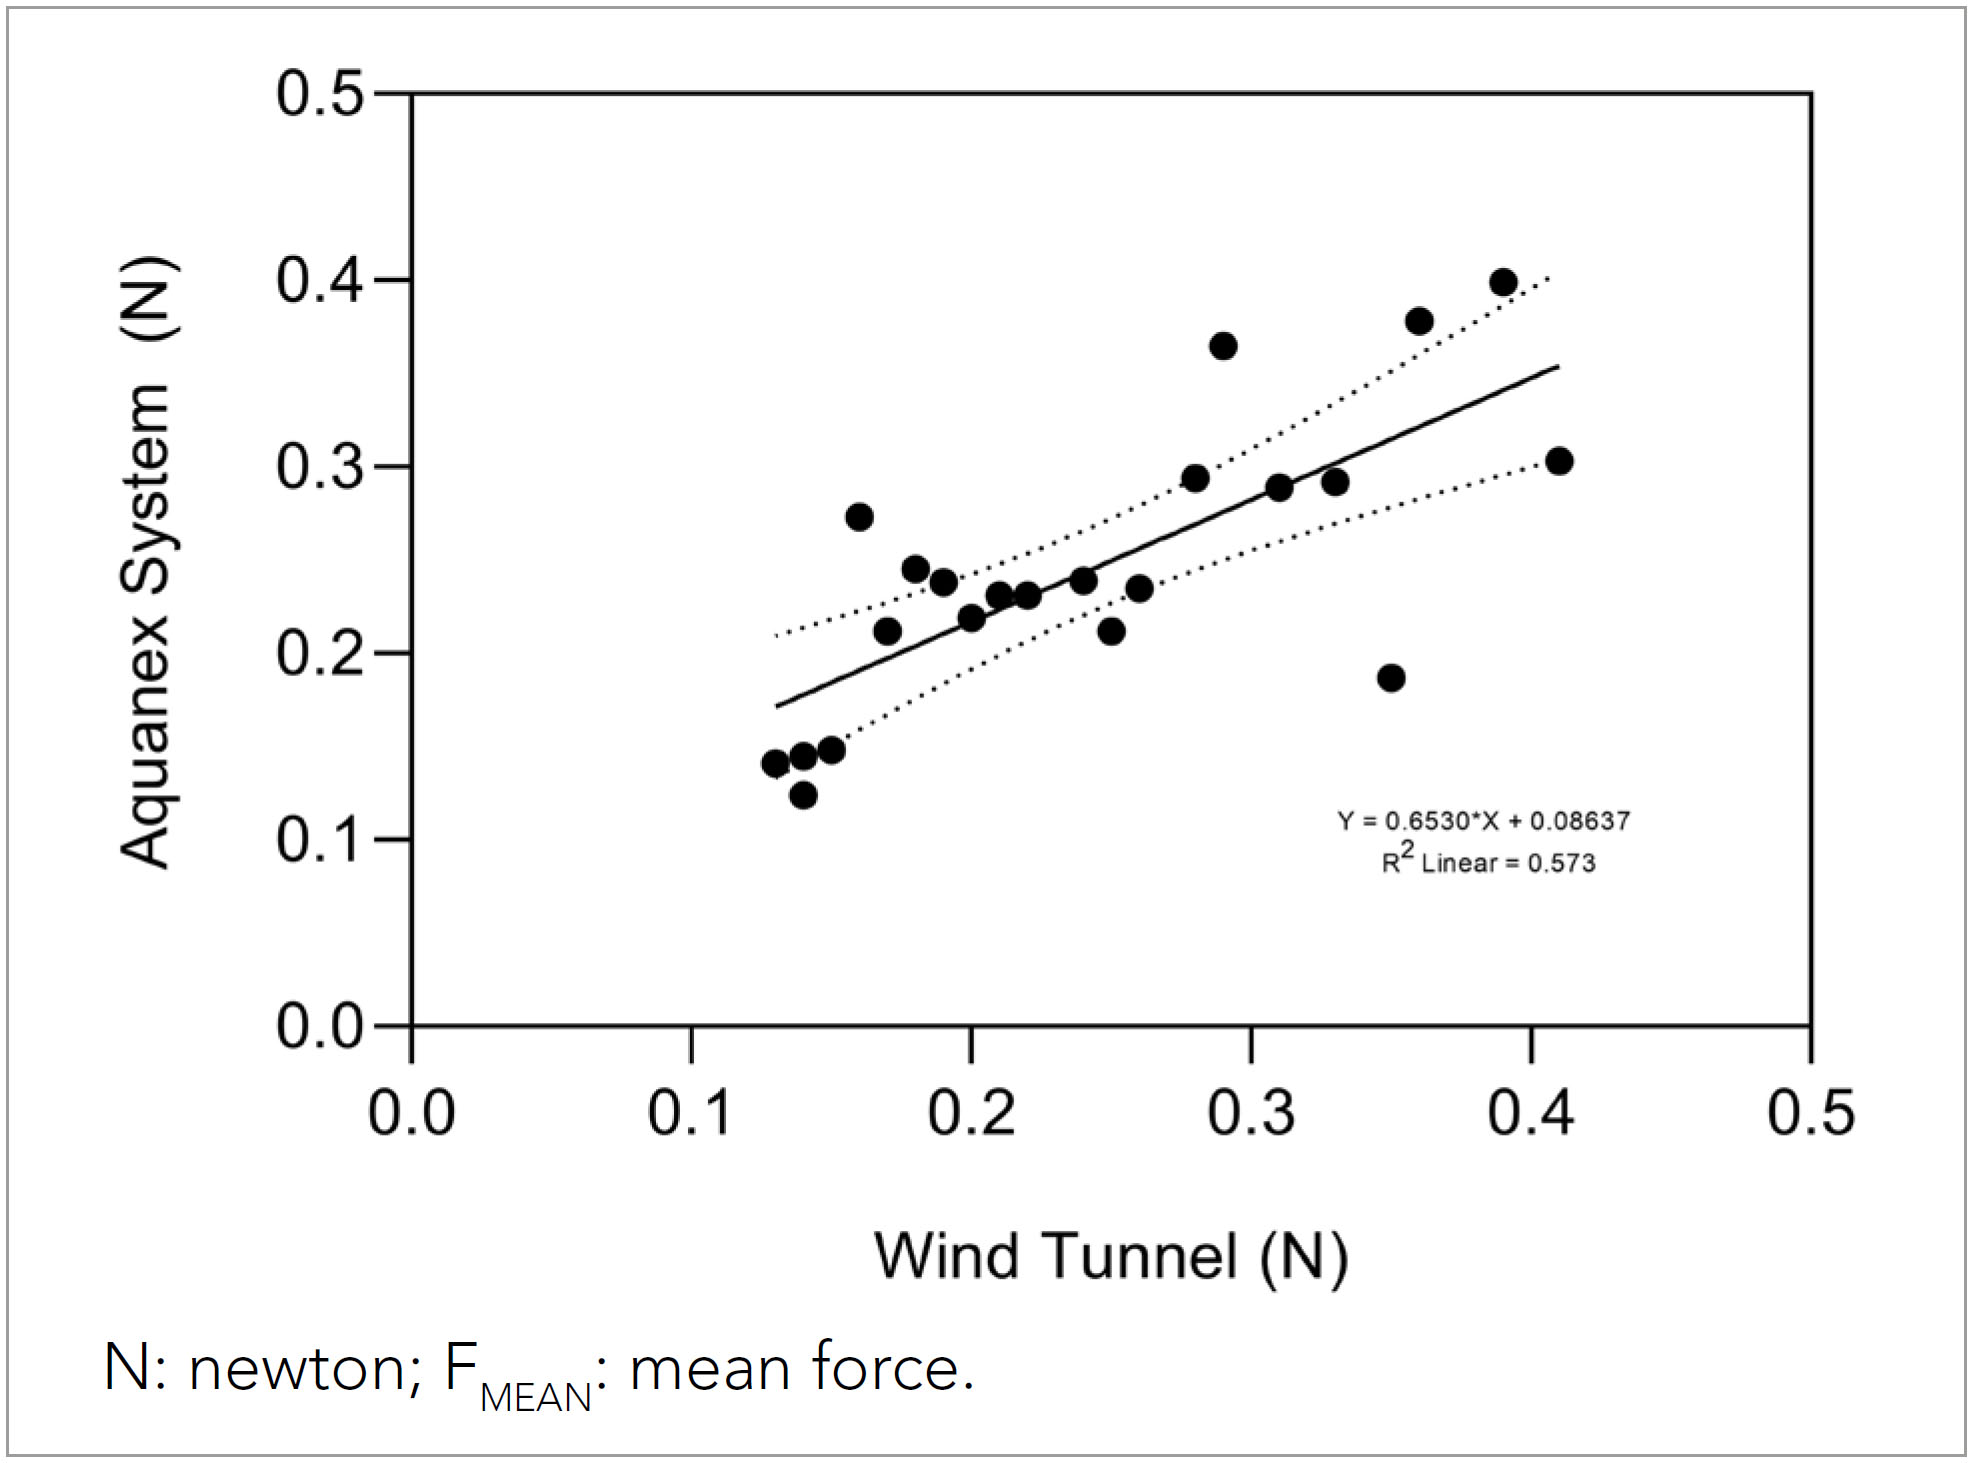
Figure 2 Scattergram with the main trendline (solid line), 95% confidence interval (dotted lines), and determination coefficient (R2).
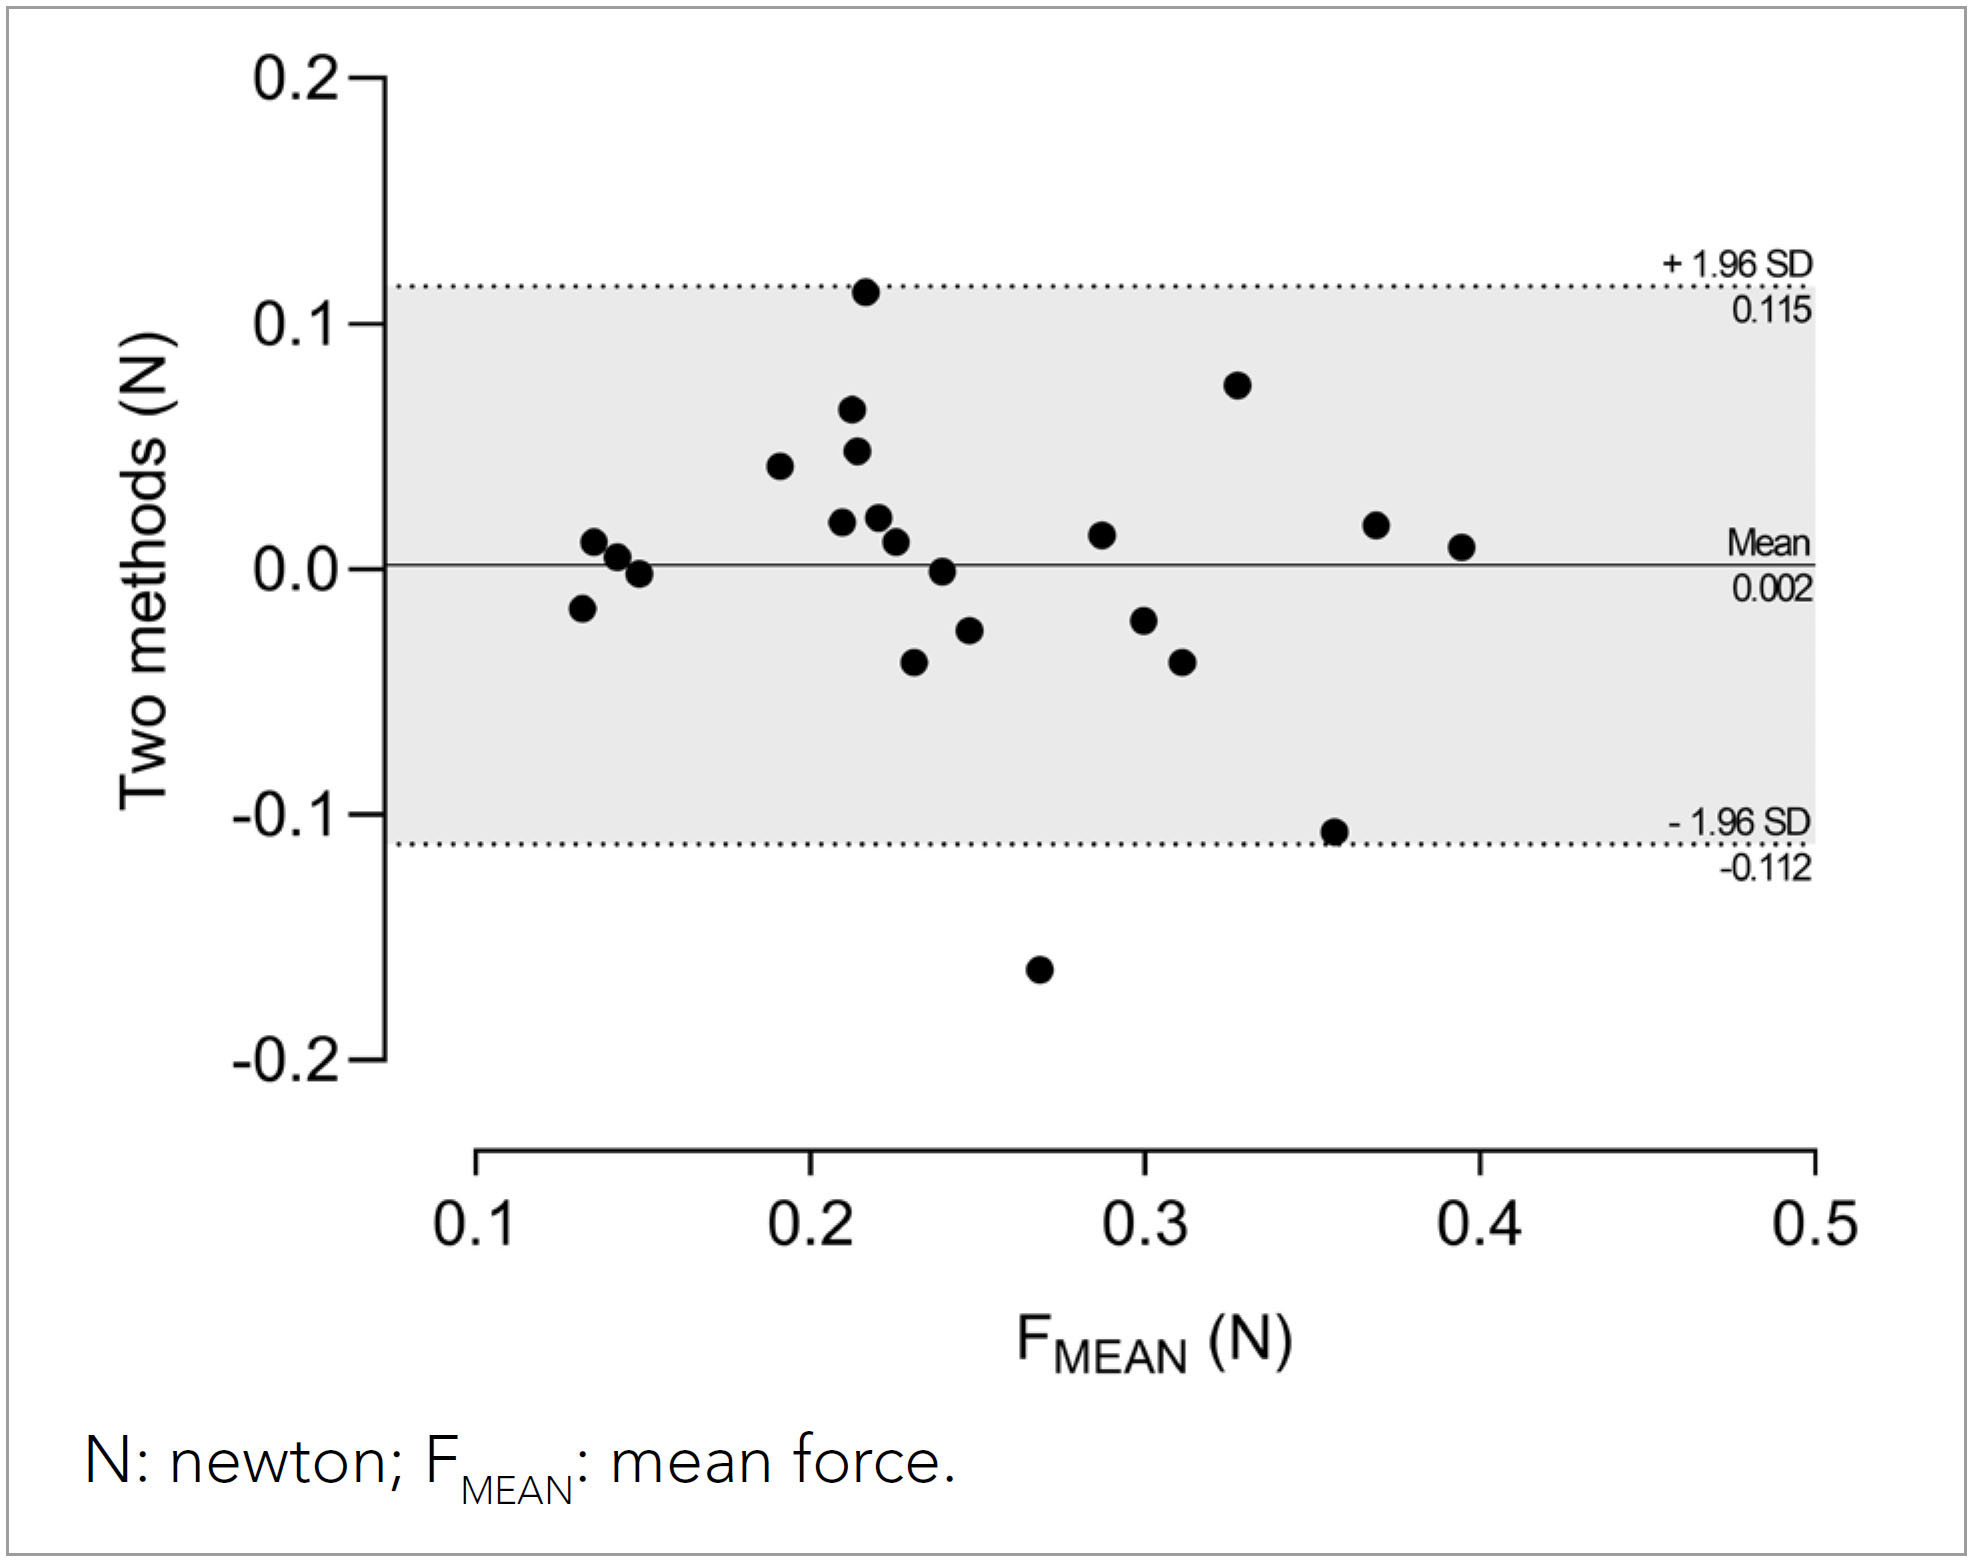
Figure 3 Bland-Altman plots of the difference between Aquanex System and Wind Tunnel (y-axis) and mean of measurements (x-axis). Dotted lines represent the upper and lower 95% LoA (mean differences± 1.96 SD of the differences), and solid lines represent the mean differences between the two methods (bias).
DISCUSSION
The key finding of this study is that the Aquanex system accomplished the three validation criteria regarding the signal acquisition compared to the Wind Tunnel, considered the gold standard.
Field-oriented research helps improve technology (Barbosa et al., 2023), and researchers and coaches can go deeper into the training evaluation process using cutting-edge experimental methods (Santos et al., 2023). Since they continually strive for more accurate methods to enhance performance (Mooney et al., 2015) or health/well-being (Santos et al., 2020), a boost in technological advances has been observed to get more friendly and ecological assessments that resemble as closely as possible water environment (Santos et al., 2022b). Ensuring high levels of validity and reliability is crucial to have accurate control (Atkinson & Nevill, 1998; Hopkins, 2000) and to avoid measurement errors or inter-individual differences that do not reflect the real context of practice (Hopkins et al., 1999). For instance, validation studies in aquatic exercise have been developed mainly for physiologic and biomechanic purposes (e.g., Barbosa et al., 2011), protocols or measures (e.g., Colado & Brasil, 2019).
Although there is still no consensus on a gold standard method for measuring in-water forces, the existing tools should mimic as much as possible the movement pattern of the body limbs (Santos et al., 2021b). Within this, pressure sensors, namely the Aquanex System, allow a displacement throughout the water without constraints (Santos et al., 2022b). However, as far as our understanding goes, a specific validation of the system has not been reported yet. Hence, this study is the first to provide data about validation with the Aquanex System.
When comparing the Aquanex System and the Wind Tunnel, some tiny biases were found, which might be explained by the "nature" of the assessments and the interaction of the different fluids’ characteristics. For instance, water is more than 800 times dense than air (Carr, 2004), implying that the resistance to movement in this environment is higher than in air. Thus, the sensors can be highly sensitive to the air velocity while maintaining a pressure absence (which does not happen in the water). This can explain why the mean values were lower than those retrieved from the assessment conducted in a more ecological and valid environment (i.e., water) (Santos et al., 2019, 2021b; 2022a). Still, there is a high level of consistency on both the qualitative and quantitative levels when the Wind Tunnel is used to determine hydrodynamic data (Hoffmann et al., 2016).
Since this is the first step to validate the usefulness of a two-hand pressure system for in-water force measurements, a few limitations can be pointed out: (i) the use of a wind tunnel instead of a water channel to compare FMEAN values and (ii) the assessments were made under the assumption that both sensors are equal. Future studies should try to use a water channel in a broad range of variables (e.g., peak force or higher velocities) to see if the results follow the same trend.
CONCLUSIONS
The Aquanex System presented a high validation and accuracy. The system seems to be an appropriate device to assess the in-water forces in aquatic sports and exercise. This means that coaches and health professionals can use the Aquanex System to detect acute responses or long-term adaptations in human kinetics for performance, conditioning, or rehabilitation purposes.

