Introduction
Polymers are widely used in dental prostheses, including complete and partial removable dentures, provisional prostheses, and implant-supported prostheses. Moreover, polymethyl methacrylate (PMMA) is still the most common material in dental prostheses fabrication.1-4
The use of CAD/CAM technologies in dentistry has been gaining increasing importance due to its ability to produce various shapes that conform to any biological site. Developments in computer technology and software applications are a relevant part of the groundswell of technological change that has led additive manufacturing technique - 3D printing - to where it is today.5-9 3D printers based on vat photopolymerization, namely stereolithography (SLA) and digital light projection (DLP), were the first commercially available and are still among the most used.10,11
The emergence of these new technologies led to the development of new suitable materials.12 However, the compatible photosensitive acrylic resins limit the application of vat polymerization due to their high volume shrinkage, poor mechanical properties, and low thermal properties.13-16Compared to traditional PMMA resin, 3D-printed PMMA resin demonstrated lower values of flexural strength, modulus of elasticity, and fracture toughness.17-22Therefore, there is na increasing interest in improving commercially available 3D-printed resins by modifying and adapting their mechanical properties to emerging biomedical engineering applications.23-27A promising way to modify and tailor 3D-printed resins’ properties could be through the dispersion of nanomaterials in the resin.28,29
In current dentistry, using a PMMA resin with good mechanical properties for prosthesis fabrication is increasingly important.30-32Consequently, there is a search for a suitable nanofiller that can provide increased mechanical performance without compromising the remaining physical and biological properties.33 Some studies34,35 have demonstrated that surfasse roughness significantly influenced the extent of microbial adhesion to the denture base. Thus, changes in this importante clinical variable might significantly influence bacterial adhesion and retention.35-38
Recent developments in nanotechnology have enabled the use of graphene as a reinforcement phase in several polymers, including PMMA resins.39 This new strategy was developed to improve acrylic resins’ mechanical and biological drawbacks.40
Graphene is a crystalline form of carbon isolated from graphite,41 characterized by excellent mechanical, thermal, and electric properties.42,43 Despite the expected benefits of using graphene in dental applications, its mechanical behavior should be understood to anticipate clinical performance and risk of failure.44 The effects of graphene reinforcement on the properties of 3D-printed PMMA dental resin have not been investigated.
Therefore, this investigation aims to study the effect of graphene reinforcement on the surface roughness and mechanical properties of a commercially available 3D-printed PMMA dental resin. The null hypothesis is that adding graphene does not change PMMA resin’s surface roughness, hardness, and flexural strength.
Material and Methods
Graphene nanoplatelets (GNPs) (Graphenest Advanced Nanotechonoly ®, Aveiro, Portugal) with a 3-10-nm thickness and 8-30 layers with 0.5-2-μm lateral dimensions were added to Dental Sans resin (HARZ Labs® Inc., Russia) - a photosensitive liquid mixture of methacrylate oligomers and monomers used for temporary crowns and bridges. The corresponding neat resin was used as the control group (G0). Four groups with different graphene concentrations were studied: 0.01wt% (G0.01), 0.1wt% (G0.1), 0.25wt% (G0.25), and 0.5wt% (G0.5).
GNPs were homogeneously mixed in the resin for 1 hour in total darkness in a high-power ultrasonic mixer to ensure their dispersion (375 w/L@40kHz). Then, GNPs’ presence in the polymer resin at different concentrations was assessed through Raman spectroscopy. The samples’ Raman spectra, with and without GNPs, were recorded in the 1400-2800-nm wavenumber range using a Horiba LabRAM HR Evolution confocal microscope (Horiba® Scientific, Longjumeau, France) equipped with a 532-nm (2.33 eV) laser.
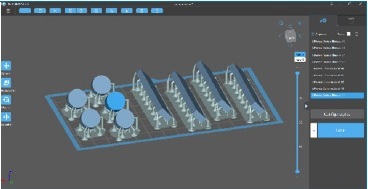
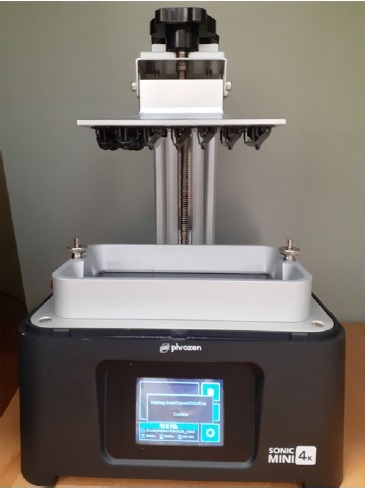
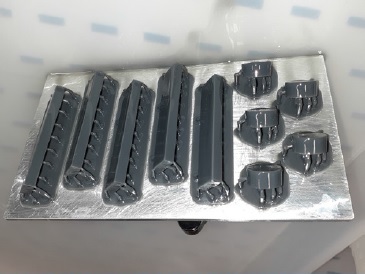
All specimens were virtually designed in the CAD software Chitubox (CDB-Tech®, China) (Figure 1), and the corresponding CAD standard tessellation language (STL) files were sent to the 3D printer. Then, the specimens were 3D printed using a stereolithography printer with LCD technology (Phrozen® Mini 4K, Prozen, Taiwan) equipped with a 405-nm laser to cure the liquid polymer resin Figures (2 and 3). The printing direction was 45°, and the layer resolution was 0.05 mm. The printed material had a density of 1.20 g/cm3 and a viscosity of 1.2 Pa.s. The addition of graphene did not change these polymer’s properties appreciably.
After printing, all specimens were cleaned using a 90% isopropyl alcohol bath in a post-processing machine (Creality3D® UW-02, Creality, China) for 5 minutes to remove unreacted resin according to the manufacturer’s indications. Then, the specimens were placed in an oven at 80°C for 30 minutes (POLEKO® Aparatura, Wodzisław Śląski, Poland) for post-print baking.
Post-polymerization was performed in a UV-light curing unit for 10 minutes (Creality3D® UW-02, Creality, China). Afterward, the support structures were removed using low-speed rotary instruments (5000 rpm).
Finally, the specimens were finished, polished, and measured using a digital caliper with a 0.01-mm resolution (ABSOLUTE® Digimatic Caliper Series 551, Mitutoyo Europe GmbH) to ensure conformity to the ISO 20795-1’s dimensional thresholds.
After measurements, all specimens were disinfected using 70% ethanol for 5 minutes,45 and were stored under 37°C water for 24 h according to ISO 20795-1.46
Flexural properties were studied in 15 bar-shaped specimens (80x10x4mm) according to ISO standard 178: Plastics - Determination of Flexural Properties.47 Three-point bending tests were performed on graphene-polymer resin specimens using a universal testing machine (Electropuls® E1000, Instron, USA) with a 10-kN load cell and a crosshead speed of 1mm/min. The distance adjusted to provide support to the specimens was 60 mm. The flexural strength of each type of graphene-polymer composite was obtained by averaging the test results of three separate specimens to reduce random errors in specimen preparation and experimental measurement.
The Shore D hardness of each resin group (n=5) was measured using a manual analog durometer (Sauter® HBD 100-0, Sauter GmbH, Wutöschingen, German) on round-shaped specimens (12x6mm) according to ASTM D2240.48 The specimen was placed under the indenter area with a 50-N load for 15 seconds of measurement. The values obtained were analyzed on a scale of 0-100 shores of hardness, with higher values indicating a harder material. Three measurements were performed at different locations on each specimen, and mean values were calculated.
The surface roughness profile was measured in 25 barshaped (50x10x4 mm) specimens, five of each group, using a contact profilometer (HommelWerke® LV - 50, Hommelwerke, Germany). The profilometer’s diamond tip had a 5-μm radius and ran the specimen’s surface, under constant load, following a straight measurement distance of 4.8 mm for 10 seconds. Three measurements were performed in each specimen. The average roughness was analyzed as Ra (μm): the arithmetic mean value of all heights (peaks and valleys) in a given roughness profile.
The statistical significance of the three properties analyzed was determined by the Kruskal-Wallis analysis of variance with a Bonferroni post-hoc test using the software Statistical Package for the Social Sciences (SPSS 25.0, Chicago, IL, USA). Statistical significance was set at p<0.05.
Results
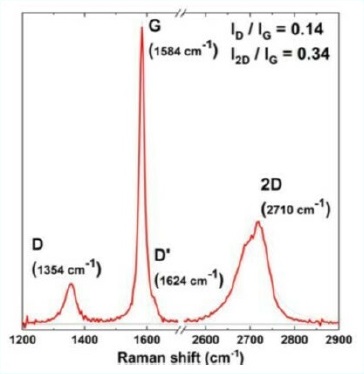
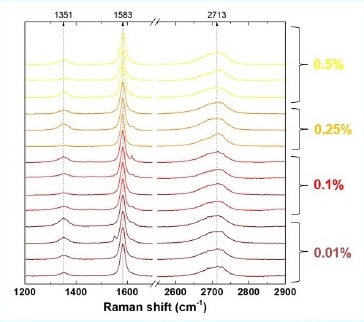
Raman spectroscopy was performed to identify and evaluate the quality and structural properties of the graphene according to the intensity, frequency, and line width of Raman modes G, D, and 2D. Two main peaks characterize the Raman spectra of monolayer graphene: the primary in-plane vibrational mode, G (~ 1580 cm^-1), and 2D (~2690 cm^-1) a second overtone of a different out-of-plane vibration, D (~1350 cm^-1) (Figure 4). Raman spectroscopy results showed that GNPs consisted mainly of few-layer graphene and that photopolymerized resin was primarily PMMA. Raman spectra indicated the presence of graphene in every sample and no evidente change in the typical graphene caused by its introduction into the resin system (Figure 5).
Table 1 shows the descriptive analysis results regarding hardness, flexural strength, and surface roughness per resin group. All graphene groups except the one with the lowest concentration influenced flexural strength negatively, with a statistically significant decrease in the 0.25wt% (p<0.028) and 0.5wt% (p<0.003) concentrations compared to the control (Figure 6). The two lowest concentrations of graphene (0.01wt% and 0.1wt%) increased the resin’s hardness, but only the lowest (0.01wt%) showed a statistically significant difference (p<0.043).
Table 1 Mean, standard deviation, minimum and maximum values of hardness, flexural strength, and surfasse roughness per resin group.
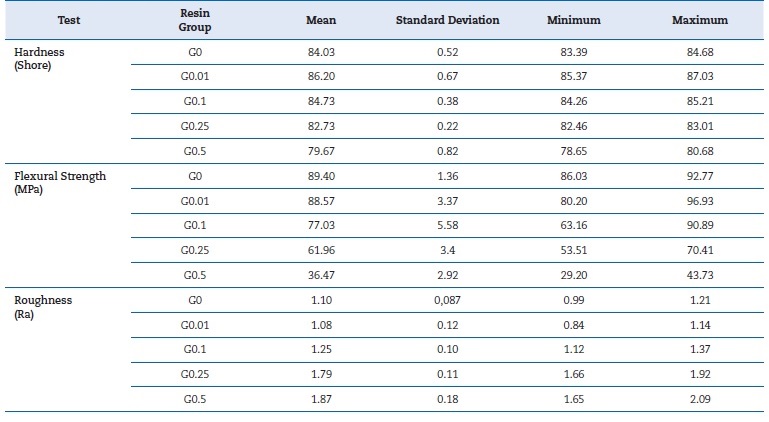
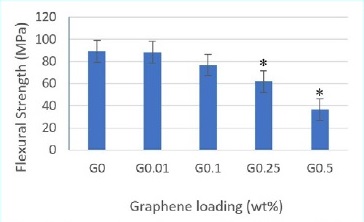
Figure 6 Flexural strength mean values by three-point bending test. Asterisks (*) indicate statistical significance compared to G0 (p<0.05)
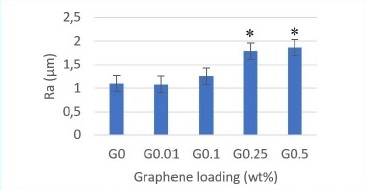
Higher concentrations (0.25wt% and 0.5wt%) had the opposite effect, with the 0.5wt% concentration causing a statistically significant decrease in hardness (p<0.022) (Figure 7). Surface roughness increased with the increase of graphene concentration, with statistically significant differences in the 0.25wt% (p<0.006) and 0.5wt% (p<0.005) concentrations (Figure 8).
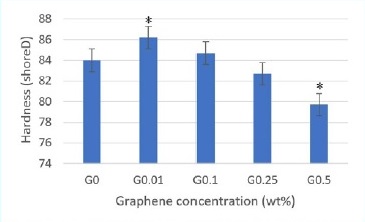
Figure 7 Hardness shore D mean values. Asterisks (*) indicate statistical significance compared to G0 (p<0.05)
Discussion
The mechanical properties of dental materials play a crucial role in their clinical performance and are strongly related to both processing and composition. Improving resistance by enhancing acrylic resins’ mechanical properties is an important subject that has hardly been investigated.49,50 Some studies,51-61 investigated graphene-reinforced PMMA dental resins, but very little research has focused on vat polymerization for resin’s reinforcement with graphene for biomedical applications.57
An acrylic prosthesis’ flexural behavior is one of its most important mechanical properties. In the present investigation, incorporating graphene in concentrations higher than 0.1wt% affected flexural strength negatively. This finding agrees with two investigations that verified that graphene did not improve the resin’s flexural properties.52,56 In turn, Lee et al.54 found that incorporating only 0.5wt% of graphene oxide (GO) enhanced flexural strength significantly, while higher GO concentrations (1wt% and 2wt%) showed a decrease in flexural strength values. These contradictory results may derive from the different methods used in these studies to add graphene to resin and to simulate the oral environment before the bending tests. Di Carlo et al.51 and Agarwalla et al.55 observed a significantly higher mechanical strength in the graphene-reinforced resin G-CAM, but the percentage of graphene was unknown, which may explain the different results. In a recente study, Punset et al.60 revealed that G-CAM’s graphene concentration was 0.027% by weight - a low concentration. These findings agree with the present study’s results, as a low graphene concentration (0.01wt%) provided a flexural strength similar to that of neat resin. Other studies have shown a greater improvement in polymers’ mechanical properties with low graphene concentrations.61,62 An et al.61 even demonstrated that flexural strength worsened at graphene concentrations greater than 0.1wt%.
Hardness indicates a material’s extent of resistance to plastic deformation.63,64 Lee et al.56 evaluated this mechanical property in a conventional PMMA dental resin reinforced with graphene at 0.25wt%, 0.5wt%, 1wt%, and 2wt% concentrations and verified that adding graphene significantly increased the resin’s hardness. Agarwalla et al.55 and Punset et al.60 studied the influence of graphene reinforcement in the PMMA pre-polymerized dental resin G-CAM and found that hardness was similar to neat PMMA. In the present investigation, the resin’s hardness increased at graphene concentrations of 0.01wt% and 0.1wt% but decreased and was lower than the control’s in higher concentrations (0.25wt% and 0.5wt%). These different results may be explained by the diferente kinds of resin used in the three studies, which entail different processing techniques and, likely, a different influence of graphene.
Furthermore, there is a lack of knowledge about the influence of graphene on the UV polymerization reaction. One study reported reduced maximum curable thickness per scan when graphene was incorporated into photocurable resins.65
The addition of nanomaterials into the resin causes the photo-initiator and the nanomaterial to compete for light absorption.
This competition usually leads to a less effective UV polymerization process, which may explain the poor mechanical results obtained in the present investigation with graphene concentrations greater than 0.1wt%. Lopez de Armentia et al.57 revealed that incorporating 0.1wt% of graphene into the photocurable resin caused a notable negative effect on printability, potentially influencing the quality of the printed object.
Surface roughness is a factor of clinical relevance since it directly or indirectly affects microbial plaque’s retention in tissues in contact with the materials, increasing the risk of surface fatigue and decreasing their biocompatibility.66,67In the present investigation, graphene increased the resin’s surfasse roughness. This result agrees with other studies,55,58and may result from graphene’s struggle to disperse in a polymer matrix, which may cause agglomerates of increased graphene concentration.
This study’s null hypothesis was rejected because statistically significant differences were verified between the neat PMMA dental resin and the graphene-reinforced resins in the different properties studied: flexural strength, hardness, and surface roughness.
One limitation of this in vitro study could be that the mechanical tests were not performed in conditions similar to the oral cavity. It is important to understand the effect of graphene’s presence in resin in the long term while in function.
We aim to repeat these mechanical tests after thermocycling cycles in future studies. More studies are required to understand the fracture and deformation mechanisms better and consolidate these experimental observations.
Conclusions
Considering the limitations of this study, we conclude that low concentrations of graphene seem to improve the resin’s hardness without compromising its surface roughness and flexural strength. Higher concentrations of graphene tend to worsen these properties. More studies are required to evaluate other conditions and different parameters.


