INTRODUCTION
Although expectancy has increased, aging is accompanied by changes in nutritional status that can lead to undernutrition and sarcopenia (1). Undernutrition can increase with age (2) and is associated with reduced protein 2 intake (3) and damage to muscle mass (4, 5). Sarcopenia has emerged as an aging syndrome characterized by dependence, the main alteration of which is the progressive and generalized loss of muscle mass, function and performance (2,6). These two conditions can overlap, as they are both associated with damage to musculature, but they are conceptually (2, 7) distinct. That is, an older adult may be both sarcopenic and undernourished. Undernutrition has been and is widely studied, and therefore standardized diagnostic tools for undernutrition have been established (8 - 10). In contrast, although there is a substantial amount of literature on sarcopenia, this syndrome lacks standardization for diagnosis (11, 12). In this context, there are at least six published criteria guiding the diagnosis of sarcopenia (6, 13 - 16). Both undernutrition and sarcopenia should be identified early, since both are associated with impairments in functional capacity, reduced life expectancy, and increased complications, hospitalizations and dependency (2, 16 - 18). The prevalence of undernutrition among the older adults ranges from 1 to 24.6% (19, 20), with an increase to 50% in the elderly in rehabilitation, 20% in those in long-term homes and 40% in those who are hospitalized. In comparison, 14 to 33% of the older adult in longstay homes, 1 to 29% of those in the community and 10% of those hospitalized (17) are sarcopenic. In relation to both diagnoses, one study showed a higher prevalence of sarcopenia in elderly subjects with malnourishment (82.3 vs. 45.1%; p=0.03) (21). This result reinforces the notion that undernutrition and sarcopenia are overlapping entities compromising muscle quantity and quality. As muscle mass comprises about 40% of body composition, its decline is not only part of senescence, but leading to increased complications and worse outcomes (3, 22). Determining the association of muscular decline between undernutrition and sarcopenia may help in the optimization of treatment and provide new insights about these two syndromes. Thus, the aimed of this study was to investigate the prevalence of sarcopenia according to five cut-off points for muscle strength and the association with undernutrition in community-dwelling older adults.
METHODOLOGY
This was a cross-sectional study including 321 older adults (≥ 60 years old) of both sexes, attending four senior community center (SCC) in the city of CuiabáMT Brazil. The elderlies were invited to participate of the study and those who signed an informed consent, entered the study. Those who presented any physical or mental disability, lower or upper limb oedema were excluded. Any health condition present during examination that might hinder the tests was also included as exclusion criteria. The study met the resolution CNS 466/2012 and was approved by the Research Ethics Committee (CAAE 49946215.6.0000.554). The main variable was the prevalence of sarcopenia and its association with undernutrition. Age, sex, body weight (kg), chronic diseases (CD), grip strength (GS; kg), calf circumference (CC; cm), frequency of weekly physical activity and nutritional status by mini nutritional assessment-short form (MNA-SF®) (23) were collected. For the diagnosis of sarcopenia, lowest muscle strength (24) (dominant hand) was determined (hydraulic dynamometer - Saehan® Masan, Corea) by the arithmetic mean of three measurements according to the cut-off points of five criteria (Table 1) and by the lowest muscle mass obtained by CC (≤33 cm female and ≤34 cm male) (6).
STATISTICAL ANALYSIS
The Kolmogorov-Smirnov test was initially applied to determine the normality of the data. The data are presented in number (N) and percentage (%). Data that was normally distributed are presented in means (M) and standard deviations (±SD) and those distributed nonnormally are presented in median (Md) and interquartile range (IQR). The Chi-square test was used to assess the association of undernutrition with the prevalence of sarcopenia. Older adults were categorized as nourished (MNA-SF® = 12 to 14 points) and undernutrition (MNASF ® = 0 to 11 points). The Student's or Mann Whitney's t-test was applied according to normal data. The Chi-square test with Yates correction or Fisher's exact was used to compare the prevalence of older adults with sarcopenia as well as the prevalence of who had both sarcopenia and undernutrition. A statistical significance limit of 5% (p<0.05) was established. The Statistical Package for the Social Sciences 20.0 (SPSS Statistics; IBM, Armonk, NY, USA) was used for statistical analysis.
RESULTS
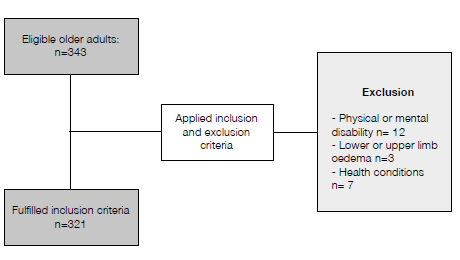
From the 343 eligible in-older adults, 321 fulfilled study inclusion criteria (Figure 1). The characteristics of 321 the older adults are described in Table 2. Seventy-nine (24.7%) were undernourished, and 14 (4.5%) had low CC. Older undernourished adults showed a reduction in GS [23.2 (19.5-28.1) vs. 25.8 (21.6-30.7) kg; p=0.013) and CC (34.8±3.7 vs. 37.1±3.5cm; p<0.001) when compared to nourished. Sixty-three
Table 1: Cut-off points of grip strength according to five criteria

AWGS: Asian Working Group for Sarcopenia 2019
ESCEO: European Society for Clinical and Economic Aspects of Osteoporosis,
Osteoarthritis and Musculoskeletal Diseases 2019
EWGSOP: European Working Group on Sarcopenia in Older People 2010
EWGSOP2: European Working Group on Sarcopenia in Older People 2019
GS: Grip strength
SDOC: Sarcopenia Definitions and Outcomes Consortium 2020
Table 2: Clinical and demographic characteristics of older adults
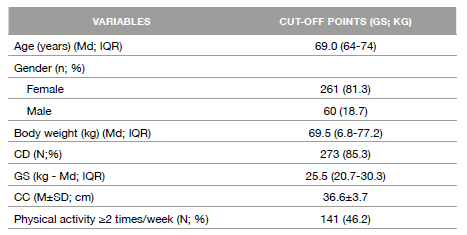
CC: Calf circumference
CD: Chronic diseases
GS: Grip strength
Values expressed as mean and standard deviation (M±SD); number and percent (n; %) or median and interquartile range (Md; IQR) according to data distribution.
Table 3: Prevalence of older adults with low grip strength according to five criteria
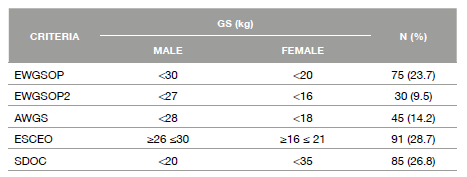
AWGS: Asian Working Group for Sarcopenia 2019
ESCEO: European Society for Clinical and Economic Aspects of Osteoporosis,
Osteoarthritis and Musculoskeletal Diseases 2019
EWGSOP: European Working Group on Sarcopenia in Older People 2010
EWGSOP2: European Working Group on Sarcopenia in Older People 2019
GS: Handgrip strength
SDOC: Sarcopenia Definitions and Outcomes Consortium 2020
Table 4: Association of undernutrition with sarcopenia, grip strength and low muscle mass
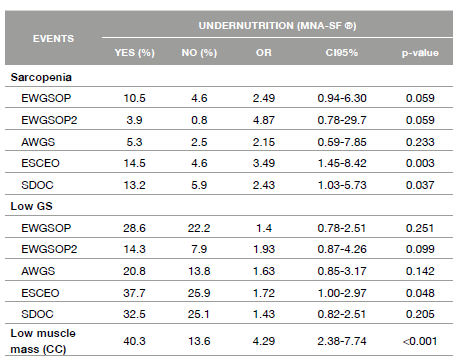
AWGS: Asian Working Group for Sarcopenia 2019
AWGS: Asian Working Group for Sarcopenia 2010
CC: Calf circumference
CI: confidence interva
ESCEO: European Society for Clinical and Economic Aspects of Osteoporosis,
Osteoarthritis and Musculoskeletal Diseases 2019
EWGSOP: European Working Group on Sarcopenia in Older People
EWGSOP2: European Working Group on Sarcopenia in Older People 2019
GS: Grip strength
MNA-SF®: mini nutritional assessment-short form
OR: odds ratio
DISCUSSION OF THE RESULTS
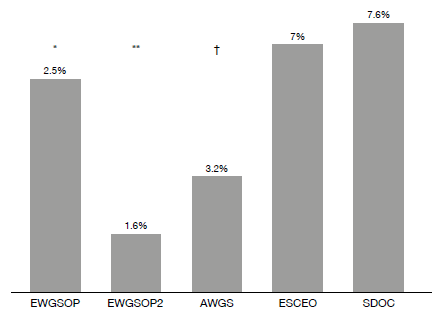
The prevalence of sarcopenia ranged from 1.6 to 7.6%, according to cut-off point for GS. This wide range prevalence gives rise to the question of which low muscle strength parameters most accurately reflect the presence of sarcopenia in older adult. Regardless, despite the difference in the diagnosis of sarcopenia, we consider this prevalence relatively low. This can be explained by 46.2% of older adults reported physical activity twice or more of week. Several studies have shown that physical activity is associated with a lower prevalence of sarcopenia (25 - 29). A study conducted among Japanese communitybased older adults demonstrated that 7% were sarcopenic by AWGS criteria (30).
A systematic review including studies with EWGSOP, EWGSOP2 and AWGS criteria showed a prevalence of sarcopenia of 10% among older adults (31). In Brazil, Alexandre et al., (32) showed that 9% of healthy older adults were sarcopenic by EWGSOP criteria. All these studies demonstrated greater results than those we found. Evaluating cut-off points, there was a higher prevalence of sarcopenia when using ESCEO and SDOC criteria. The cut-off points established by these two criteria are higher, which explains a higher percentage of subjects with sarcopenia. There are studies in the literature comparing the prevalence of sarcopenia using EWGSOP and EWGSOP2 criteria (33 - 36); there was a lower prevalence of sarcopenia in the 2019 update, in which the cut-off points were reduced. This variety of diagnostic criteria makes it difficult to compare the results (37). Also, the cut-off points were obtained in studies with different populations than those in Brazil. This prompts the question of what is the best cut-off for Brazilian population.
A diagnostic method for sarcopenia with universal criteria and cut-off for each population needs to be defined. Certainly, the criteria and cutoff cannot be used indiscriminately, since the same individual can be sarcopenic by one method and not by another. This creates confusion as to determining who is or is not sarcopenic. Regarding nutritional status in the present study, 24.7% of the older adults were classified with undernutrition. According to Crichton et al., (19) the prevalence of undernutrition among older adults in the community ranged from 0.8 to 24.6%. Using the hypothesis that undernutrition and sarcopenia overlap, our data demonstrated that the undernutrition showed lower muscle strength and lower muscle mass when compared to nourished. Undernutrition is a strong predictor of sarcopenia (38 - 40); and can it be inferred that sarcopenia "is contained" in undernutrition? However different the etiology of loss of muscle mass and function may be, overlapping is possible (18, 41). Constant modifications occur in both syndromes, which justifies periodic revision of the definitions and cutoff (42), and the presence of one condition can warrant the evaluation of the other one (43). In this context, it should be noted that one of the main characteristics of undernutrition is involuntary weight loss, but regardless of this loss, undernutrition results in muscle damage, and therefore its assessment should be instituted (44, 45). Twenty years after sarcopenia was conceptualized, research involving this syndrome is increasing, as is understanding of the relevance of muscle function as a predictor of outcomes (16). Muscular function is an evaluation that is more relevant in the evaluation of sarcopenia, but it is not part of the widespread nutritional evaluation tools; this may be one of the explanations for the discrepancies in the results. In addition, there is a lack of precision in the measurement techniques and variability of the cut-off points for the worst or best muscle function (42). On the other hand, even considering the cut-off for males and females, low GS still varies with age, ethnicity, presence of disease and other factors (45). However, regardless of the cut-off, less than 5% of elderly subjects showed overlap of the two conditions. That is, although overlapping, our results showed that it was very low in population of 24.7% of olderundernourished adults. Based on this overlap, the cut-off for GS using ESCEO and SDOC criteria was associated with nutritional status; that is, by ESCEO and SDOC criteria, older undernutrition adults showed more than three and two times, respectively, the chance of sarcopenia. In this context, we found that only low GS categorized by ESCEO was associated with the diagnosis of undernutrition. Undernutrition and sarcopenia are known to be independently associated with functional decline, lower quality of life and higher mortality (46). Kirk et al. showed that 62.4% of older adults had low GS, and 64.3% had low performance. The prevalence of sarcopenia by SDOC criteria was 45.5%. Furthermore, the results showed that the presence of sarcopenia was positively associated with undernutrition (OR 3.21) (47). Another study (48) compared the prevalence of sarcopenia-based GS cut-off points. The results showed a lower prevalence (10.2%) in five of the seven other methods when the EWGSOP2 cut-off was used. In this same study, based on the SDOC criteria, the prevalence of sarcopenia was almost double, that is, 19.4% amongst elderlies. Thus, it is clear that failure to carry out these assessments may result in neglect of nutritional treatment, since an older adults may be sarcopenic and not undernutrition or vice versa. Undernutrition and sarcopenia have the same phenotypically differing only by the causes (49). Five basic mechanisms are present in both: insufficient intake, inflammation, low muscle strength, hormonal alteration and neuromuscular atrophy. These mechanisms influence undernutrition and sarcopenia to varying degrees. Therefore, it is not surprising that these conditions overlap in their presentation, making it difficult to define the clinical syndrome present. Accordingly, the harmonization of international terminologies, definitions and diagnostic criteria for both, as well as the early implementation of therapeutic approaches as part of the standard of care will require an effort that should not be delayed (41). These actions are justified, since these conditions are often not identified and treated in community and hospital environments. Consequently, there is an increase in hospitalizations, complications and costs (41, 45, 48).
On the other hand, muscle mass assessment is essential for the screening and sarcopenia diagnosis (50). However, a limitation ofthe current investigation was the use of CC to assessment muscle mass. The calf muscle is influenced by the amount of subcutaneous fat present in the site, which may alter the results (51). Although computerized tomography and magnetic resonance imaging are considered the golden standard for estimating muscle mass, these tests are expensive, difficult to perform and, furthermore, they expose individuals to radiation (13). Furthermore, anthropometric such CC measures are good alternative because of low-cost and non-invasive mechanisms, while also estimate skeletal muscle mass (13, 52, 53). In this context, CC is widely used to assess sarcopenia and significantlycorrelated with muscle mass (13). CC measurement is simple, easy and universally accepted to estimate muscle mass in the older adults (54). Thus, the use simple tests as CC to evaluate skeletal muscles in the early screening of sarcopenia is fundamental in elderly living in community. Another important point is that this muscle can be measured in healthy individuals or in bedridden. Taking all together, CC is as an interesting tool to assess muscle measurement with good sensitivity to sarcopenia and thus may be useful for the screening older people especially in primary health care (55, 56). Thus, owner results showed that there is a wide difference in the prevalence of sarcopenia using different cut-off for GS, and an association of sarcopenia with undernutrition was only observed when higher cut-off points were used. Did the majority of the older undernourished adults not show any losses in strength and muscle mass? Studies on which diagnostic tests are the best tools and what is the best criteria for sarcopenia are necessary to elucidate these gaps.


