Introduction
The evolutionary trajectory of the human lineage is a complex narrative marked by both successful adaptations and episodes of extinction. Neanderthals, a close relative of Homo sapiens, thrived for hundreds of thousands of years before bafflingly disappearing around 40,000 years ago 1-3 . Their legacy continues to captivate researchers, with their distinctive physical features sparking numerous inquiries.
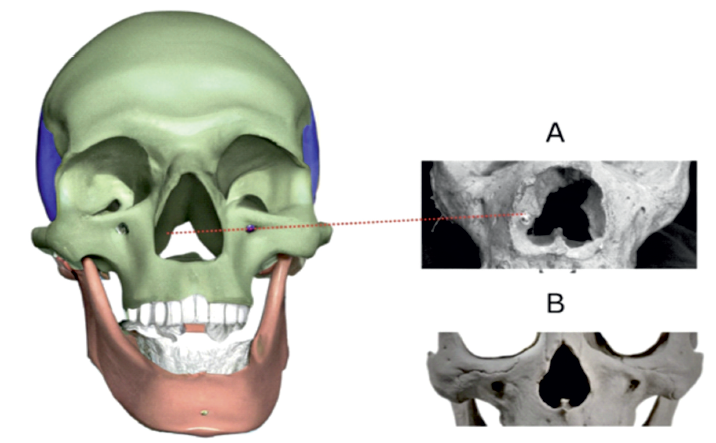
One intriguing aspect of Neanderthal anatomy lies in their nasal structure 4-8. These includes a well-developed, vertically oriented medial projection on the internal nasal margin (Figure 1), a pronounced medial swelling of the lateral nasal wall projecting posteriorly, and the absence of an ossified roof over the lacrimal fossa. This peculiar morphology has powered scientific curiosity, prompting questions about its potential adaptive significance 4-9.
Neanderthals inhabited glacial Europe and western Asia, facing harsh climatic conditions characterized by cold temperatures and dry environments. Many argue that these environmental pressures likely played a significant role in shaping their nasal morphology 6,7. Adaptations to the nasal morphology and function could have been critical for survival. These adaptations possibly aimed to improve air conditioning, facilitating the warming and humidification of inhaled air 10. Higher nitric oxide mixing with pulmonary oxygen diffusion facilitation is another noted possibility 7. Another potential adaptive explanation lies in the need for a higher airflow capacity through the nasal cavity. Increased nasal volume could have facilitated greater air intake, potentially addressing higher metabolic demands 5. Nevertheless, some dispute this idea pointing to genetic drift as the most likely explanation for anatomical differences 11-13).
Understanding the evolutionary trajectory of craniofacial features in hominids holds significant value for various medical fields, including Otorhinolaryngology. This knowledge illuminates the functional adaptations that shaped humans´ facial anatomy over time. The primary objective of this study was to conduct compare craniofacial morphology in hominid fossils and modern Homo sapiens. Selective pressures that may have influenced form and function are discussed.

Figure 1 Medial crest (also known and crista turbinalis). A - Prominent bony projection (marked with red line) flank the inner opening of the nasal cavity in a Homo Neanderthalensis fossil. These structures extend upwards along the nasal walls for a variable distance (one-third to halfway) before expanding into broad, rounded formations that project medially into the nasal cavity. B - comparison with a Homo Sapiens skull specimen. (copyright©, Francisco Sousa).
Material and Methods
Sample enrollment
A multifaceted approach was employed, utilizing data from both paleoanthropological literature and modern medical imaging (Figure 2). Data collection and analysis involved three main steps.
Firstly, a paleoanthropological literature review was performed, allowing for identification and data collection on hominid craniofacial features. Fossil specimens of Homo heidelbergensis and Homo neanderthalensis that were identified as adults by expert paleontologists were included (Figure 2). This determination was based on established criteria for age estimation in hominid fossils such as dental eruption and wear, cranial suture closure and pelvic morphology. The inclusion of Homo Heidelbergensis in the sample stemmed from evidence placing Homo heidelbergensis as the last common ancestor of modern humans and Neanderthals 14. The species classification of the Hominid fossils was defined based on the Smithsonian National Museum of Natural History classification for each specimen (available at: https://humanorigins.si.edu/evidence/human-fossils/fossils).
Secondly, to set a reference point for Homo Sapiens morphology, a database of paranasal sinus computed tomography (CT) scans from living adults was utilized. This database included only scans from individuals with no history of facial trauma or sinonasal disease. The exams were obtained by GE® or SIEMENS® tomographs and measurements were performed by SECTRA® software using axial, coronal and sagittal sections.
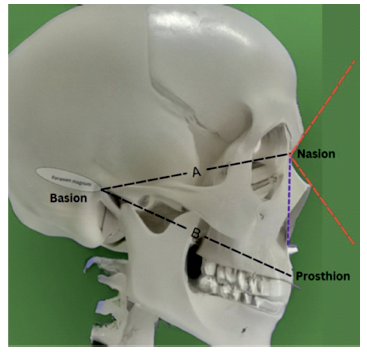
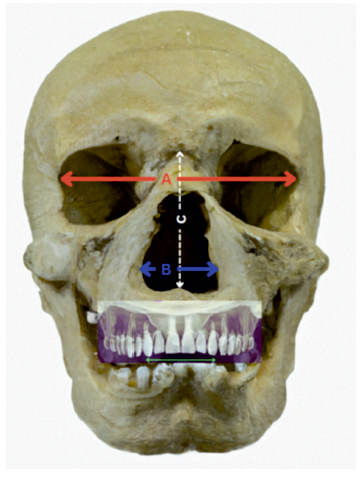
The measurements obtained on hominid fossil and modern human CT scans were then pooled in a common dataset. For each specimen, data included nasofrontal angle, nasal height, nasal breadth, basion-nasion and basion-prosthion distances, maxillary intercanine distance, choanal width, biorbital length and calculated nasal index. Lastly, statistical analysis allowed for comparison between groups. Figure 3andFigure 4 depict relevant anatomical landmarks and measurements, excepting choanal width. Choanal width measurement was done at the reference level between both pterygoid plates in the axial plane. Nasal index was obtained by dividing the width to the height of the nose and multiplying by 100 to be expressed in percentage.

Figure 3 Sagittal section landmarks and measurements. Black line A - Basion-Nasion distance; black line B - Basion-Prosthion distance; red lines - delimitate nasofrontal angle; purple line - nasal height. Definitions - Nasion: the most anterior point of the frontonasal suture that joins the nasal part of the frontal bone and the nasal bones. It marks the midpoint at the intersection of the frontonasal suture with the internasal suture joining the nasal bones. Nasofrontal angle: The angle formed at the juncture where the line from the glabella to the nasion crosses the line from the nasion to the tip. In modern man should be between 115-130 degrees and is usually greater in females than males. Basion: midpoint on the anterior border of the foramen magnum. Prosthion definition: the most forward projecting point of the anterior surface of the upper jaw, in the midsagittal plane. Nasal height: the height of the nose from the nasion to the nasospinale (midline anatomical point where midsagittal plane intersects inferior margin of nasal aperture). (copyright©, Francisco Sousa).

Figure 4 Coronal section landmarks and measurements. Red line (A) - biorbital length; Blue line (B) - nasal breadth; white line (C) - nasal height; Green line: intercanine width; Definitions - Biorbital length: a measure taken between the outer borders of the bony orbits. Nasal breadth: the distance between the two most lateral points on the rim of the nasal opening. Nasal height: the height of the nose from the nasion to the nasospinale; Intercanine width: The distance between cusp of the right and left permanent canines. (copyright©, Francisco Sousa).
Ethics
The design complies with the Declaration of Helsinki´s ethical standards. De-identified data from a prior institutional study with informed consent was utilized for this analysis.
Statistical analysis
Statistical analyses were conducted using IBM SPSS Statistics 29 software. Descriptive statistics were employed, presenting categorical variables as percentages and continuous variables as means and standard deviations. The Shapiro-Wilk test confirmed normal distribution for continuous variables. Bivariate analysis explored asymmetries in measurements between groups by means of independent t-test. Pearson Chi-square/ Fisher´s tests (95% confidence intervals) were used for categories and Spearman´s test for continuous variables. To address potential confounding variables in the subsequent multivariate analysis, a multiple imputation regression technique was implemented. This facilitated the application of both binomial logistic regression and multinomial logistic regression (MLR). MLR was chosen as the dependent variable, "group" (categorized as Homo sapiens, Homo neanderthalensis, and Homo heidelbergensis), had three unordered categories. Additionally, the test of parallel lines indicated a violation of the proportional odds assumption, making MLR the most suitable method. All reported p-values are two-tailed, with a significance level set at p ≤ 0.05.
Results
Population
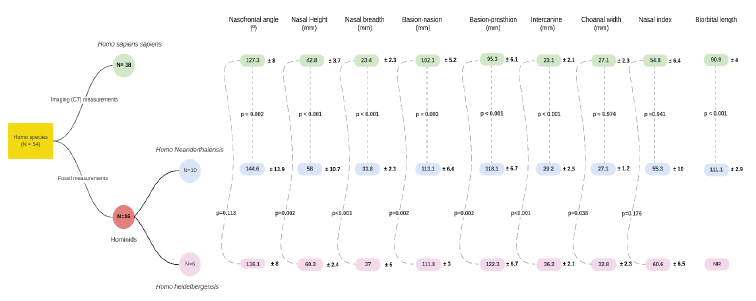
A total of 54 patients were enrolled, 25 males and 28. 16 hominid fossils (HF) were included: 10 Homo Neanderthalensis (HN) and 6 Homo Heidelbergensis (HH) - accounting for 29,6 % of the sample. According to literature, 10 fossils were assumed as male (62,5 %) and 6 fossils as female (37,5 %). 38 alive human CT scans were included [Homo sapiens (HS)] - accounting for 71,4 % of the sample. 16 were male (42,1 %) and 22 female (67,9%). A general description of the main variables is displayed on Table 1, comparing hominids as a whole class against modern humans. Detailed description and analysis for each groups of Homo species (HH, HN and HS) is found on Figure 5.
Table 1 Main variables description and bivariate analysis: hominids versus modern humans
| Feature | Hominids | Modern Humans | p-value |
| Sample Size (n) | 16 | 38 | - |
| Sex Distribution | 10 M / 6 F | 16 M / 22 F | 0.171 |
| Basion-Nasion Distance (mm) | 112.6 ± 5.4 | 102.1 ± 5.2 | < 0.001 |
| Basion-Prosthion Distance (mm) | 119.6 ± 6.7 | 95.3 ± 6.1 | < 0.001 |
| Nasofrontal Angle (degrees) | 139.8 ± 10.8 | 127.3 ± 8.0 | 0.022 |
| Intercanine Dimension (mm) | 31.8 ± 4.2 | 23.1 ± 2.1 | < 0.001 |
| Biorbital Length (mm) | 111.1 ± 2.9 | 90.9 ± 4.1 | < 0.001 |
| Nasal Breadth (mm) | 34.9 ± 3.7 | 23.4 ± 2.3 | < 0.001 |
| Nasal Height (mm) | 59.4 ± 5.7 | 42.8 ± 3.7 | < 0.001 |
| Choanal Width (mm) | 29.6 ± 3.4 | 27.1 ± 2.3 | 0.109 |
| Nasal Index (%) | 58.3 ± 7.9 | 54.8 ± 6.4 | 0.307 |
M = Male, F = Female; Values are presented as Mean ± Standard Deviation; p-value indicates statistical significance between Neanderthal and Modern Human values. A value of less than 0.05 is considered statistically significant.
Craniofacial Features in Hominids Compared to Modern Humans
Further analysis was performed to adjust for the effect of sex and explore morphological differences between hominids and modern humans (Table 2). By using a Binary logistic regression adjusting for sex, it was found that the odds of being a Hominid increased by 14 % for each unit increase in nasofrontal angle (95% CI (1.115, 20.403)), 23,5 % for each unit increase in biorbital length and 29,7 % for each unit increase in nasal height. When integrated in this model, no other variables sustained significant associations (Table 2).
Table 2 Results of binary logistic regression taking “Hominid” as the outcome of interest
| Craniofacial measurements | β 1 | S.E β2 | Wald | OR (Exp(B)) | [95% CI] for OR | p-value | ||
| Lower | Upper | |||||||
| Basion-Nasion | -0.091 | 0.078 | 1.348 | 0.913 | 0.783 | 1.064 | 0.246 | |
| Basion-Prosthion | 0.128 | 0.084 | 2.311 | 1.137 | 0.964 | 1.342 | 0.128 | |
| Nasofrontal angle | 0.131 | 0.042 | 9.677 | 1.140 | 1.050 | 1.238 | 0.002 | |
| Intercanine distance | 0.144 | 0.150 | 0.924 | 1.155 | 0.861 | 1.548 | 0.336 | |
| Biorbital length | 0.211 | 0.103 | 4.185 | 1.235 | 1.009 | 1.512 | 0.041 | |
| Nasal breadth | 0.031 | 0.128 | 0.057 | 1.031 | 0.803 | 1.324 | 0.811 | |
| Nasal height | 0.260 | 0.099 | 6.918 | 1.297 | 1.068 | 1.574 | 0.009 | |
| Sex | 1.562 | 0.742 | 4.437 | 4.769 | 1.115 | 20.403 | 0.035 | |
| Constant | -59.637 | 10.901 | 29.928 | 0.000 | <0.001 | |||
OR - Odds Ratio, [95% CI] - lower and upper bound of 95% confidence interval; 1 - β stands for unstandardized regression coefficient; 2) Standard error for unstandardized regression coefficient; 3) Exp(β),” or the odds ratio, is the predicted change in odds for a unit increase in the predictor. The “exp” refers to the exponential value of β; Bold for p values translating statistical significance
Species membership: craniofacial measurement analysis
A multinomial logistic regression was performed to model the relationship between predictor variables (various craniofacial measurements and sex) and membership in the three groups (HH, HN and HS). With the addition of the predictor variables, the fit between the model including only the intercept and data improved, χ2 (16, N = 148) = 681.9, Nagelkerke R2 = 0.883, p < .001. HN was the reference group. As a result, each predictor contains two parameters: one for predicting HH membership and one for predicting HS group membership. This model successfully classified 91.1% of the HN patients, 99.8 % of the HS patients and 61.7 % of HH patients. The overall correct classification rate was 94.2%. Table 3 displays the parameter estimates.
When comparing HN group to HH, 2 predictors showed significance (see Table 3 ). The odds of being in HN group rather than the HH group were 20 % higher for each standard deviation (SD) increase in basion-nasion (OR: 0.787, p = 0.006). Conversely, the odds of being in HN group were 60 % decreased for each SD increase in intercanine distance (OR: 1.612, p < 0.001).
When comparing the HN to HS, 4 predictors exhibited significant parameters (see Table 3). The odds of being in the HN group rather than HS group were around 10 % higher for each SD increase in nasofrontal angle (OR: 0.903, p =0.028), 20 % higher for each SD increase in basion-prosthion (OR: 0.808, p =0.025) and biorbital length ( OR:0.801, p=0.041) and about 25 % for a SD increase in nasal height.
Table 3 Parameter Estimates Contrasting Homo Neanderthalensis versus each of the other groups
| Predictor | Neanderthalensis vs. | B | OR | p-value |
| Basion-Nasion | Heidelbergensis | - 0.239 | 0.787 | 0.006 |
| Sapiens | - 0.019 | 0.982 | 0.841 | |
| Basion-Prosthion | Heidelbergensis | - 0.101 | 0.904 | 0.127 |
| Sapiens | - 0.213 | 0.808 | 0.025 | |
| Nasofrontal angle | Heidelbergensis | 0.030 | 1.031 | 0.231 |
| Sapiens | -0.102 | 0.903 | 0.028 | |
| Intercanine distance | Heidelbergensis | 0.477 | 1.612 | < 0.001 |
| Sapiens | 0.150 | 1.162 | 0.365 | |
| Biorbital length | Heidelbergensis | -0.068 | 0.935 | 0.282 |
| Sapiens | -0.222 | 0.801 | 0.041 | |
| Nasal breadth | Heidelbergensis | -0.039 | 0.962 | 0.692 |
| Sapiens | -0.089 | 0.914 | 0.527 | |
| Nasal height | Heidelbergensis | -0.026 | 0.974 | 0.566 |
| Sapiens | -0.289 | 0.749 | 0.006 |
OR = odds ratio associated with the effect of a one standard deviation increase in the predictor. Orange for statistical significance between Homo Neanderthalensis and Homo Heidelbergensis. Blue for statistical significance between Homo Neanderthalensis and Homo Sapiens.
Discussion
The investigation of human evolution is enriched by examining the anatomical variations across hominid lineages. As such, the primary objective of this study was to analyze craniofacial morphology to identify differences between hominids and modern humans, particularly those involving the nasal cavity. Secondarily, a comparison within hominid species was also achieved (HH vs HN), allowing for an extended chronological perspective of anatomical evolution.
The craniofacial analyses revealed distinct morphological differences between groups. Notably, individuals classified as Homo heidelbergensis and Homo neanderthalensis exhibited significantly larger nasofrontal angles, biorbital lengths, and nasal heights compared to modern humans (Homo sapiens). Basion-Prosthion distance was also significantly higher in HN. Results confirmed that such traits may be particularly useful for distinguishing between ancestral and modern human groups.
The multinomial logistic regression model also pinpointed specific morphological differences within ancestral groups, allowing for a broader time prospection. Compared to Homo heidelbergensis, Homo neanderthalensis exhibited a larger basion-nasion distance and a smaller intercanine distance. Since HH proceeded HN in extinction taxa, such findings suggest a trend towards prognathism, midfacial projection and higher vertical dimensioning in later pre-modern Homo15. Supporting the discriminatory power of these measurements, the classification model achieved a high success rate in assigning individuals to their respective hominid groups (HH, HN, HS). This reaffirms the legitimacy of craniofacial methods to differentiate between Homo species 16).
Craniofacial variations may translate distinct selective pressures occurring throughout millions of years 17. Not only encephalization and bipedalism 18, but also breathing, diet and vocalization needs may have shaped human face 15,17,19. Anatomical changes associated with the evolution of language undoubtedly facilitated speech production in Homo Sapiens compared to other species. In fact, some evidence suggests limited vocal repertoire in Neanderthals compared to modern humans 20,21. However, the retracted jaw, smaller upper airway and higher hyoid with subsequent positioning of the pharynx, while potentially facilitating the production of a wider range of vocalizations, may have presented new challenges in modern humans 20,22,23: two of the most significant being obstructive sleep apnea 19,24 and choking/aspiration 23. This observed trade-off underscores the dynamic nature of craniofacial evolution, where adaptations for one function can have consequences for others.
Recent studies challenged the ideas that biomechanics and adaptative selection fully explain the unique facial structure of Neanderthals. Instead, some suggest that random evolutionary processes, such as genetic drift, may be more important factors in shaping craniofacial form 15. Alternatively, others propose that facial evolution resulted from integrated changes in brain development and cranial base shape during evolution. This perspective emphasizes the influence of brain size on the cranial base, which in turn would have affected facial conformation 15.
A noteworthy finding of this study is the absence of statistically significant differences in nasal index and choanal width between Hominid specimens and modern humans. This observation bolsters the notion that morphological asymmetries within the nasal cavity may be more directly linked to thermoregulatory requirements, such as air conditioning of inspired air, rather than serving to optimize airflow patterns. In fact, the medial projection within the Neanderthal nasal cavity (Figure 1) is theorized to play a role in air temperature regulation 7. It has been suggested as an autapomorphic feature in HN 8. Nevertheless, Franciscus9 argues against its diagnostic value in HN claiming that the bony rim in question, termed the crista turbinalis, has been documented in both modern humans and fossil Homo.
Additionally, some supported that Neanderthals have relatively larger paranasal sinuses 11. Increased craniofacial pneumatization was proposed as an adaptation to lower ambient temperatures. Nevertheless, a recent work evaluated HN volumes compared to its scaled craniofacial dimensions and refused this hypothesis 11. Although the lack of soft tissue in fossils hinders direct comparisons of breathing ability, researchers reconstructed HN and HS nasal cavities, including mucosal distribution. A computerized virtual model revealed more efficient air conditioning (warming and humidification) in HN, suggesting specific climate adaptation 25.
Another interesting avenue for exploration concerns the potential link between nasal morphology and olfactory function. Recent studies suggest nasal airflow patterns play a significant role in olfactory function. A narrower vestibule and a stronger airflow vortex within the nasal cavity may enhance odor detection, particularly for highly soluble odorants 26. This finding compels further investigation into the potential link between nasal anatomy, airflow dynamics, and olfactory sensitivity in Neanderthals, particularly considering the presence of the medial projection (Figure 1). Modern humans possess larger olfactory bulbs and wider orbitofrontal cortex, suggesting a potential evolutionary link to enhanced learning, social skills, and possibly roles for olfaction in cognition and behavior 18. Beyond the established focus on respiratory function, the evolving nasal morphology in hominids might also be linked to olfactory adaptations. One unconventional hypothesis proposes that the emergence of the external nose in early Homo facilitated stereo olfaction, enhancing their ability to navigate vast distances through improved odor detection 27. Future studies could investigate whether the observed differences in nasal cavity size or structure translate into variations in olfactory capabilities, potentially lending support to this intriguing theory. There are limitations in this study, beginning in the nature of the evidence. The scarcity of well-preserved fossil specimens restricted sample size. Furthermore, inconsistencies in measurement protocols across different studies introduce the possibility of bias. Adding to this complexity, analysis of modern humans relied on CT scans instead of skull specimens, which may have influenced measurements. While the same landmark points were utilized to minimize this discrepancy, methodological differences remain. Additionally, focus on specific measurements, while informative, offers a limited perspective. Incorporating a wider range of anatomical features could yield richer insights. Finally, the study design does not account for potential environmental variations across sample populations, a factor that likely influenced nasal adaptations.
Conclusion
This investigation into Homo craniofacial morphology, specifically nasal cavity structure, adds a narrative to human evolution. By comparing fossil specimens with modern humans, the study reveals distinct features linked to a fascinating shift in nasal function. Neanderthal nasal morphology stands out for its unique characteristics. Unlike the smaller, narrower noses of modern humans, Neanderthals possessed a larger, broader nose with a prominent medial crest. This finding suggests a significant environmental influence on facial anatomy. However, various explanations exist for such observations, and no single theory has yet garnered universal acceptance. This lack of consensus underscores the ongoing debate in this field. Further exploration of the hominid nasal morphology holds promise for not only deepening understanding of human evolution but also for potential applications in paleoenvironmental reconstruction and species identification.
Acknowledgments
We extend our sincere gratitude to Dr. Thomaz Fleury Curado, MD, PhD, of University Hospitals Cleveland Medical Center and Case Western Reserve University for his valuable insights into upper airway dynamics.
Conflict of Interests
The authors declare that they have no conflict of interest regarding this article.
Data Confidentiality
The authors declare that they followed the protocols of their work in publishing patient data.
Human and animal protection
The authors declare that the procedures followed are in accordance with the regulations established by the directors of the Commission for Clinical Research and Ethics and in accordance with the Declaration of Helsinki of the World Medical Association.


