


 English (pdf)
 Article in xml format
 Article references
 Send this article by e-mail
 Cited by SciELO
  Similars in
SciELO
Similars in
SciELO 
 Permalink
Introduction
Experts believe corrosion is inevitable 1,11. Due to the current prerequisites of MS use, its corrosion has been found to be one of the main concerns in industries, from previous studies. However, the application of an inhibitor to control metals corrosion is a suitable way of maintaining their structural strength. It was stated that the best method for corrosion protection is inhibitors, due to their low price 9. It has also been reported in literature that corrosion inhibition is the best value-effective mean of delaying the wear of industrial parts, and, in most cases, the two processes may enhance each other 12,13,26,29,42. The combination of corrosion and wear is known as tribocorrosion 23,45.
Research has been tailored to use green inhibitors that are biodegradable, inexpensive and eco-friendly in industries, for combating corrosion. Therefore, the use of natural plant-based extracts as corrosion inhibitors is actively supported, because they are environmentally friendly, and can supplement synthetic compounds.
Some of the extracts used for the green inhibitors include elephant grass, Ocimum gratissimum, barley grass, bitter Kola leaf 2,3-6,7, Pimenta dioica leaf 8, Chenopodium ambrosioides10, Gongronema latifolium14, Sidaacuta stem 15, Ananas comosus16, Napoleonaea imperalis17, Picralima nitida18, Geissospermum leavea19, Citrus aurantium20, peppermint oil 21, Morinda tinctoria22, Vernonia amygdalina24,28, Lavandula and Ricinus communis oil 25,32, Psidium guajava30, rubber leaf 33, groundnut leaves, Katemfe seed 34,35, Sapum ellipticum37, Pterolobium hexapetalum and Celosia argentea38, Azadirachta indica40, Aloe vera gel 41, Mansoa alliacea43Mauclea latifola44 and orange zest 46. In addition, 27 revealed that it is important to achieve a fresh class of low toxicity, eco-friendly and high reliability inhibitors. Compounds containing N, S or O are recognized as strong acid corrosion inhibitors 4. Non-conventional materials used as inhibitors have already spurred studies on environmentally sustainable inhibitors that use agricultural waste, because they are readily available, biodegradable and antioxidant 6.
Many researchers have used statistical methods, like RSM, for optimizing independent variable factors, such as inhibition C, T, time and corrosion, in order to secure optimal expected responses, such as WL, CR and IE 4,24.
The aim of this study was to optimize LLE inhibitive properties against MS corrosion, in a HCl media, using RSM.
Materials and methods
Materials
MS (from the Mechanical Engineering Department at Landmark University in Omu-Aran, Kwara State, Nigeria) was mechanically cut into coupons with the dimensions of 2.5 x 2.2 cm. Inside the coupons, a 0.1 mm hole was drilled. Then, the coupons were degreased with acetone, dried, and stored in a moisture-free desiccator.
Methods
LLE preparation
Lemon leaves were collected in the Nigerian city of Omu-Aran, Kwara State. They were washed, drained and air-dried, before being pulverized with a blender. Soxhlet extraction was used to collect the oil from the lemon leaves, and ethanol was used as solvent. Ethanol was removed with a rotary evaporator, and LLE was stored in bottles, for later use.
Phytochemical analysis
LLE phytochemical analysis was carried out, in order to determine the existence of metabolites, such as alkaloids, saponins, tannins, and flavonoids, which would render an extract as a reactive inhibitor.
Experimental design
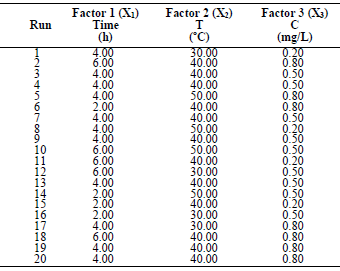
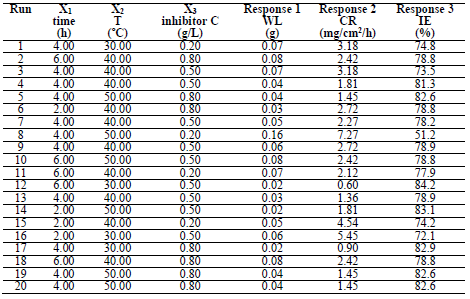
In order to determine the optimal LLE process parameters for MS in 1 M HCl, three variables were considered: X1, time; X2, T; and X3, inhibitor C, at three levels. CCD of 20 experimental runs was developed using the 3 operating variables. Table 1 is for variables and levels, while variables interactions are shown in Table 2.
Table 1 Experimental range of LLE on MS in a 1 M HCL solution of the independent variables, with factor levels for the inhibition.
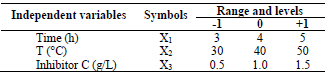
For the three variables, the matrix was varied at 3 levels (-1, 0 and +1). This methodology was adapted from 35-37. Software used to analyze the data was Design Expert 6.0.8. The mathematical empirical model is defined as Eq. 1.
 ***
***
where Y is the response or dependent variable, X1 and X2 are the independent variables and B0, B1, B2, B11, B22 and B12 are R2. RSM theory and applications are highlighted in literature 39.
Gravimetric measurements
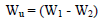
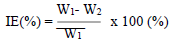
WL measurements were conducted via the predicted variable interactions. WL (average weight), CR and IE were calculated using Eqs. 2, 3 and 4.
 ***
***
where W1 and W2 are the weight before and after immersion, respectively.
 ***
***
where r is CR in g/cm2/h, A is the surface area in cm2, and t is the time in h.
 ***
***
Surface characterization
MS corrosion inhibitor morphology, with maximum IE and optimal process variables, was examined using SEM. MS surface morphology and elemental analysis were characterized by JEOL JSM-7600F.
Results and discussion
Phytochemical analysis
Phytochemical analysis results (Table 3) showed that organic compounds, such as alkaloids, flavonoids and saponins, were present.
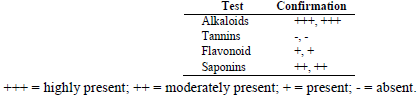
These organic bioactive compounds have anti-inflammatory and anti-oxidant characteristics, which explained LLE corrosion IE. The findings have been verified by 35-37.
WL measurements
MS WL at 1.0 M HCl was calculated at different time intervals, from 2 to 6 h, with of LLE at a C of 0.2, 0.5 and 0.8 g/L, over T of 303, 313 and 323 K. The obtained values were used to calculate WL and IE, using equations 2 and 3. Table 4 shows WL, CR and IE results. IE increased with higher LLE C, due to the presence of active metabolites.
Evaluation of a corrosion regression model
CCD was used for assessing the correlation between the variables of the experimental process and CR. A polynomial quadratic regression reaction with CR (Y) and process variables, such as time (A), T (B) and the inhibitor C, is shown in Eqs. 5 and 6.
 ***
***
The final response reaction in terms of CCD is as in Eq. 6.
 ***
***
Statistical analysis result
In addition, the variance analysis (ANOVA) is presented in Table 5.
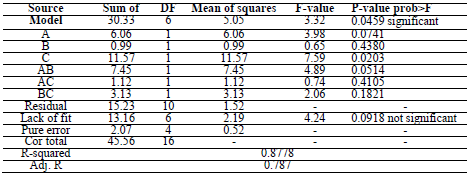
ANOVA results indicated that the quadratic model was appropriate for analyzing the experimental data. R2 was 0.8778, which proved to be a good fit between the forecast and the experimental.
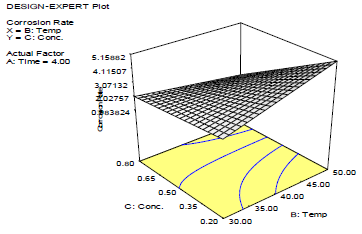
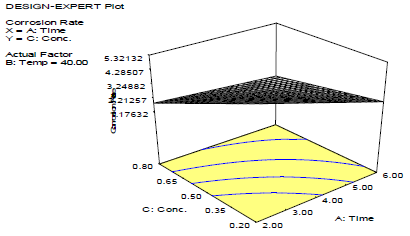
Surface response plots for MS with LLE
3-D plots (Figs. 1 -3) show the relationship between the variables affecting the corrosion process validity and LLE. Fig. 1 shows that CR increased with higher T, and decreased significantly over time.
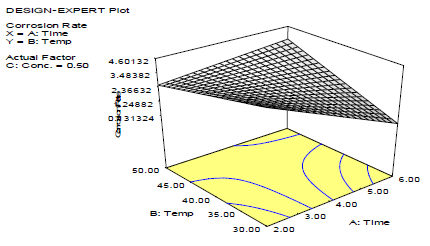
Fig. 2 shows that CR decreased with inhibitor C, as shown in Fig. 3.
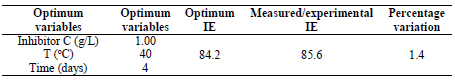
This in agreement with what was reported by 33. Moreover, for verifying the model prediction, the optimal condition values were applied to three independent replicates, and IE was 84.2%. LLE usefulness to protect MS in HCl was established.
Results on surface analysis
Figs. 4a and 5a show SEM results of blank and coated MS, respectively. The micrographs revealed that, in the inhibitor absence (Fig. 4), the surface was severely corroded.
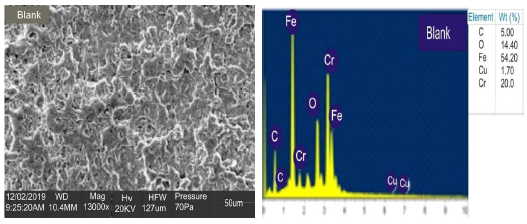
In the inhibitor presence (Fig. 5), at OPL (validated), the exposed MS surface morphology showed the development of a passive film layer (white patches) by the LLE active constituents, which displayed considerable corrosion resistance, in agreement with 35. Figs. 4 and 5 show EDX results of the blank and coated MS samples, respectively. The coating formed on MS was attributed to the presence of LLE phytochemical constituents, which underwent the adsorption mechanism. The results showed that MS in Fig. 5 has more heteroatoms than in Fig. 4, which indicates that the inhibitor (Fig. 5) prevented the corrosion process.

Corrosion mechanism
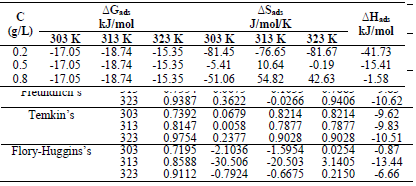
The blank MS coupon clearly showed that corrosion activities occurred, which caused its surface to be porous. The MS coupon surface with inhibitor was smooth, whereas white patches appeared on it, mainly due to the protective oxide, at optimum C. The adsorption mechanism has been commonly used to describe the corrosion inhibition effect of organic molecules on the metal/acidic solution interface. These molecules influence the inhibitors chemical, structural and electronic characteristics. Thermodynamic studies of the adsorption process in the study suggested that LLE physisorption onto the MS surface was lower than -20 kJ/mol-1 (31, and ΔH was -15.41, -36.67 and -61.49 kJ/mol-1. The results are shown in Table 7. Therefore, the reaction was spontaneous, because ∆Gads was negative, and LLE inhibition was an exothermic process. ∆Sads values, with inhibitor C of 0.2, 0.5 and 0.8 g/L, and at T of 303, 313 and 323 K, are shown in Table 8. ∆Sads decreased as T increased with each higher C, and this showed a more ordered behavior that led to enhanced IE.
Experimental validation
As shown in Table 6, the optimum process level variables values observed were: time of 2.49 h; T of 48.30 ºC; and C of 0.65 g/L. At this ideal conditions, the experiment was conducted for validating the predicted optimum values. IE of 85.63% was observed, which was in close agreement with 84.2% obtained from the regression model.
Results on the adsorption mechanism
LLE inhibitor prevented MS dissolution by being adsorbed onto the metal/acidic solution interface, forming a layer that protected it. Langmuir’s adsorption isotherm (Fig. 6) was estimated using Equation 7 15.
 ***
***
where θ is the surface layer.
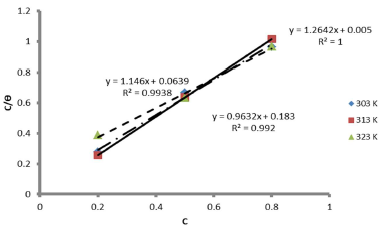
The graph of C θ versus C, in Fig. 7, can be used to obtain Kads, at different T, and R2 is shown in Table 7.
The results showed that, at a T of 40 ºC, Langmuir´s adsorption isotherm was best fitted. On the contrary, at 50 ºC, linear plot slopes were larger than unity. The result further showed that, as T increased, Kads values decreased.
In the equation below, Kads is related to ΔGads.
 ***
***
The calculated Kads in Table 7 was used to estimate ∆Gads at different T.
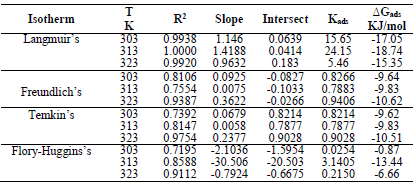
∆Gads negative values indicated LLE components spontaneous adsorption onto the MS surface, with strong interactions between them 12. ∆Gads value from the study was lower than -20 kJ/mol-1, which indicated physisorption, as shown in Table 8 31.
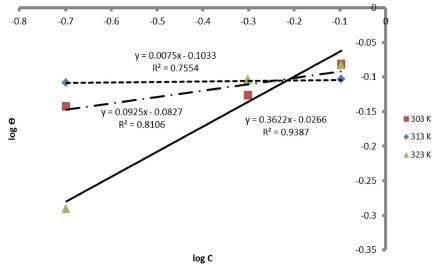
Therefore, the reaction was spontaneous, because ∆Gads was negative, and LLE inhibition was an exothermic process. Moreover, Figs. 8 and 9 are the graphs for the Temkin’s and Flory-Huggin’s adsorption isotherms, respectively.
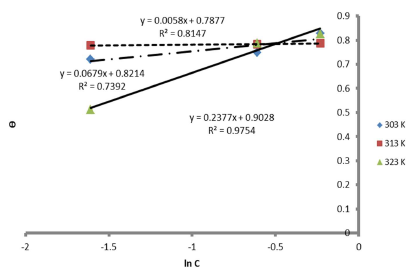
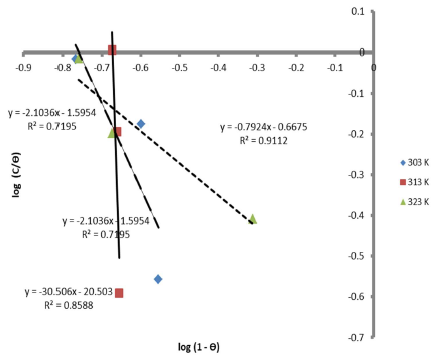
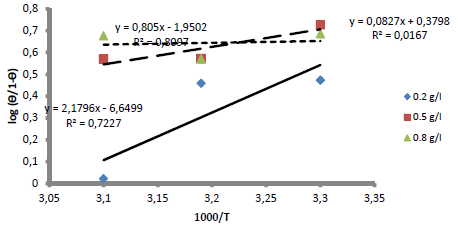
Fig. 10 is the graph of 𝐼𝑜𝑔 𝜃 1−𝜃 against 1000 𝑇 , at various C, respectively.
Conclusion
LLE showed OPL with time of 2.49 h, T of 48.3 ºC and an inhibitor C of 0.66g/L, with an IE of 85.6%. The extract IE improved with an increase in C. The experimental value obtained as an IE of 85.6% agreed with the result obtained from the regression model (84.2%). SEM images clearly indicated that the MS surface was protected against dissolution by LLE, which acted as a corrosion inhibitor. It is clear that MS corrosion inhibition induced by LLE was due to physisorption. The extract can be used as environmentally-friendly corrosion inhibitor, in industries. It can be concluded that LLE, which is agro-waste, has been converted into a sustainable product as an effective inhibitor against MS corrosion.
Authors’ contributions
Olamide Oyewole: wrote the paper; made the experimental design and analysis; interpreted the results. John Busayo Adeyoye: made the experimental analysis; made adsorption experiments; interpreted results. Abayomi Tunbosun: obtained the extracts; made the experiments. Chukwuemeka Celestine Chukwuma: made the experimental analysis.
Abbreviations
C: concentration
CCD: central composite design
Cor Total: amount of variation around the mean of observations. The model explains part of it, the residual explains the rest.
CR: corrosion rate
DF: degree of freedom
EDX: energy dispersive X-ray
IE: inhibition efficiency
Kads: adsorption equilibrium constant
LLE: lemon leaves extract
MS: mild steel
OPL: optimal process level
R2: determination coefficient
RSM: response surface methodology
SEM: scanning electron microscopy
T: temperature
WL: weight loss

