


 English (pdf)
 Article in xml format
 Article references
 Send this article by e-mail
 Cited by SciELO
  Similars in
SciELO
Similars in
SciELO 
 Permalink
Introduction
Organic coatings form a class of high-performance material, chemically resistant, used in protective applications coatings, as one of the ways to combat corrosion [1, 2]. Generally, epoxy based coatings are amongst the most common industrial polymers which have been applied to protect various metals from corrosion in aggressive environments [3]. Epoxy coatings have been used as a structural or engineering adhesive for the construction of aircrafts, automobiles, etc. The excellent chemical resistance, good adhesion to the underlying metal surfaces, outstanding thermal stability, good mechanical properties, and electrical insulating properties, make epoxy resins an ideal coating material for various applications [4, 5].
For this purpose, epoxy coatings reduce metals corrosion rate by acting as an effective physical barrier between metals and corrosive environment. However, owing to wear and abrasion, epoxy based coatings also fail to offer long-term corrosion protection. During the curing process of epoxy coatings, the shrinkage of epoxy resin takes place and absorbs water, air from the environment, and this, in turn, makes microspores in the epoxy coatings. The pores in the coating facilitate to some extent the diffusion of corrosive species such as oxygen, water and ions at the metal/epoxy interface, and initiate the corrosion process, depleting the coating [6 7, 8].
However, in practice, all organic coatings are permeable to corrosive species, such as oxygen, water and ions, to some extent [9, 10]. In the last few years, the study of the performance of nanocomposite coatings has been in the center of attention of organic coating scientists, due to their beneficial properties [11, 12]. Various nanoparticles, such as ZnO [13], ZrO2 [14], CeO2 [15], CaCO3 [16], Fe2O3 [17], SiO2 [18] and TiO2, have, therefore, been employed as reinforcements, in order to improve coatings performance in the corrosive environments [19] . They have been introduced into coatings, to investigate their effects on protective properties.
Titanium dioxide (TiO2) is a multi-purpose nanoparticle, utilized to produce multifunctional nanocomposite coatings, because of its high refractive index, its strong UV light absorbing capabilities and its resistance to ultraviolet light [20].
Furthermore, TiO2 is an inorganic UV-absorber, exhibiting more stability than the usual organic UV absorbers or light stabilizers. Additionally, TiO2 nanoparticles do not cause/accelerate polymer degradation, compared to UV-absorbent TiO2 nanoparticles [20].
The objective of this research is to determine the effect of TiO2 nanoparticles addition to standard epoxy coatings on their UV stabilizing and anticorrosive protective properties, by Electrochemical Impedance Spectroscopy (EIS). EIS has been used to measure the performances and to monitor the degradation of the coatings protective properties during UV exposure. Equivalent circuit model was proposed to interpret the electrochemical impedance data for the herein studied coated systems.Therefore, the results evidenced excellent UV stabilization, corrosion resistance and application of the new composite coating.
Experimental section
Materials
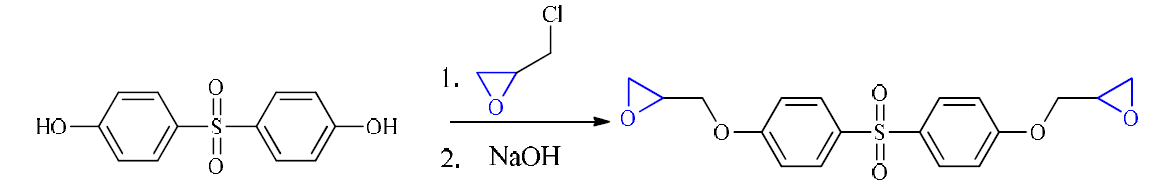
Diglycidyl ether 4, 4’-dihydroxydiphenylsulfone (DGEDDS) epoxy resin was synthesized in our laboratory (Fig. 1), and the 4, 4’-Methylene dianiline (MDA) curing agent was supplied by Sigma-Aldrich. Corrosion experiments were performed using carbon steel panels with the following chemical composition: Fe 98.70%, C 0.11%, Si 0.24%, Mn 0.47%, Cr 0.12%, Mo 0.02%, Ni 0.1%, Al 0.03%, Cu 0.14%, Co< 0.0012%, V<0.003% and W 0.06%) [21].
Synthesis of diglycidyl ether 4, 4’-dihydroxydiphenylsulfone
Diglycidyl ether 4, 4’-dihydroxydiphenylsulfone (DGEDDS), shown in Fig. 1, was obtained by condensation of epichlorohydrin and 4, 4'-dihydroxydiphenylsulfone. The yield of the DGEDDS was of about 89%.
Curing process of Diglycidyl ether 4, 4’-dihydroxydiphenylsulfone
Epoxy resins can be processed into thermally cured polymers, through many chemical compounds acting as bridging agent or hardeners, during the implementation [22]. Curing agents can be divided into amine-type curing agents, alkali curing agents, anhydrides, and catalytic curing agents, according to their chemical compositions. We limited ourselves to one hardener class: primary diamine aromatic. According to their chemical structure, the aromatic compounds provide very good thermal stability and mechanical properties to the resin. Therefore, they are often used for high-tech applications.
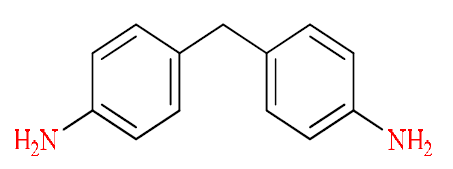
Our curing agent was performed by an aromatic primary diamine. The chemical structure is as follow (Fig. 2) [23]:
The reaction between epoxide and diamine is a bi-molecular reaction of the addition of the primary amine functions on the epoxide cycles, by the opening of oxirane cycles (Fig. 3).
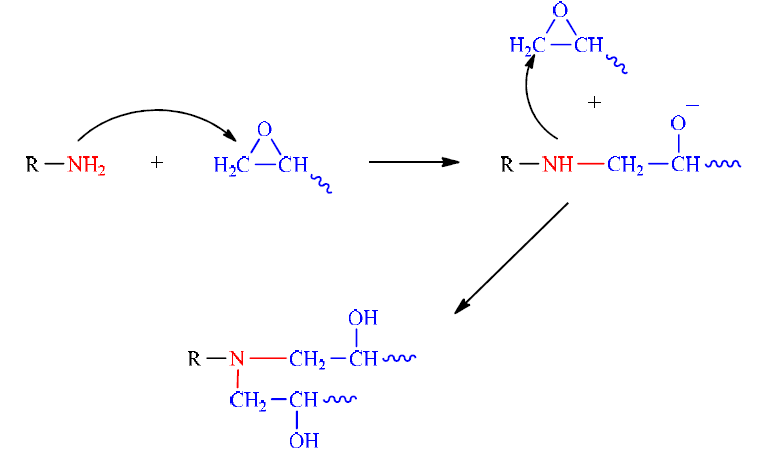
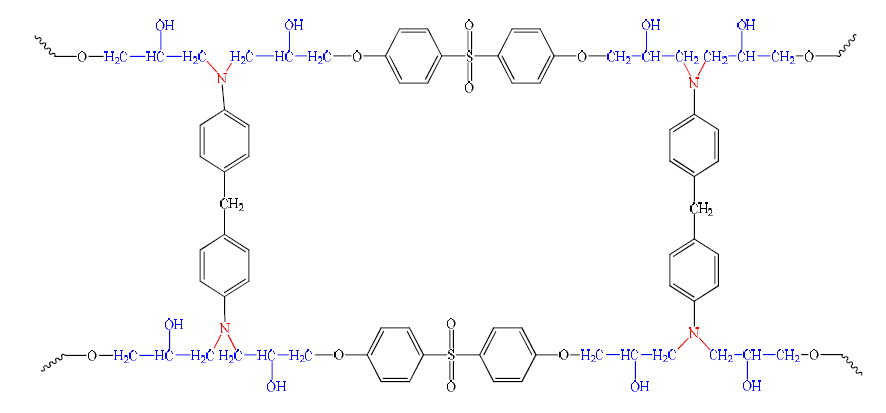
Polymer networks are formed from functional precursors, by reactions between their functional groups, resulting in a bond formation. The crosslinked branched structures are generally formed by this method. The system consisting of a tetra functional epoxy and a bi-functional diamine remains a typical example. Primary amine sites, in this system, act as chain extenders, while secondary amines produce branches (Fig. 4).
The action of 4, 4’-ethylene dianiline on the epoxide is described by the following reaction [24]:
Mixing the epoxy resin with the hardener, prior to crosslinking, is performed differently, depending on the used hardening agent. In the protocol that is adopted by Levan [25], methylene dianiline, crystallized at room temperature, is placed in an oven at 120 °C (a temperature above its melting point), while the resin is carried out at 60 °C. Once melted, the curing agent (MDA) is mixed with the epoxy resin, to provide a single fluid phase, being then at 70 °C.
Ratio Calculation
Calculation of stoichiometric coefficients
In order to get the maximal crosslinking density properties when we harden a difunctional epoxy resin with a hardener (especially amines), we used the given data (EEW and AHEW) from the technical sheet of the different reactants.
The Epoxy Equivalent Weight (EEW) of the DGEDDS epoxy resin is calculated as below (Equation 1):
where M is the Molar mass of the resin (M=362 g/mol), and F is the Functionality of the resin (f=2).
Calculating the equivalent amine (Amine Hydrogen Equivalent Weight: AHEW) is determined as below (Equation 2):
where M is the molar mass of the used hardener and f is the functionality of the hardener.
Calculation of the weight ratio
The calculation of the weight ratio is determined as below (Equation 3):
The resin (DGEDDS), with an equivalent weight of 181 g/eq of epoxy, is being mixed with an amine hardener (MDA), with an equivalent weight of 49, 56 g/eq of amine.
For a complete reaction, with no unreacted components left over, one equivalent of epoxy must react with one equivalent of N-H amine.
One equivalent epoxy weighs 181 g. One equivalent amine weighs 49, 56 g. The mix ratio by weight is 181 g epoxy per 49, 56 g of amine.
The amount of the required MDA for the hardening of 100g of DGEDDS is 27, 43 g.
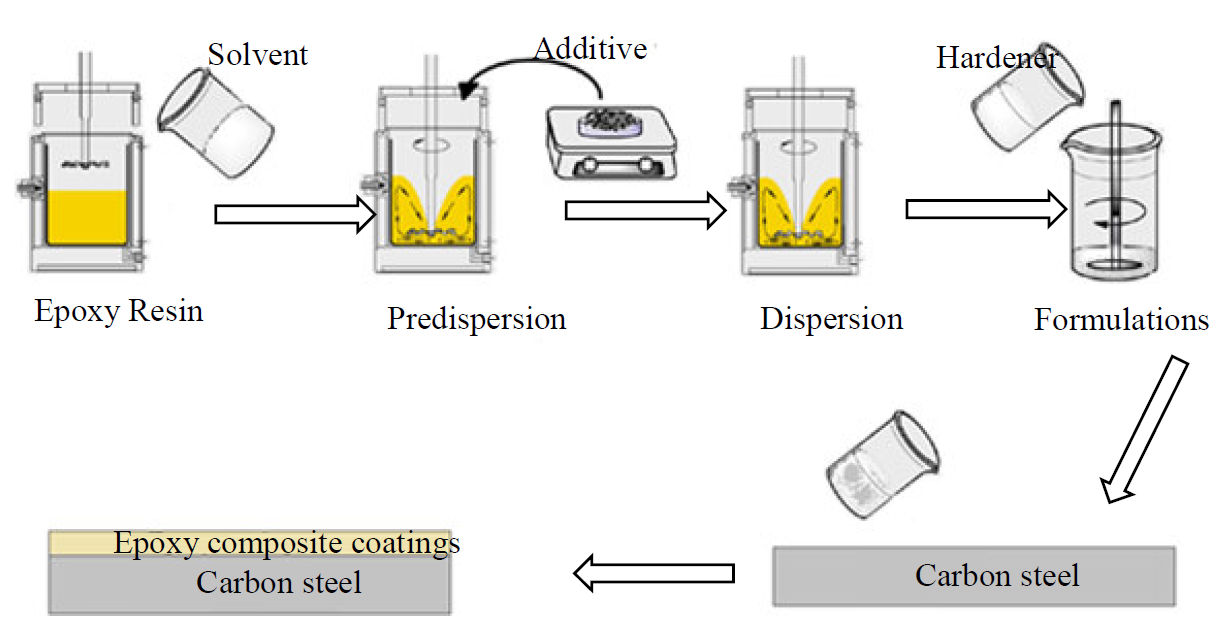
Formulation composition and steel coating
Two epoxy formulations, which differ in the UV stabilizer and anticorrosive additive, were prepared. More specifically, these two formulations contained DGEDDS and MDA hardener in stoichiometric amounts, MP1, and 5 wt. % TiO2 MP2, as UV stabilizer and anticorrosive additive. Fig. 5 shows the schematic of epoxy coatings preparation.
The prepared coatings were applied on the steel sheets by mechanical agitation, for about 10 min, at room temperature. The coated substrates were cured at 70 °C for 24 h. The coatings thickness was in the range of 170±10 µm.
Characterization methods
Coating evaluation under accelerated conditions
The corrosion performance of the coating samples was evaluated exposing the coated specimens to UV radiation. Commercial UV-A lamps (center wavelength of radiation 340 nm) was used for this purpose. The UV radiation, with a power density of 50 mW/cm2, was applied to irradiate the metallic surface. The aging temperature was regulated at 30 ºC, in the presence of oxygen in the temperature range from 293 K to 303 K [10].
Differential scanning calorimetry (DSC)
Differential scanning calorimetry (DSC) was performed using a Shimadzu Differential Scanning Calorimeter (DSC-60), operating at temperatures from 20 ºC to 300 ºC, and employing a heating rate of 20 ºC/min. The experiments were carried out under a constant flow of nitrogen with a sample weight of approximately 5 mg.
Electrochemical Impedance Spectroscopy (EIS)
In order to evaluate the response as UV stabilizer and anticorrosive coatings standard and composite of the two formulations prepared in this work, as a function of time, electrochemical impedance spectroscopy (EIS) was performed in an aqueous 3 wt. % NaCl solution, at open circuit potential (OCP). Two samples were evaluated; MP1 standard, as reference, and MP2 composite. The employed working electrode was the carbon steel panel used as metallic substratum, with an area of 1 cm2. A platinum ring and saturated calomel electrode (SCE) were used as counter and reference electrodes, respectively. EIS measurements were performed with a PS 200 Biologic Potentiostat. The amplitude of the EIS perturbation signal was 10 mV, and the frequency ranged from 10−2 to 105 Hz. All the EIS analyses were conducted under potentiostatic conditions. The EIS measurements were carried out at unexposed and UV-exposed (2000 h) conditions, and at 1 h immersion in a saline solution, at a temperature of 298 K. Then, the impedance spectra were analyzed by fitting the experimental data to an electrical equivalent circuit with the software V5.53 Lab Express .
Scanning electron microscopy (SEM)
Scanning electron microscopy (SEM) (S3000H, Hitachi) was employed to examine the surface morphology and cross-sectional morphology of the coatings. SEM measurements were carried out at 20 kV.
Results and discussion
Differential scanning calorimetry (DSC)
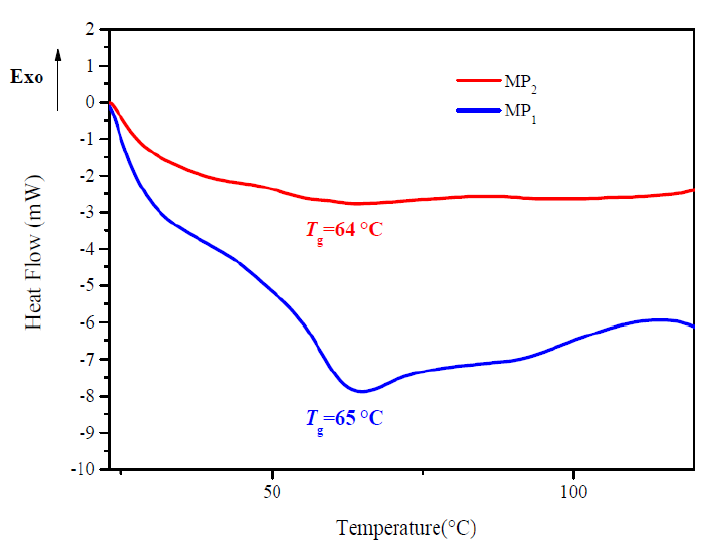
Measurements of Tg provide a direct insight into the mobility of polymer chains; Tg was taken as a midpoint in the specific heat transition [26]. Tg is an important parameter for application of the epoxy resin thermoset. Tg of the epoxy resin (DGEDDS) cured with primary diamine aromatic (MDA) as reference, and with the presence of 5 wt. % of titanium dioxide particle as additive, MP2, have been measured by DSC.
DSC analysis of reference sample, MP1, and composite sample, MP2 ,display T g values in the experimental temperature ranging from 20 to 120 °C. A stack plot of DSC thermograms of the product is depicted in Fig. 6.
Clear single endothermic transitions appeared at the thermograms correspond to T g transitions. The samples: Vstandard X and Vcomposite X have a T g of 65 °C and 64 °C, respectively.
The lowering of the Tg values is attributed to TiO2 presence, which increases the free volume and consequently, a Tg drop.
Performance and degradation of the studied coating
Several authors investigated the failure mechanism of different coating systems by electrochemical impedance spectroscopy (EIS) measurements. This procedure allows monitoring the behavior of coated surfaces, giving valuable information about both coating degradation and resistance to protect the metal surface in different corrosive environments [25, 27, 28].
Impedance diagrams Bode plots
The Bode plots exhibit two regions. The first high frequency represents the coating capacitance, and the other one, with low frequency, is generally attributed to the charge transfer process [29, 30].
Fig. 7 shows the Bode plots of MP1 standard epoxy and MP2 composite coatings with 2000 h UV exposure, and without UV exposure, after 1 h immersion in a 3 wt. % NaCl solution. The evaluation was carried out by measuring the impedance modulus (/Z/).
It can be seen from Fig. 7 that the total impedance of standard epoxy coating, MP1, and composite epoxy coating, MP2, in the low frequency region (102 -103 Hz), after 1 hour of immersion in 3 wt. % NaCl, was greater than that of the standard epoxy coating.
Further, the impedance modulus at low frequency of 0.01 Hz (|Z|0.01Hz) for the MP2 composite coating is significantly higher than that of the MP1 standard coating, after 1 hour of immersion in 3 wt. % NaCl; the |Z|0.01Hz value for MP1 standard coating and MP2 composite coating is 1,8×10⁴ and 1,02×10⁵ Ω.cm2, respectively.
The higher |Z|0.01Hz value of MP2 composite coating, compared to MP1 standard coating, shows that composite coatings have higher barrier properties against electrolyte diffusion through the coating.
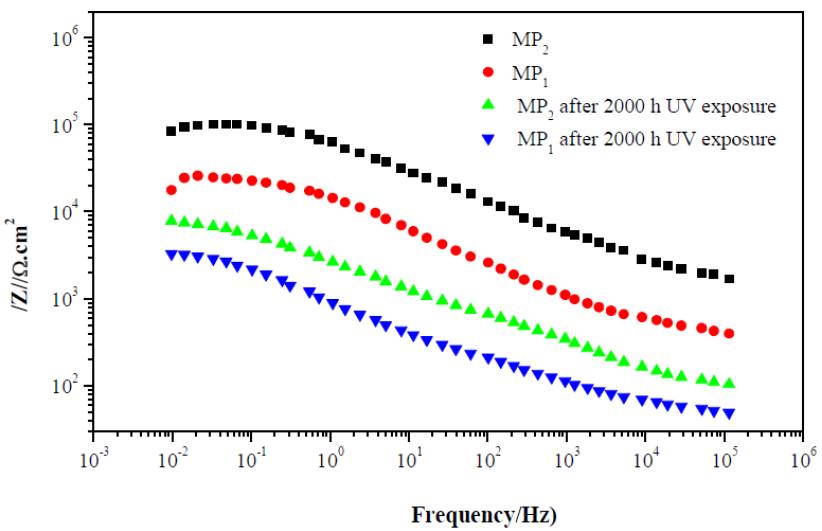
Figure 7 Impedance diagrams (Bode plots) of standard epoxy coating, MP1, and composite epoxy coating, MP2, after 1 h of immersion of carbon steel in 3 wt. % NaCl and after 2000 h UV exposure and 1 h immersion in 3 wt. % NaCl.
After 2000 h UV exposure and 1 h immersion in 3 wt. % NaCl, degradation of the standard coating occurs and the |Z|0.01Hz value decreases to 3,3×10³ ohm.cm2, due to the permeation of a corrosive solution into the coating.
On the other side, although the |Z|0.01Hz value of the composite coating decreases after 2000 h UV exposure and 1 h immersion in 3 wt. % NaCl (which is about 8, 8 ×10³Ω. cm2), it is still much higher than the standard coating.
Moreover, the /Z/ module at high frequency for the composite coating is significantly higher than the standard coating, after 1 hour of immersion in 3 wt. % NaCl, and after 2000 h UV exposure and 1 h immersion in 3 wt. % NaCl.
In addition, MP2 composite coating sample shows higher impedance than MP1 standard coating at low frequency, indicating that MP2 provides higher protective performance.
These results signify that the corrosion protection performance of the composite coating, after 2000 h UV and 1 h immersion in 3 wt. % NaCl, significantly improves via addition of Titanium Dioxide (TiO2).
TiO2 enhances the barrier properties of the epoxy coating against the diffusion of corrosive agents at the metal/coating interface.
Impedance diagrams Nyquist plots
The Nyquist plots are composed of two loops. The first high frequency (HF) represents the coating capacitance and the other one, with low frequency (LF), is attributed to the charge transfer process [31].
Fig. 8 shows the Nyquist plots of MP1 standard epoxy and MP2 composite coatings, with 2000 h UV exposure, and without UV exposure, after 1 h immersion in a 3 wt. % NaCl solution.
Further, the impedance data are modeled via electrical equivalent circuit [32], shown in Fig. 9, and the extracted electrochemical parameters are presented in Table 1.
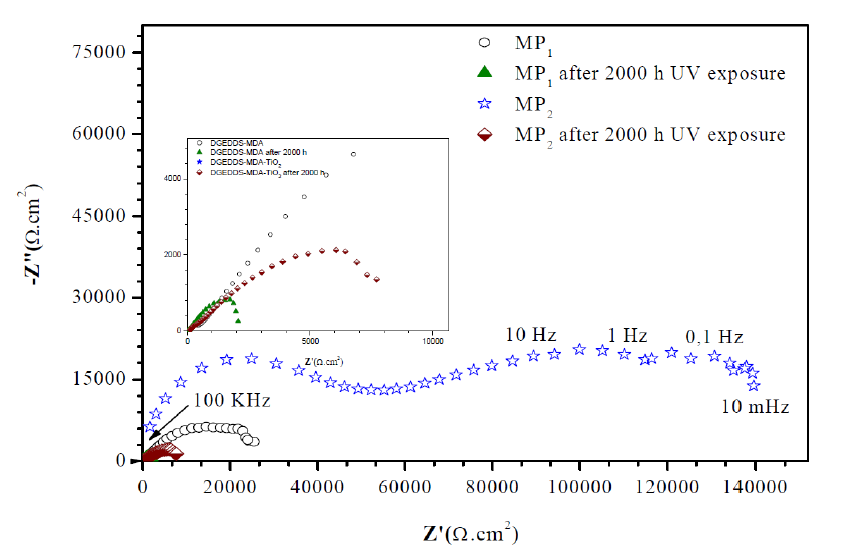
Figure 8 Impedance diagrams (Nyquist plots) of MP1 standard epoxy coating and MP2 composite epoxy coating , after 1 h of immersion of carbon steel in 3 wt. % NaCl, and after 2000 h UV exposure and 1 h immersion in 3 wt. % NaCl.
The equivalent electrical circuit is often used to analyze the impedance spectra of a metal/coating system. In this paper, an Rs (Qcoat (Rpore (Qdl Rct)) circuit model was used to model the coatings behavior, where Rs represents the electrolyte resistance, Qcoat and Rpore are the coating capacitance and pore resistance, respectively, and double layer capacity (Cdl) and charge transfer resistance (Rct) are used to simulate the electrochemical process at the metal interface (Faradic reaction). The electrochemical parameters are given in Table 1.
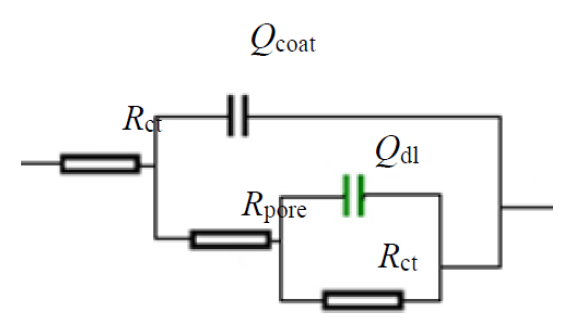
Table 1 Different electrochemical parameters extracted from impedance data of MP1 standard epoxy coating and MP2 composite epoxy coating, after 1 h of immersion of carbon steel in 3 wt. % NaCl, and after 2000 h UV exposure and 1 h immersion in 3 wt. % NaCl.
| Samples | R s (Ω.cm²) | Q coat (µF/cm²) | R pore (Ω.cm²) | Q dl (µF/m²) | R ct (Ω.cm²) |
| MP1 | 286 | 1.41 | 5153 | 1.02 | 26971 |
| MP1-2000 h UV | 20 | 34 | 656 | 2.8 | 1960 |
| MP2 | 198 | 0.91 | 33792 | 0.11 | 140975 |
| MP2-2000 h UV | 71 | 19,6 | 718 | 0.29 | 9630 |
Double layer capacitance and coating capacitance (Q dl, Q coat)
The double layer capacitance (Qdl), which is related to the distribution of ionic charges at the metal/coatings interface [33], is significantly lower for MP2 composite coating, after 1 h of immersion of carbon steel in 3 wt. % NaCl ,and after 2000 h UV exposure and 1 h immersion in 3 wt. % NaCl. Besides, Qdl of MP2 composite coating is lower than MP1 standard coating. The Qdl value increases after 2000 h UV exposure and 1 h immersion in 3 wt. % NaCl, due to the expansion of active sites [34].
The coating capacitance (Qcoat) for MP2 composite coating is lower than MP1 standard coating, after 1 hour of immersion of carbon steel in a 3wt. % NaCl solution. This is because TiO2 fills the micropores and decreases the water uptake into the coating. The variation of Qcoat proved the degradation of two of the MP1 matrix coatings after 2000 h exposure to UV and 1 h immersion in corrosive media, and limited degradation in the MP2 coating. Qcoat increased with increasing UV exposure time, which indicated, after immersion in corrosive media, that the penetration of water into the coating/metal interface was accelerated, causing an increase in the microcracks. The increase of microcracks facilitates the penetration of water into the interface. The dielectric constant of the coating increased with diffusion of water into the coating/metal interface.
Coating resistance and charge transfer resistance (Rpore, Rct)
The results presented in Table 1 show that the higher value of Rpore and Rct for MP2 composite coating than that of the MP1 standard coating can be explained by the good dispersibility of TiO2 in the coating and improving coating electrical resistance against the transfer of corrosive species through the pores of the coating. The increase in Rcoat and Rct indicates the effect of TiO2 on the decrease of the penetration of corrosive species into the coating/metal interface, through decreasing coating porosity [35].
However, Rpore and Rct values of coatings decreased with an increase in UV exposure and immersion time, which caused the creation of microcracks. The MP1 standard coating shows that the Rpore value decreases after 2000 h, which is attributed to the uptake of electrolytes into the coating. However, MP2 composite coating shows slight changes in Rpore value. The results show that TiO2 prevents the degradation of coatings. In addition, TiO2 prevents the propagation of microcracks and does not allow water and corrosive species to penetrate into the metal/coating interface. Besides, TiO2 fills micro pores of the coating and decreases the possible sites of microcracks formation.
EIS characteristics of coatings after UV exposure
The EIS results approved the mechanism proposed for preventing the degradation of coating under UV exposure (Fig 10).
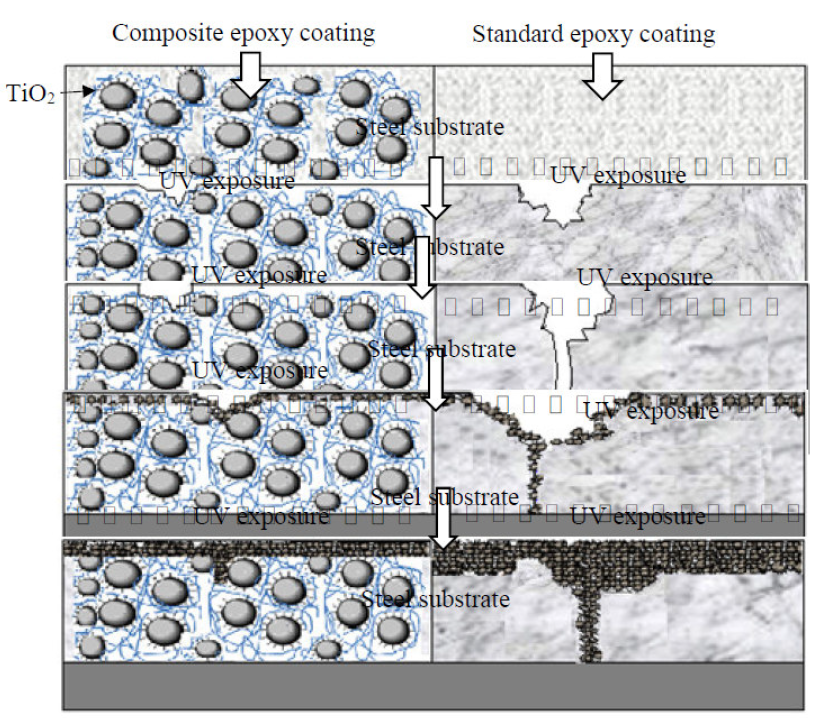
Figure 10 Schematic illustration of the protection mechanism by standard epoxy coatings and composite epoxy coatings, at different irradiation periods on carbon steel substrates.
By increasing the exposure time up to 2000 h, some variations were observed in the resistances of the coatings, showing the rate of degradation by UV radiation. The resistance of the two studied coatings decreased more than 103 times, after 2000 h UV exposure and 1 h immersion in 3 wt. % NaCl.
The surface of MP1 standard coating had many microcracks. After 2000 h of UV exposure to the corrosive media, the corrosive agent diffused into the metal/coating interface. Penetration of the corrosive agent led to a decrease in the impedance of DGEDDS-MDA coating. With an increasing immersion time, all microcracks were filled by 3 wt. % NaCl.
After 1 h immersion, the corrosion products, such as rust, filled microcracks temporarily. These products limit the penetration of corrosive agents into the metal/coating interface and lead to the impedance increase of MP1 coating of about one order. With increasing immersion times, these products cannot limit the penetration of the corrosive agent, because of their porous nature. Therefore, the impedance of MP2 coating after 2000 h UV exposure and 1 h immersion in corrosive media was higher than MP1 coating. MP2 coating had a stable impedance, because the TiO2 nanoparticles were more than those of the MP1 coating, which limited the penetration of corrosive agents. Impedance of the MP1 coating against UV irradiation decreased severally, so it completely lost its protective performance.
Surface morphology of coatings before and after UV exposure
The microstructure of cross sectional surfaces of two carbon steel panels was analyzed for change in morphology, before and after 2000 h of UV exposure, by SEM, and their micrographs are shown in Fig. 11.
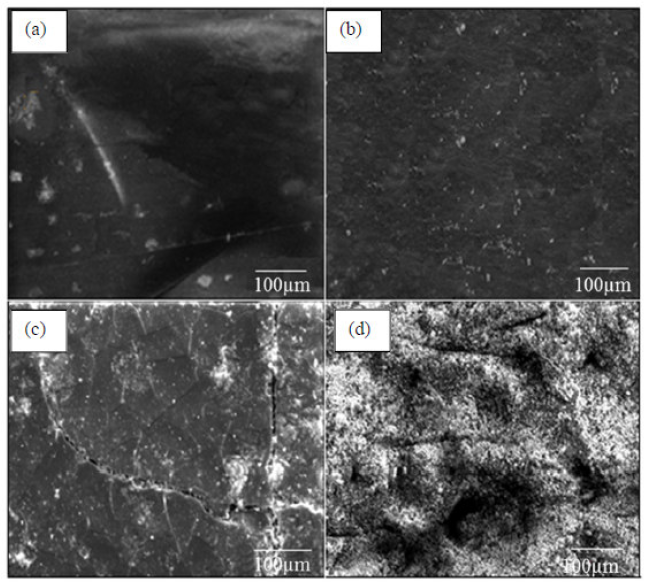
As shown in Fig. 11a, the coating without TiO2 nanoparticles was very smooth for the matrix with MP1 standard coating [36, 37]. However, when 5 wt. % of TiO2 nanoparticles were introduced, the coatings displayed a rough surface. Some micron-sized protrusions were observed to be embedded in the MP2 coatings (Fig. 11b).
The standard coating, after 2000 h UV exposure, shows micro cracks on the surface. The surface of the sample is severely damaged after 2000 h of UV exposure. The micro cracks coating surface becomes deep and broaden during UV exposure, as shown in Fig. 11 (c). The surface micro cracks in degraded areas significantly decreased when titanium dioxide was added to the coating. Nevertheless, micro cracks in the coating were invisible after 2000 h UV exposure in MP2 coating, as shown in Fig 11 (d). It seems that titanium dioxide decreases UV degradation in the coatings.
Conclusions
We have presented two-matrix coatings MP1 standard and MP2 composite coating for protection of carbon steel substrates. The composite coating was shown to efficiently protect carbon steel substrate, due to its enhanced barrier properties, compared to the standard coating.
The main findings of this study can be drawn as follow:
DSC analysis of the MP1 standard sample possessed a higher glass transition temperature, compared to the MP2 composite sample.
The impedance diagrams, Bode and Nyquist plots study confirmed that TiO2 can fill micro pores and limit penetration of water into the coating.
SEM results and electrochemical measurements show that the degradation of standard coating with many microcracks happened after 2000 h UV exposure, but microcracks were not observed on the surface of the composite coating, with 5 wt. % Titanium Dioxide.

