


 English (pdf)
 Article in xml format
 Article references
 Send this article by e-mail
 Cited by SciELO
  Similars in
SciELO
Similars in
SciELO 
 Permalink
Introduction
The rapidly increasing water pollution is a worldwide environmental problem that threatens the life of earth inhabitants 1, and it has been caused by household and industrial waste direct and indirect disposal. Despite Pb, Cd and Zn being heavy elements that are still needed by the environment, they are non-essential metals that are considered as one of the major industrial wastewater contaminants, even at trace concentrations 2. Therefore, developing selective, sensitive, fast, simple and accurate methods is required for the determination of these metals in the environment 3-5.
Methods for the analysis of metal ions include ICP-AES (6), AAS (7), ICP-MS (8), ICP-OES 9, ISEs 10, TXRF 11 and PXRF 12. However, almost all of these methods imply for routine operations and selection high costs, and a long time at the pre-concentration stage before measurement, for the determination of very small metal amounts 13,14. Therefore, there is the need of an alternative method that can overcome the limitations of those techniques.
DPAdSV was chosen, because it has many advantages, such as not being affected by the seawater high salinity, having high sensitivity, low LOD, selectiveness and easy sample preparation, and being more fast and precise than of other instrument techniques 3,15,16. In addition, the DPAdSV preconcentration stage is shorter than that of other methods, which is generally less than one minute 17-19. DPAdSV is very sensitive, and it can be used to analyze very small concentrations (µg/L or ng/L) of species in solutions 14,20.
For heavy metals, the following voltammetric methods have previously been reported: AdSV, for Cu and Cd 21, 22); DPAdSV, for Cr 23; FSV, for Cd 24; and AdSV- RSM, for Cu 25. However, the methods are still carried out individually, which consumes a lot of time and chemical reagents, when the metals are analyzed in nature.
The voltammetric methods can simultaneously analyze several metals 4-6) (26: DPAdSV, for Pb and Zn 27; CSV, for Cu and Zn 28; SWASV, for Cd and Pb 29; ASV, for Cd and Pb 3; and CV, for Cd and Pb 19.
The results of these studies showed that the LOD was still high and the selectivity was not good enough, so, a measurement optimization was needed.
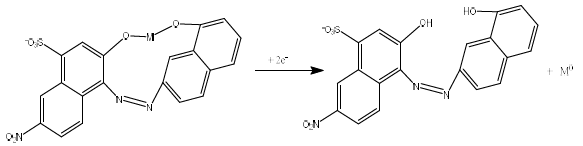
CCA functions as a ligand that can donate more than one free electron pair (hydroxyl group) to the central atom (Fig. 1), forming a complex with Pb, Cd and Zn ions 30. In this study, the DPAdSV method was used for CCA + Pb, Cd and Zn simultaneous standard setting, using a HMDE.
Experiments
Apparatus
DPAdSV was set by Metrohm 797 Computerce, with HMDE as the WE. The RE was Ag/AgCl/3 M KCl and the CE was Pt. A Griffin pH meter model 80, (Griffin & George Loughborough, UK), a Mettler AE 200 analytical balance (Toledo OH-USA) and glass equipment commonly used for laboratory were employed. The subtances used were mother liquor Pb, Cd and Zn (1000 mg/L), KCl, NH4OH, ammotate, acetic acid, doubly distilled water, CCA, 65% HNO3, seawater samples, methanol and N2 gas analytical grade (Merck). The samples used came from Senggarang seawater (Tanjungpinang, Indonesia), and they were preserved with 65% HNO3, at a ratio of 1:1000.
Voltammetric parameters
A total of 10 mL of the sample solution was added to 0.2 mL CCA and 0.2 mL AB, and it was put into the voltammeter vessel. The solution was sterilized and purged with N2, for 300 s. After a new HMDE was formed, the CCA-metals adsorption was processed at current and E, for accumulated time. After resting for 10 s, DPAdSV were obtained for measuring metals CCA, with HMDE as WE.
The operating parameters of the DPAdSV-CCA method were: calibration (SAM); number of replications (3); drop size (6); stirrer speed (2000 rpm); DPAdSV mode; purge time (300 s); SR (800 mV/s); additional purge time (10 s); Eads (-0.1 V); tads (70 s); equilibration time (10 s); pulse amplitude (0.05 V); start E (-0.05 V); end E (-1.3 V); voltage step (0.006 V); voltage step time (0.1 s); sweep rate (0.06 V/s); and Pb, Cd and Zn Ip values (-0.42, -0.57 and -0.99 V, respectively).
The metal ions were accumulated at the -0.1 V E on the HMDE surface. Then, they were oxidized by sweeping the potential from 0 to -1.3 V, using DPAdSV mode. Metrohm 744 pH meters were used for pH-analyte measurements, at a temperature from 25 to 30 ºC. Pb, Cd, and Zn ions made the standard solution. 10 mg/L of the metal ions salts, for the DPAdSV-CCA investigations, were prepared from the stock solution of 1000 mg/L. AB and PB, with pH 2-6 and 7-8, respectively, were used as SE. 1000 mmol/L CCA stock solution were used as ligands, with all reagents of the Merck product analytical grade. Ultrapure deionization water was used for the reagents dilution, and oxygen was expelled through purging with N2 for, at least, 300 s. Whatman filter paper was used to filter samples. All experiments were carried out at room temperature.
Result and discussion
Optimal conditions for DPADSV measurements
CCA effect
This research was conducted to optimize Pb, Cd, and Zn standard settings for DPAdSV measurement, using CCA as complexing agent. The initial experiment determined CCA suitability as a complex with metal ions, using HMDE. Fig. 2 shows the voltammograms of 0.5 mmol/L CCA (curve a), 10 µg/L Pb, Cd and Zn ions (curve b), and 10 µg/L Pb, Cd and Zn ions + 0.5 mmol/L CCA (curve c).
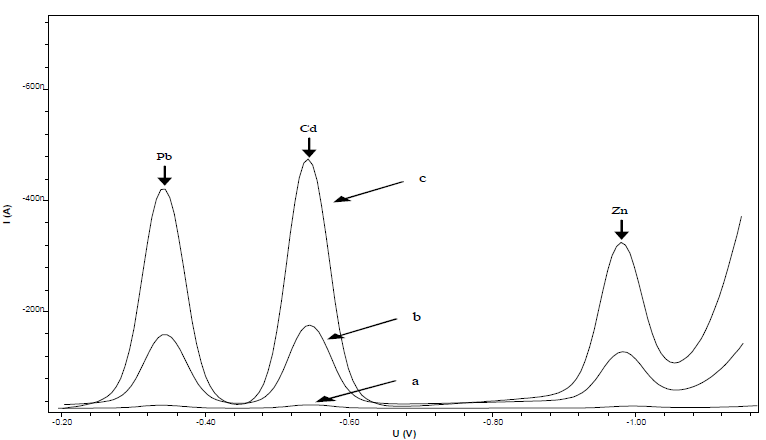
Figure 2 DPAdSV voltammograms of: (a) 0.5 mmol/L CCA; (b) 10 µg/L Pb, Cd and Zn; and c) 10 µg/L Pb, Cd and Zn + 0.5 mmol/L CCA.
Curve a shows the absence of a CCA peak in the range of Pb, Cd, and Zn ions half potential, which indicates that it did not interfere with the metal ions Ip. Curve b Ip is smaller than that of curve c. This shows that CCA can increase the reduced metal ions Ip in HMDE, which enhanced the method selectivity and sensitivity.
pH variation effect
The pH maintained the CCA-metal complex stability and produced different Ip values with each change in it. The optimized solutions pH values varied from 3 to 9 (Fig. 3).

The solutions pH optimal determination increased the sensor selectivity, and protected the analyzed substance (CCA-metals). The solutions obtained pH 3-7 at the Ip was low, since, under acidic conditions, they contained numerous H+, which caused the hydroxyl (OH-) group protonation in CCA. Hence, the CCA-metals complex that accumulated on the WE was reduced. Similarly, the obtained pH (above 7) at the Ip was low, due to the Pb, Cd, and Zn ions hydrolysis, which resulted in the disruption of the metals-CCA complex. Therefore, pH 7 was chosen for subsequent determinations.
CCA concentration effect on Ip
The CCA concentration range used was from 0.1 to 0.9 mmol/L (Fig. 4).
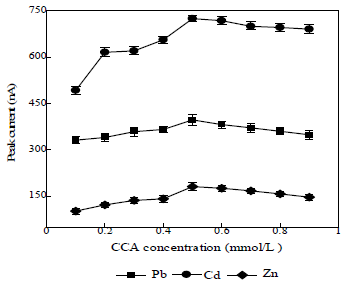
The resulting Ip increased with higher CCA concentrations. Low CCA concentrations produced low Ip, because there was still metal ions that did not form complexes with it. At CCA concentrations above 0.6 mmol/L, the resulting Ip decreased, because only a few complexes were reduced. The results showed that 0.5 mmol/L CCA concentration was optimum, because it provided higher Ip. So, it was used in subsequent determinations.
SE concentration (AB) effect on Ip
The SE reduces the solution resistance and ions migration effect, and maintains their strength constant. The used SE was an AB, in the concentration range from 0.1 to 0.7 mol/L (Fig. 5).
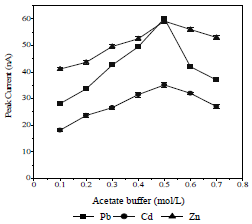
The highest peak height was achieved with 0.5 mol/L AB, because the formed metals-CCA complex was the most stable and widely spread on the HMDE surface 25,31. Therefore, 0.5 mol/L AB were used as SE in further experiments.
Edep effect on Ip
The Pb, Cd, and Zn ions Edep effect on Ip is shown in Fig. 6.

E was given between the WE and the RE. At the time of the reaction, the current was passed to the CE, so that the reaction that occured on it was the opposite of the one that took place on the WE. Fig. 6 shows the effect of several Edep on the generated Ip, for the optimization of E values simultaneously accumulated, from 0 to -0.8 V. At the initial measurement, the Ip increased when E went towards a negative value. However, above -0.3 V, the resulting Ip decreased, due to the perfect deposition on the electrode surface, and stripping occurence. Therefore, when E went towards a negative value, no more analytes were deposited 3,31. Measurement data show that the optimum Edep was at -0.3 V, which was used for further determinations.
Tdep effect on Ip
Tdep effect of the obtained Pb, Cd, and Zn ions on Ip was studied, as shown in Fig. 7 32.
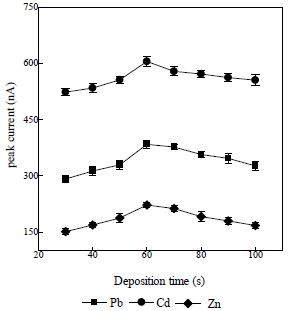
A pressure variation was obtained at 30 s, which gave a low Ip. This was due to the fact that only a small amount of the deposited analytes was absorbed onto the electronic surface, which produced a low Ip in the stripping process. Next, a longer Tdep was adopted, in order to produce higher Ip values. The optimal condition was obtained from the 60 s measurement, because, during that period, the deposited analytes were more strongly adsorbed onto the electrode surface, resulting in a high Ip. The measurement was then carried out at the Tdep of 70 s, which apparently resulted in a lower Ip than that obtained with 60 s, due to the electrode surface saturation, so that not all analytes were released from it, during the stripping process. So, a tdep of 60 s was used in further determinations.
Effect of DPAdSV parameters on pulse amplitude and SR
This study has tried to increase the sensitivity of the metals-CCA determination and test the influence of DPAdSV parameters on pulse amplitude (Fig. 8) and SR (Fig. 9).
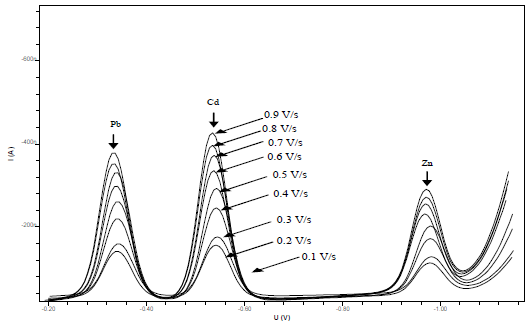
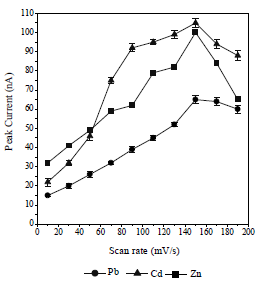
The obtained pulse amplitude and SR ranged from 0.1 to 0.9 V/s and from 10 to 190 mV/s, respectively. The higher the metals Ip, the more widen were Pb, Cd and Zn voltammograms. This caused an overlap in the voltammograms and a decrease in the metals Ip13. Therefore, the pulse amplitude of 0.8 V/s and the SR of 150 mV/s were selected. HMD size was from 0.25 to 4 mm2. The greater the HMD drop size, the higher the metals Ip, but if it was too high, it would fall before the metals reduction process took place 33. Metals-CCA Ip increased with higher frequency values, from 10 to 100 Hz. The 25 Hz frequency was chosen as the optimum condition, because it showed a voltammogram shape that was symmetrical and did not widen.
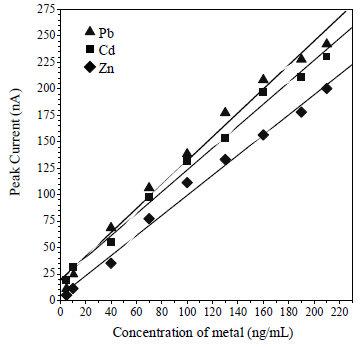
Analitycal parameters
Linearity (Ip vs concentration) was in the range from 5 to 170, 5 to 140 and 5 to 190 M, for Pb, Cd and Zn, respectively (Fig. 10). The obtained R2 values were 0.9867, 0.9987 and 0.99865, for Pb, Cd and Zn, respectively. LOD was calculated by 3 x SD/m, which is the calibration curve slope obtained at 0.05, 0.03 and 0.05 µg/L, for Cd, Pb and Zn, respectively. The analytical method accuracy determination was calculated from the measurement of 10 replications, with 10 µg/L Pb, Cd and Zn. The obtained RSD was 0.44, 1.21 and 1.23%, for Pb, Cd and Zn, respectively. The determination accuracy was calculated by the seawater samples recovery values, which were 98, 99 and 101%, for Pb, Cd and Zn, respectively.
RSD and recovery values were good. According to AOAC, the standard method for metals with a concentration of 10 µg/L gives RSD values below 15%, and the recovery values range from 75 to 115%. Based on the obtained data, this method can be used, because it has lower values than the recommended threshold, and it has high accuracy (34). Table 1 shows that the DPAdSV-CCA method has sensitivity and selectivity, compared to the potentiometric technique using ISE, for Pb, Cd and Zn determination.
Table 1 Comparison of recovery and LOD values of the DPAdSV-CCA method with those of the potentiometric technique using ISE.
| Method | Recovery(%) | LOD (µg/L) | Ref. | ||||
|---|---|---|---|---|---|---|---|
| Pb | Cd | Zn | Pb | Cd | Zn | ||
| ISE membrane | 90.8 | 3.31 | (35) | ||||
| Multiple ISE array | 86 | 4.6 | (36) | ||||
| C/PANI-TiO2/Pb2+-ISE | 2.2 | (37) | |||||
| ISE-K-polypyrro | 11.2 | (38) | |||||
| ANTI-DMN-ISE | 2.01 | (39) | |||||
| Salen material-ISE | 104 | 3.2 | (40) | ||||
| DPASV-Activated Hordeum vulgare L.-ISE | 96 | 97 | 6.96 | 1.82 | (41) | ||
| SWASV-ISE | 90 | 122 | 0.7 | 0.41 | (42) | ||
| BiSn film GCE | 102 | 82 | 90 | 0.4 | 0.6 | 0.5 | (43) |
| PEDOT-PF3 | 97 | 0.166 | (44) | ||||
| DPAdSV-CCA | 98 | 99 | 101 | 0.05 | 0.03 | 0.05 | This study |
salen material: (bis(salicylaldehydo)ethylenediimine)
Cationic and anionic interferences
Possible cationic and anionic interference on Pb, Cd and Zn simultaneous measurements, using the DPAdSV method, with CCA as the determined complex compounder, were tested. The measurements were made on 10 µg/L Pb, Cd and Zn, using the optimum conditions that had been obtained for each of them. The tested cationic and anionic concentrations were from 1 to 10 mg/L Cu2+, Ca2+, Ni2+, Co2+, Cr3+, Fe3+, Sr2+, K+, Na+, Li+, Al3+, Mn2+, Mg2+, NH4 +, Cl-, CO3 2-, F-, Br-, ClO4 -, SCN- and NO3 - (Table 2).
Table 2 10 µg/L Pb, Cd and Zn percentage recovery after the interfering ions addition.
| Interferent | Concentration (mg/L) | Signal recovery rate (%) | ||
|---|---|---|---|---|
| Pb | Cd | Zn | ||
| Cu2+ | 10 | 97.7 | 99.2 | 99.5 |
| Ca2+ | 10 | 98.1 | 97.4 | 99.3 |
| Ni2+ | 10 | 98.4 | 98.4 | 98.6 |
| Co2+ | 10 | 97.8 | 97.9 | 98.7 |
| Fe3+ | 10 | 99.1 | 98.5 | 98.7 |
| Sr2+ | 10 | 98.6 | 98.2 | 98.9 |
| K+ | 10 | 98.3 | 99.1 | 99.2 |
| Na+ | 10 | 98.7 | 98.9 | 99.2 |
| Li+ | 10 | 99.1 | 99.4 | 99.6 |
| Al3+ | 10 | 98.9 | 98.2 | 99.5 |
| Mn2+ | 10 | 97.9 | 97.9 | 98.9 |
| Mg2+ | 10 | 98.6 | 99.2 | 99.4 |
| NH4 + | 10 | 99.7 | 99.8 | 99.4 |
| Cl- | 10 | 99.1 | 98.7 | 98.5 |
| CO3 2- | 10 | 97.8 | 99.1 | 98.9 |
| SO4 2- | 10 | 98.9 | 98.3 | 99.3 |
| Br- | 10 | 99.3 | 97.9 | 98.4 |
| ClO4 - | 10 | 99.5 | 98.5 | 98.7 |
| SCN- | 10 | 98.6 | 98.8 | 98.4 |
| NO3 - | 10 | 99.1 | 98.2 | 99.3 |
The test results showed no disturbance in Pb, Cd, and Zn measurements up to the concentration of 10 mg/L, revealing that they were cationic and ionic. This shows that the DPAdSV-CCA method for Pb, Cd, and Zn simultaneous determination has good selectivity.
Application on real samples
The proposed DPAdSV-CCA method was applied to the seawater of former bauxite mining area samples. SAM was used as sample determination to eliminate matrix effects. Pb and Cd highest concentrations found in seawater were 15.34 ± 1.5 and 9.22 ± 0.4 µg/L, respectively (Table 3).
Table 3 DPAdSV-CCA Pb, Cd, and Zn determination in the seawater of a former bauxite mining area.
| Sample | Metals | ||
|---|---|---|---|
| Pb (µg/L) | Cd (µg/L) | Zn (µg/L) | |
| Seawater I | 15.34±1.5 | 9.22±0.4 | 35.11±0.5 |
| Seawater II | 9.11±0.2 | 5.16±1.9 | 19.21±4.1 |
| Seawater III | 4.76±1.6 | 7.76±3.1 | 15.76±0.9 |
Based on Pb, Cd and Zn minimum concentrations, the obtained seawater was still below the recommendations of US-EPA (45). The ability of DPAdSV-CCA for Pb, Cd, and Zn simultaneous determination, in natural samples with very low concentrations (µg/L), indicates that this method is very sensitive and does not affect the measurement of seawater samples that have a very large matrix.
Conclusion
The DPAdSV method for the simultaneous determination of Pb, Cd, and Zn-CAC complex tracing concentrations on its deposition was successfully used in the seawater of former bauxite mining area samples. This method has high sensitivity, good selectivity and low costs, and worked quickly with the obtained optimum conditions: CCA concentration (0.05 mmol/L), pH 7, Edep (-0.3 V), tdep (60 s), AB concentration (0.5 mol/L), SR (150 mV/s,) pulse height (80 Mv), HMD size (4 mm2) and linearity (Ip vs. concentration), which was in the range from 5 to 170, 5 to 140 and 5 to 190 M, for Pb, Cd and Zn, respectively.
The LOD values were 0.05, 0.03 and 0.05 µg/L for Pb, Cd and Zn, respectively. The RSD was 0.44, 1.21 and 1.23%, for Pb, Cd and Zn, respectively. The recovery values were 98, 99 and 101%, for Pb, Cd and Zn, respectively.
The addition of 1-10 mg/L cationic and anionic concentrations showed no significant disturbance to the simultaneous measurement of 10 g/L Pb, Cd and Zn, using the DPAdSV-CCA method. This shows that DPAdSV-CCA has good selectivity and sensitivity. It was applied for the simultaneous measurement of Pb, Cd and Zn concentrations from 4 to 15, 5 to 9 and 15 to 35 g/L, respectively, in the seawater of former bauxite mines.
Authors’ contribution
H. Pardi: conceived and designed the analysis; collected the data; wrote the paper. D. Fitriyah: collected the data; contributed with data or analysis tools. F. S. Silitonga: conceived and designed the analysis; contributed with data or analysis tools. T.W. Edelwis: conceived and designed the analysis; collected the data; wrote the paper. E. P. Ramdhani: collected the data; contributed with data or analysis tools; performed the analysis.
Abbreviations
AAS: atomic absorption spectrometry
AB: acetate buffer
AdSV: adsorptive stripping voltammetry
ANTI-DMN: 4-antipyrene carboxaldehyde and diaminomaleonitrile Schiff based probe
AOAC: Association of Official Agricultural Chemists
ASV: anodic stripping voltammetry
CCA: calconcarboxylic acid
CE: counter electrode
CSV: cathodic stripping voltammetry
CV: cyclic voltammetry
DPAdSV: differential pulse adsorptive stripping voltammetry
Eads: potential of adsorption
Ec: cathodic potential
Edep: deposition potential
FSV: fast scan voltammetry
GCE: glassy carbon electrodes
HMDE: hanging mercury drop electrode
HNO3: nitric acid
ic: cathodic current
ICP-AES: inductively coupled plasma atomic emission spectroscopy
ICP-MS: inductively coupled plasma-mass spectrometry
ICP-OES: inductively coupled plasma optical emission spectrophotometry
Ip: peak current
ISE: ion-selective electrodes
LOD: limit of detection
NH4OH: ammonium hydroxide
PANI-TiO2: polyaniline-doped titanium dioxide
PB: phosphate buffers
PEDOT-PF3: micro/nano porous 3D poly(3,4-ethyl-enedioxythiophene)/K3Fe(CN)6
PXRF: portable X-ray fluorescence
RE: reference electrode
RSD: relative standard deviation
RSM: response surface methodology
SAM: standard addition method
SD: standard deviation
SD/m: standard deviation/slope
SE: supporting electrolyte
S/N: signal to noise ratio
SR: scan rate
SWASV: square-wave anodic stripping voltammetry
tads: time of adsorption
tdep: deposition time
TXRF: total reflection X-Ray fluorescence spectroscopy
US-EPA: United States Environmental Protection Agency
WE: working electrode
Acknowledgements
This research was supported by the Funding for Beginner Lecturer Research Grants (PDP) 2022 of DRTPM Directorate General of Higher Education, Ministry of Education, Culture and Research and Technology (Kemendikbudristekdikti), in accordance with Research Contract (Master Contract Number: 116/E5/PG.02.00.PT/2022, 10 May 2022; Derivative Contract Number: 05/DRTPM/PDP/I/2022, 11 May 2022).

