


 Inglés (pdf)
 Articulo en XML
 Referencias del artículo
 Enviar articulo por email
 Citado por SciELO
  Similares en
SciELO
Similares en
SciELO 
 Permalink
1. Introduction
Hotels and other tourist accommodation establishments are among the most energy-intensive buildings in many countries (e.g., Becken, Frampton & Simmons, 2001; Michopoulos, Ziogou, Kerimis & Zachariadis, 2017; Taylor, Peacock, Banfill & Shao, 2009). This results in a high carbon footprint. For example, Scott et al. (2008, pp. 132-133) estimated that accommodations are responsible for 21% of tourism's global CO2 emissions. Lenzen et al. (2018) calculated that tourist accommodations emit 2,812 Mt CO2 annually (input-output analysis, without food). Such emissions are also anticipated to augment "from 1,101 Mt CO2 in 2010 to 2,957 Mt CO2 by 2050" in the "business as usual" scenario (Gössling & Peeters, 2015, p. 651).
Therefore, the complete decarbonisation of the global economy by 2050 needed to achieve the goals of the Paris Agreement (IPCC, 2018) constitutes a significant challenge for the tourist lodging sector, particularly for hotels. Research has shown that the hotel sector must reduce its carbon emissions by 66% from 2010 levels by 2030 and 90% by 2050 to stay within the 2˚C threshold agreed upon at the 2015 Paris Climate Conference (International Tourism Partnership, 2017). However, hotels and other tourist accommodation establishments may diminish their carbon footprint by increasing energy efficiency and utilising renewable energy (e.g., Gössling, 2010; International Tourism Partnership, 2017; Scott & Gössling, 2018; Scott et al., 2008).
The uptake of energy efficiency technologies and measures in the tourist lodging sector has been the subject of numerous research studies conducted inside and outside Europe (e.g., Becken & Dolnicar, 2016; Coles, Dinan & Warren, 2016; López-Bernabé, Foudi, Linares & Galarraga, 2021; Pinto, Afonso, Santos, Pimentel-Rodrigues & Rodrigues, 2017; Moutinho, Costa & Bento, 2015). The use of renewables in tourist accommodations has not received much attention in the scholarly literature. The majority of exceptions examine the economic and environmental gains and the feasibility of renewable energy utilisation in hotels (Dalton, Lockington & Baldock, 2008; 2009; Karagiorgas et al., 2006; Zografakis et al., 2011), or else, the determinants of renewable energy uptake in this type of tourist lodging (Dhirasasnaa, Becken & Sahin, 2020; Dhirasasnaa & Sahin, 2021; Mahachi, Mokgalo & Pansiri, 2015; Sardianou & Kostakis, 2020). Furthermore, there is a shortage of studies on adopting other types of renewable energy innovation in hotels.
This paper contributes to bridging this gap by examining the owners' and/or managers' perceptions and attitudes apropos the adoption of renewable energy innovations in hotels in a Southern European country, as well as the factors that affect the adoption. Our main research question is: How and to what extent are renewable energy innovations used in hotels? By pursuing this question in Portugal, this study tracks progress in the adoption of renewable energy innovations in hotels and provides information that may be used to promote the decarbonisation of tourist accommodations and, hence, tourism's sustainability in the country at stake.
The article's structure is as follows: After setting the study's theoretical background and formulating the research hypotheses, the article outlines the context of the study. Next, it describes the materials and methods. The following section presents the empirical data and the statistical analysis results. Subsequently, the article discusses the research results. Finally, it puts forward the principal conclusions and implications, highlights the study's limitations and gives suggestions for future research.
2. Theoretical background
According to Wüstenhagen, Wolsink and Bürer (2007), the social acceptance of renewable energy innovation (or technology) comprises three dimensions: socio-political, community and market. The first dimension describes the acceptance by the general public, policymakers, and key stakeholders. The second dimension relates to the responses of local actors to the installation of renewable energy projects. The third dimension refers to the investors, consumers, and intra-firms. This theoretical framework is valuable for the scope of this article, which investigates the adoption of renewable energy innovations by hoteliers.
Previous investigation has shown that the use of renewable energy in hotels is relatively low, namely, between 6% and 25% (Coles, Dinan & Warren, 2015; Dalton, Lockington & Baldock, 2007; Karagiorgas et al., 2006; Knowles, Macmillan, Palmer, Grabowski & Hashimoto, 1999). Scholars working on the topic detected various drivers and hindrances to the uptake of renewables in hotels in different parts of the world. For instance, Dhirasasnaa et al. (2020) demonstrated that the interaction between the perceptions of owners and managers, tourists' behaviour, incentive policy, technology advancement, and electricity grid prices might either facilitate or impede the utilisation of renewable energy in hotels in Queensland. Mahachi et al. (2015) similarly concluded that strong environmental values, the availability of environmental sustainability programs, political leadership, and financial benefits are the primary motivations for investing in renewable energy technologies in hotels in Botswana. Equally, Sardianou and Kostakis (2020) ascertain that human-related, organisational, economic, and informational factors thwart the use of renewables in hotels in Crete.
These factors parallel those influencing the adoption of other environmental technologies in the hotel sector. For example, González and León (2001) identified the category of facilities, chain affiliation, size, and managers' and clients' concerns about the environment as the main determinants of environmental technologies adoption in the hotel sector in Gran Canaria. Likewise, Smerecnik and Andersen (2011) identified the perceived simplicity, high levels of opinion leadership, relative advantage, and general innovativeness as the driving forces behind the adoption of environmental sustainability innovations in North American hotels (and ski resorts). In a similar vein, Chan, Okumus and Chan (2018) identified three categories of barriers to the adoption of environmental technologies in Hong Kong hotels: 1) product-related barriers, such as the immaturity of the technology, unreliability and long payback period; 2) external barriers, such as inconvenience caused by government, weather, and customers' acceptance of environmental technologies; and 3) internal barriers, such as physical limitations, lack of owner initiative, and lack of resources.
The aforementioned factors were detected in research studies focused on medium- and large-sized hotels in most cases. The adoption of innovation and sustainability technologies and practices in smaller hotels may well be affected by other factors. For instance, Islam, Zhang and Hasan (2019) concluded that collaboration and innovation of firms, employee culture, technological infrastructure, tourism intermediary's sustainability practices, and top management support have a significant influence on sustainability practices adoption in small- and medium-sized tourist accommodations in Bangladesh, while government sustainable tourism policy and locals' attitude towards sustainability have an insignificant influence. Furthermore, Coles, Dinan and Warren (2015) showed that the age of construction does not influence the adoption of renewable energy technologies in small- and medium-sized tourist lodgings in England. In turn, Silva (2022) showed that the characteristics of the units and respondents had no significant influence on the adoption of renewable energy innovations in rural tourist accommodations in Portugal, except for geographical location.
Derived from both the research question and the literature review, the following research hypotheses are formulated:
Hypothesis 1 [H1]. The sociodemographic characteristics of the hoteliers do not affect the adoption of renewable energy innovations;
Hypothesis 2 [H2]. Market factors affect the adoption of renewable energy innovations in hotels;
Hypothesis 3 [H3]. The opinion of hoteliers about the need to cut the carbon footprint of tourist accommodations influences the adoption of renewable energy innovations;
Hypothesis 4 [H4]. The star rating of hotels affects the adoption of renewable energy innovations;
Hypothesis 5 [H5]. The size of hotels influences the adoption of renewable energy innovations;
Hypothesis 6 [H6]. The building age of hotels does not influence the uptake of renewable energy innovations; and
Hypothesis 7 [H7]. Chain-affiliated hotels are more likely to use renewable energy innovations than independent hotels.
3. Context of the study
3.1 Carbon Emissions and the Hotel Sector in Portugal
In 2019, Portugal emitted 68.0 million metric tonnes of CO2 equivalents (Eurostat, 2022). Tourist accommodations are responsible for nearly 5% of CO2 emissions from tourism in the country, an industry which accounts for about 10% of Portugal's CO2 emissions (Moutinho et al., 2015, p. 218). Decarbonising tourist accommodations is, therefore, essential to achieve the 2050 net-zero carbon emissions target in Portugal.
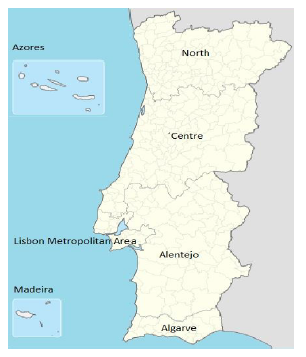
According to Statistics Portugal (INE, 2022), in 2021, 1,407 hotels were offering 210,587 beds, representing 22.4% of the tourist accommodation units and 52% of the tourist lodging capacity in Portugal. The regions with the highest number of hotels were the North (28.4%), the Centre (23.6%) and the Lisbon Metropolitan Area (19.2%), whereas those with the highest number of hotel beds were the Lisbon Metropolitan Area (24.6%), the North (20.9%) and the Algarve (20.1%) (see Table 1 and Figure 1).
Table 1 Number of hotels and beds by region in 2021
| Region | Number of hotels | Number of beds |
| North | 400 | 43,983 |
| Centre | 332 | 35,447 |
| Lisbon Metropolitan Area | 270 | 51,880 |
| Alentejo | 97 | 8,037 |
| Algarve | 161 | 42,397 |
| Azores | 67 | 8,874 |
| Madeira | 80 | 19,969 |
| Total | 1,407 | 210,587 |
Source: INE.
In addition, according to the same source (INE, 2022), hotels registered 9.4 million guests and 21.9 million overnight stays, corresponding to 64.7% of the guests and 58.7% of the overnight stays in the national tourist lodging sector. Of the 42.6 million overnight stays in tourist accommodations in 2021, 22.5 million fell on domestic tourists and 20.1 million on international tourists. After Portugal, the United Kingdom and Spain were the two most important source markets, with 3.0 million and 2.6 million overnight stays, respectively.
Furthermore, four-star hotels were first in the number of both establishments (473) and overnight stays (47.5%). Three-star hotels were second in the number of both units (438) and overnight stays (22.9%). Five-star hotels were fourth in the number of units (123) and third in overnight stays (20.2%). Two-star and one-star hotels were third and fifth in the number of units (291 and 61, respectively) and accounted for 9.5% of overnight stays.
According to Bacon (2021), the hotel sector in Portugal is very fragmented in terms of ownership, being dominated by domestic (87%), private (88%) and single unit owning companies (86% in the case of Portuguese companies and 73% in the case of international companies), with an important presence of family-owned businesses, which own and operate/manage their properties in most cases (80%).
3.2 Renewable Energy Policy Environment in Portugal
In contrast to other environmental indicators, the position of Portugal in the EU ranking concerning renewable energy is relatively high. In 2020, the country reached a 33.9% share of renewable energy in its gross final energy consumption - up from the target of 31% - which places Portugal in sixth place in the ranking of the 27 EU Member States (Eurostat, 2020). It also reached 59% of electricity generation from renewable sources, slightly below the target of 60%. Most, 98.1%, of this electricity was generated by large-scale projects (DGEG, 2021). This is a consequence of policy measures that have mainly privileged centralised projects and favoured big energy firms, rather than decentralised projects and collective or individual prosumers (e.g., Delicado et al., 2014; Silva & Sareen, 2021).
However, the Portuguese government recently implemented various measures to stimulate the uptake of renewable energy (innovations) by smaller actors. These included: legislation that permits the existence of collective and community self-consumption of renewables; incentives for self-consumption of solar-generated energy; and a credit line that supports projects of tourism and industrial companies aiming to produce renewables for self-consumption, to cut energy consumption and to switch to a circular economy (Silva, 2022). In July 2022, the VAT rate applied to solar panels has also been reduced from 23% to 6% in mainland Portugal.
Currently, the legal framework comprises two regimes for decentralised renewable electricity generation in Portugal: a Small Production Units (referred to as "UPPs") regime, in which all the electricity produced has to be injected into the national grid; and a Production Units for Self-Consumption (referred to as "UPACs") regime, in which the electricity produced has to be consumed individually, collectively, or by Renewable Energy Communities, or else, injected into the grid (Decree-Law No. 153/2014, of 10 October 2014; Decree-Law No. 162/2019, of 25 October 2019).
Additionally, the +Sustainable Tourism Plan 20-23 envisages that 75% of tourist accommodations adopt energy efficiency, water, and waste management systems by 2023 (Turismo de Portugal, 2021). This Plan is in line with the Guide for carbon neutrality in tourist accommodations, particularly in hotels, which includes a tool to measure their annual Greenhouse Gas emissions (Turismo de Portugal and NOVA Tourism and Hospitality Platform, 2021). As shown below, the effect of such legislation and measures starts to be detectable, albeit modestly, in the hotel sector. This is particularly the case of solar photovoltaic (hereafter PV) panels.
4. Materials and Methods
The empirical evidence presented in this article has been collected through an electronic mail-based survey conducted with hoteliers from July 14 to September 12, 2022. The electronic mail was sent to all hoteliers in Portugal utilising the addresses drawn from the National Tourism Firms Register online portal (with weekly reminders = 7). The survey was responded to by 208 hoteliers, corresponding to a response rate of 14.8%. The electronic mail included a link to the survey. Participants took approximately seven minutes to complete the survey.
The survey focused on the following main themes: hotel name; geographical location; size; star rating; building age; type of ownership; sociodemographic characteristics of the hoteliers; thoughts apropos the necessity to cut carbon emissions from tourist accommodations; thoughts regarding renewable energy production and use in hotels; types of renewable energy innovations (both tech and social) in which the businesses invested; motivations for and impediments to investing in those innovations; and use of renewable energy innovations adoption in marketing campaigns.
Regarding the star rating, two-star hotels had the highest response rate (see Table 2). Regarding the geographical location, the Autonomous Region of Madeira achieved the highest response rate, followed closely by the Alentejo and the Centre regions (see Table 3). Considering the size of the hotels, over half of the sampled units had less than 50 rooms and over one-third had less than 50 beds (see Table 4). Additionally, 34.6% (72/208) of the buildings where hotels are installed were built in the 21st century, 58.6% (122/208) were constructed in the 20th century, and 6.7% (14/208) were erected between the 17th (1660) and the 19th centuries. Also, the majority, 92.8% (193/208), of the sampled hotels were owned by Portuguese companies, of which 72.1% (150/208) were independent, family-based businesses which operated and managed the units in most cases (88.7% = 133/150 and 76.7% = 115/150, respectively).
Table 2 Star rating of the sampled hotels
| Star rating | Frequency | Number of hotels in the country | Sampled businesses |
| One-star | 9 | 61 | 14.8% |
| Two-star | 53 | 291 | 18.2% |
| Three-star | 64 | 438 | 14.6% |
| Four-star | 64 | 473 | 15.5% |
| Five-star | 18 | 123 | 14.6% |
| Unknown | 0 | 21 | 0% |
| Total | 208 | 1,407 |
Source: INE.
Table 3 Location of the sampled hotels
| Region | Frequency | Number of hotels | Sampled businesses |
| North | 53 | 400 | 13.3% |
| Centre | 60 | 332 | 18.1% |
| LMA | 34 | 270 | 12.6% |
| Alentejo | 18 | 97 | 18.6% |
| Algarve | 17 | 161 | 10.6% |
| Azores | 11 | 67 | 16.4% |
| Madeira | 15 | 80 | 18.8% |
| Total | 208 | 1,407 |
Source: INE.
Table 4 Size of the sampled hotels
| Number of rooms | Frequency | Percentage of all survey participants | Number of beds | Frequency | Percentage of all survey participants |
| ≤ 50 | 120 | 57.7 | ≤ 50 | 80 | 38.5 |
| 51-100 | 47 | 22.6 | 51-100 | 57 | 27.4 |
| 101-150 | 17 | 8.2 | 101-150 | 26 | 12.5 |
| 151-200 | 7 | 3.4 | 151-200 | 11 | 5.3 |
| > 200 | 17 | 8.2 | > 200 | 34 | 16.3 |
Source: Own survey.
Statistical quantitative data analysis was carried out using IBM SPSS Statistics 29. Two tests of the research hypothesis were performed: Pearson's chi-squared and Cramer's V estimator. These statistical tests were selected because they are often used and appropriate to analyse associations and the strength of influence between two categorical variables, the dependent and the independent (e.g., Heeringa, West & Berglund, 2017).
5. Findings
5.1 Hoteliers' Perceptions and Attitudes
The vast majority, 95.7% (199/208), of hoteliers surveyed - 132 owners-managers and 67 managers - stated that they agree that the tourist lodging sector must cut its carbon emissions to mitigate climate change. In contrast, the others declared that they had no opinion on this subject. Furthermore, 92.8% (193/208) of survey participants - 128 owners-managers and 65 managers - asserted that they were in favour of renewable energy production and use in hotels, whereas 14 of the remainder maintained that they had no opinion on this theme and 1 expressed opposition. All respondents who did not express a favourable opinion about these topics were not hotel owners.
And yet, only 37.9% (79/208) of survey participants - 61 owners-managers and 18 managers - declared having adopted renewable energy innovations. Table 5 summarises the types of innovations at stake. As shown, most innovations adopted were solar PV technologies, in which 32.7% (68/208) of hotels have invested, up from 14% in the entire national tourist lodging sector in 2019 (Turismo de Portugal, 2020). Moreover, 31.9% (52/163) of those innovations were related to the UPACs regime, including individual and collective self-consumption units (32 and 16 hotels, respectively). Significantly, only 8.9% (7/79) of adopters have invested in energy storage technologies. All innovations were funded, owned, and controlled by adopters. Additionally, respondents' participation in renewable energy communities or cooperatives was inexistent.
Table 5 Hotels star rating and types of innovations adopted
| Renewable energy innovations | 1-star | 2-star | 3-star | 4-star | 5-star | Percentage of all survey participants |
| Solar PV UPP | 2 | 10 | 10 | 5 | 0 | 12.9 |
| Solar PV UPAC Individual | 1 | 10 | 8 | 14 | 3 | 17.3 |
| Solar PV UPAC Collective | 1 | 2 | 6 | 4 | 3 | 7.7 |
| Biogas UPP | 0 | 0 | 0 | 1 | 0 | 0.5 |
| Biomass/biogas UPAC Individual | 0 | 1 | 0 | 1 | 2 | 1.9 |
| Micro/mini hydropower plant | 0 | 2 | 1 | 1 | 0 | 1.9 |
| Smart meter | 0 | 8 | 6 | 6 | 5 | 12.0 |
| Digital energy management systems | 0 | 0 | 1 | 5 | 5 | 5.3 |
| Demand response management system | 0 | 1 | 1 | 1 | 0 | 1.4 |
| Energy storage technologies | 0 | 1 | 1 | 3 | 2 | 3.4 |
| Electric vehicles chargers | 0 | 2 | 6 | 11 | 7 | 12.5 |
| Geothermal energy system | 0 | 0 | 1 | 2 | 0 | 1.4 |
Source: Own survey.
5.2 Factors Affecting the Adoption
Table 6 presents the results obtained using Pearson's chi-square method and Cramer's V estimator regarding the influence of several variables related to the respondents' sociodemographic characteristics on the adoption of renewable energy innovations in hotels, considering both the adopters and the non-adopters. As can be seen, the results are not significant for any of these variables - the P value is higher than the alpha P value of 0.05 in all cases, and Cramer's V estimator indicates a weak association for all cases, except for education level, for which it indicates a moderate association. The conclusion is that the hoteliers' sociodemographic characteristics do not affect the adoption of renewable energy innovations.
Table 6 Influence of sociodemographic characteristics on adoption
| Sociodemographic characteristics | Adopters | Non-adopters | Sum | X2 | DoF | P value | V |
| Gender Male Female Nonbinary | 56 23 0 | 96 31 2 | 208 152 54 2 | 1.796 | 2 | .407 | .093 |
| Age ≤ 45 years 46-64 years ≥ 65 years | 27 41 11 | 22 71 26 | 208 59 112 37 | 2.319 | 3 | .511 | .105 |
| Education 4th grade 9th grade 12th grade Professional degree University degree Not provided | 0 1 3 12 2 0 | 15 14 39 8 106 8 | 208 15 15 42 20 108 8 | 6.910 | 5 | .228 | .182 |
| Citizenship Portuguese Other | 73 6 | 121 8 | 208 194 14 | 0.028 | 1 | .867 | .012 |
Note: X2 = chi-squared value; DoF = degree of freedom.
It is noteworthy that both groups of survey participants (hotel managers and hotel owners and managers simultaneously) expressed similar perceptions about the drivers and hindrances to adopting renewable energy innovations. As shown in Table 7, most adopters indicated economic benefits as the main motivations to invest in renewable energy innovations, notably "decreases energy cost", "to attract eco-friendly customers", and "favourable cost-benefit ratio"; but only 22.8% (18/79) of adopters reported mentioning it in their marketing campaigns. However, a considerable number of adopters also included environmental benefits in the reasons given for adoption, namely, "mitigates climate change" and "decreases local air pollution".
Table 7 Drivers mentioned by the adopters
| Motivations | No. of managers | % of all adopters | No. of owners-managers | % of all adopters |
| Decreases energy cost | 11 | 13.9 | 54 | 68.4 |
| Decreases local air pollution | 6 | 7.6 | 23 | 29.1 |
| Favourable cost-benefit ratio | 5 | 6.3 | 25 | 31.6 |
| Mitigates climate change | 13 | 16.5 | 46 | 58.2 |
| Profit from electricity sale | 2 | 2.5 | 3 | 3.8 |
| Government subsidies | 0 | 0 | 3 | 3.8 |
| Tax benefits | 4 | 5.1 | 2 | 2.5 |
| To attract eco-friendly customers | 9 | 11.4 | 23 | 29.1 |
| To create a competitive advantage | 5 | 6.3 | 9 | 11.4 |
| Request from customers | 1 | 1.3 | 1 | 1.3 |
Table 8 reports the statistical tests results obtained for each driver/variable, considering both the adopters and the non-adopters. The results are statistically significant for "decreases energy cost", "to attract eco-friendly customers", "favourable cost-benefit ratio", "to create a competitive advantage", "tax benefits", and "profit from electricity sale" - the P value is lower than the alpha P value of 0.05 in all cases. It means that the dependent variable, the adoption of renewable energy innovations in hotels, depends on all these independent variables. Cramer's V estimator reinforces this conclusion but only in relation to the first four variables - it indicates a strong association between the first three variables and the adoption of renewable energy innovations, a moderate association between the fourth variable and the dependent variable, and a weak association between the last two variables and the dependent one. The results are also statistically significant for the variables "mitigates climate change" and "decreases local air pollution" - the P value is lower than the alpha P value of 0.05 in both cases. Cramer's V estimator also indicates a strong association between the variables at stake. The conclusion is that these two variables influence the adoption of renewable energy innovations in hotels. Nevertheless, the results are not significant for "government subsidies" and "request from customers" - the P value is higher than the reference P value of 0.05 in both cases. It means that the existence of "government subsidies" and "demand from customers" do not affect the adoption of renewable energy innovations in hotels. Cramer's V estimator supports the same conclusion by indicating a low value.
Table 8 Influence of perceived drivers on adoption
| Motivations | X2 | DoF | P value | V |
| Decreases energy cost | 154.384 | 1 | <.001 | 0.862 |
| Decreases local air pollution | 55.026 | 1 | <.001 | 0.514 |
| Favourable cost-benefit ratio | 57.244 | 1 | <.001 | 0.525 |
| Mitigates climate change | 134.491 | 1 | <.001 | 0.804 |
| Profit from electricity sale | 8.366 | 1 | .004 | 0.201 |
| Government subsidies | 4.970 | 1 | .026 | 0.155 |
| Tax benefits | 10.088 | 1 | .001 | 0.220 |
| To attract eco-friendly customers | 61.754 | 1 | <.001 | 0.545 |
| To create a competitive advantage | 24.511 | 1 | <.001 | 0.343 |
| Request from customers | 1.641 | 1 | .200 | .089 |
In turn, as shown in Table 9, most non-adopters highlighted unfavourable market factors as the main reasons for not investing in renewable energy innovations, chiefly "high equipment cost", "insufficient tax subsidies", "insufficient government subsidies", and "absence of information on systems and technologies". "Lack of knowledge" was also mentioned as the main reason for not being part of a renewable energy community or cooperative by 33 respondents, 30 of whom were hotel owners/managers. Yet, a considerable number of respondents also indicated other barriers to the adoption, namely, "lack of space" (to install the equipment) and "legal, regulatory, or administrative hindrances", including bureaucratic difficulties in accessing government support and the interdiction of putting solar PV panels in buildings located in protected sites.
Table 9 Barriers mentioned by the non-adopters
| Barriers | No. of managers | % of all non-adopters | No. of owners-managers | % of all non-adopters |
| Absence of information on systems and technologies | 19 | 14.7 | 24 | 18.6 |
| High equipment cost | 44 | 34.1 | 61 | 47.3 |
| Insufficient government subsidies | 17 | 13.2 | 25 | 19.4 |
| Insufficient tax benefits | 22 | 17.1 | 29 | 22.5 |
| Lack of space | 3 | 2.3 | 19 | 14.7 |
| Legal, regulatory, or administrative hindrances | 3 | 2.3 | 13 | 10.1 |
| Unfavourable cost-benefit ratio | 4 | 3.1 | 2 | 1.6 |
Source: Own survey.
Table 10 presents the results obtained using the statistical tests for each barrier/variable, considering both the adopters and the non-adopters. The results are significant for "high equipment cost", "insufficient government subsidies", "absence of information on systems and technologies", "insufficient tax benefits", "lack of space", and "legal, regulatory, or administrative hindrances" - the P value is lower than the alpha P value of 0.05 in all variables. The conclusion is that these factors thwart the adoption of renewable energy innovations in hotels. Cramer's V estimator indicates a strong association between "high equipment cost" and adoption, a weak association between "legal, regulatory, or administrative hindrances" and adoption, and a moderate association between the remaining variables and adoption. Additionally, the results are not significant for the variable "unfavourable cost-benefit ratio" - the P value is higher than the P alpha value of 0.05 and Cramer's V estimator indicates a low value. It means that this variable does not influence the adoption of renewable energy innovations.
Table 10 Influence of perceived barriers on adoption
| Barriers | X2 | DoF | P value | V |
| Absence of information on systems and technologies | 33.196 | 1 | <.001 | 0.399 |
| High equipment cost | 129.853 | 1 | <.001 | 0.790 |
| Insufficient government subsidies | 41.378 | 1 | <.001 | 0.446 |
| Insufficient tax benefits | 32.229 | 1 | <.001 | 0.394 |
| Lack of space | 15.066 | 1 | <.001 | 0.269 |
| Legal, regulatory, or administrative hindrances | 10.615 | 1 | .001 | 0.226 |
| Unfavourable cost-benefit ratio | 3.784 | 1 | .052 | 0.135 |
Table 11 reports the number of hotels that have invested, or not, in renewable energy innovations, according to the respondents' opinions about the need to cut carbon emissions from tourist lodgings. The results obtained are not significant - the P value is higher than the alpha P value of 0.05 and Cramer's V estimator indicates a quite low value. Thus, the adoption of renewable energy innovations does not depend on the hoteliers' opinion about the need to reduce the carbon footprint of tourist accommodations.
Table 11 Influence of hoteliers' opinions about the need to cut carbon emissions on adoption
| Agree | No opinion | ||||||
| REI adoption | of ef | of ef | Sum | X2 | DoF | P value | V |
| No | 122 122.3 | 7 5.6 | 129 | 0.992 | 1 | .319 | 0.069 |
| Yes | 77 75.6 | 2 3.4 | 79 | ||||
| Sum | 150 | 58 | 208 |
Note: REI = renewable energy innovations; of = observed frequency; ef = expected frequency
To understand if the characteristics of the hotels and the type of hotel ownership affect the adoption, we tested the following variables: 1) star rating; 2) size; 3) property age; and 4) type of ownership. None of these variables has a significant influence on the adoption of renewable energy innovations, as will be seen below.
Table 12 presents the number of hotels that have adopted or have not renewable energy innovations by star rating. As can be seen, the results obtained are not significant - the P value is higher than the P alpha value of 0.05 and Cramer's V estimator indicates a quite low value. Hence, adopting renewable energy innovations is not associated with the star rating of hotels.
Table 12 Influence of star ranking on adoption
| 1-star | 2-star | 3-star | 4-star | 5-star | ||||||
| REI adoption | of ef | of ef | of ef | of ef | of ef | Sum | X2 | DoF | P value | V |
| No | 7 5.6 | 34 32.9 | 40 39.7 | 40 39.7 | 8 11.2 | 129 | 3.424 | 4 | .490 | 0.128 |
| Yes | 2 3.4 | 19 20.1 | 24 24.3 | 24 24.3 | 10 6.8 | 79 | ||||
| Sum | 9 | 53 | 64 | 64 | 18 | 208 |
Table 13 displays the number of hotels that have invested, or not, in renewable energy innovations by size measured in number of rooms. Once again, the results obtained are not significant - the P value is higher than the P alpha value of 0.05 and Cramer's V estimator indicates a low value. It means that adopting renewable energy innovations does not depend on the hotel size.
Table 13 Influence of size on adoption
| ≤ 50 | 51-100 | 101-150 | 151-200 | ≥ 201 | ||||||
| REI adoption | of ef | of ef | of ef | of ef | of ef | Sum | X2 | DoF | P value | V |
| No | 76 76.3 | 31 29.1 | 11 9.3 | 3 4.3 | 8 9.9 | 129 | 3.200 | 2 | .525 | 0.124 |
| Yes | 4 46.7 | 16 17.9 | 4 5.7 | 4 2.7 | 8 6.1 | 79 | ||||
| Sum | 123 | 47 | 15 | 7 | 16 | 208 |
The same is true for property age. Table 14 shows that the corresponding P value is higher than the alpha P value of 0.05, and Cramer's V estimator reaches a low value. There is, thus, no association between the age of construction and the adoption of renewable energy innovations in hotels.
Table 14 Influence of property age on adoption
| 1660-1900 | 1901-2000 | 2001-2021 | ||||||
| REI adoption | of ef | of ef | of ef | Sum | X2 | DoF | P value | V |
| No | 8 8.7 | 80 75.7 | 41 44.7 | 129 | 1.583 | 1 | .453 | 0.124 |
| Yes | 6 5.3 | 42 46.3 | 31 27.3 | 79 | ||||
| Sum | 14 | 122 | 72 | 208 |
There is also no correlation between the type of ownership and the use of renewable energy innovations in hotels. As shown in Table 15, the P value is higher than the alpha P value of 0.05 and Cramer's V estimator indicates a weak association between the two variables.
6. Discussion
The data presented above showed that the adoption level of renewable energy innovations in hotels in Portugal is low. In fact, less than two-fifths of hoteliers who responded to our survey have adopted such innovations, most of which were solar PV panels. This study finding is in line with previous research on the adoption of renewable energy technologies in hotels elsewhere worldwide (Coles, Dinan & Warren, 2015; Dalton, Lockington & Baldock, 2007; Karagiorgas et al., 2006; Knowles, Macmillan, Palmer, Grabowski & Hashimoto, 1999). It is also consistent with the findings of the author's study on the uptake of renewable energy innovations in the Portuguese rural tourist accommodation sector (Silva, 2022).
Additionally, statistical tests proved that the sociodemographic characteristics of the hoteliers do not influence the adoption of renewable energy innovations. This finding validates our Hypothesis 1 and is in line with the results of Silva's (2022) investigation on adopting such innovations in tourist accommodations in rural Portugal. Furthermore, most survey participants included economic benefits in the reasons given for adoption and unfavourable market factors in the reasons given for non-adoption. Likewise, the statistical data analysis confirmed that market factors may either drive or obstruct the adoption of renewable energy innovations in hotels, thus validating Hypothesis 2. The latter results are in accordance not only with those of other scholars working on the drivers and barriers to the adoption of renewable energy and/or other environmental technologies in hotels in other countries (Chan et al., 2018; Dhirasasnaa & Sahin, 2021; Dhirasasnaa et al., 2020; González & León, 2001; Sardianou & Kostakis, 2020; Mahachi et al., 2015) but also with those of the previous study carried out by the author on renewable energy innovations adoption in Portugal (Silva, 2022).
The survey respondents and the statistical data analysis results also indicate that environmental benefits are drivers of adopting renewable energy innovations. This finding is consistent with the findings of other investigations on the motivations to invest in renewable energy and other environmental technologies/innovations in tourist accommodations in Portugal and other countries (González & León, 2001; Mahachi et al., 2015; Silva, 2022).
Nevertheless, statistical tests have shown no relationship between hoteliers' opinions on the need to cut the carbon footprint of tourist accommodations and adopting such innovations, thus invalidating our Hypothesis 3. Also, both the respondents and the statistical results proved that "lack of space" hinders the adoption of renewable energy innovations in hotels. Chan et al. (2018) and Mahachi et al. (2015) identified the same obstacle to adopting innovative technologies in hotels in other parts of the world.
Moreover, the statistical data analysis results demonstrated that the characteristics of the hotels - star rating, building age, and size measured in number of rooms - and the type of ownership - independent and chain-affiliated - have no statistically significant influence on adoption, thus validating our Hypothesis 6 and invalidating out Hypotheses 4, 5 and 7. These findings are partially parallel and partially distinct from those of other investigations. For instance, there is evidence from Gran Canaria and Botswana that larger hotels affiliated with a chain are more likely to adopt renewable energy and/or other environmental technologies (González & León, 2001; Mahachi et al., 2015). There is also evidence from England that the age of construction is not determinant of renewable energy technologies adoption in tourist lodgings (Coles et al., 2015). And there is evidence from Portugal that adopting renewable energy innovations is not influenced by the number of rooms and the building age of tourist facilities (Silva, 2022).
7. Conclusions and Implications
7.1 Conclusions
This study aimed to understand how and to what extent renewable energy innovations are used in hotels in Portugal. The study showed that notwithstanding the respondents' positive perceptions of renewable energy, the adoption level of renewable energy innovations in hotels is low. Furthermore, the reasons given for this gap relate mainly to unfavourable market factors. In addition, market factors have a statistically significant influence on adoption. In contrast, the characteristics of the hotels and hoteliers, their opinion about the need to reduce the carbon footprint of tourist accommodations and the type of hotel ownership have an insignificant influence.
7.2 Theoretical Implications
The main contribution of this study to the academic literature is that it adds to the existing knowledge about the adoption of renewable energy innovations in tourist accommodations, particularly in hotels, with reference to a southern European country highly dependent on tourism and using quantitative methods.
7.3 Practical Implications
The main practical implication of this research is that Portuguese authorities now have data that may be utilised to devise strategies to increase the adoption of renewable energy innovations in Portugal's tourist accommodation sector. Notably, we encourage national and local authorities to bring out legislation, to set goals for the uptake of those innovations in tourist lodgings and to implement measures aiming at mitigating the barriers to the adoption identified above, such as the delivery of reliable information about the innovations at stake to hoteliers, the offer of higher government incentives/subsidies and the reduction of bureaucracy.
7.4 Limitations and Future Research
This study has at least two limitations. First, the sample size is relatively small; therefore, the findings do not entirely reflect what is happening in the entire hotel sector in Portugal. Second, the research centred on the viewpoint of hoteliers, excluding the perspectives of other actors who affect the adoption of renewable energy innovations in hotels (e.g., installers, national and local authorities, electricity firms, and customers). Future research could augment the sample size used in this article and produce a cross-country comparison of renewable energy innovations adoption in hotels.

