


 Inglés (pdf)
 Articulo en XML
 Referencias del artículo
 Enviar articulo por email
 Citado por SciELO
  Similares en
SciELO
Similares en
SciELO 
 Permalink
1. Introduction
The concern about environmental impacts or the economic damage resulting from the lack of environmental planning has made the search for studies on environmental fragility increasingly constant, which ends up extending discussions regarding its efficiency and the importance of its various methodologies.
According to Ross (2006, p. 97), the watershed is chosen as a unit of analysis in fragility studies mainly due to the relationships of the existing and interconnected elements, which make it possible to make analogies and interpret the functioning of a smaller delimitation of space. Fierz (2015, p. 610) mentions that Sotchava, in his theory on geosystems in 1977, already stated that all elements of space influence or are influenced by other elements, through exchange of energy and matter. Likewise, when a delimitation is made, it is possible to perform a better analysis of these relationships in a given space.
Geomorphological studies in environmental planning, in general, propose the integrated analysis of the environment, in order to seek answers about its elements, in such a way to consider the relief, climate, forms of use, type of vegetation, rainfall, pedology and geology (Ross, 1994, 63-73). With the help of Geographic Information Systems - GISs, these elements are arranged on maps, which, when superimposed and through weighting of variables, may indicate the most susceptible areas to the occupation or installation of enterprises.
For Ross and Fierz (2017, p. 65), GISs over the years have become the main tools for the study and diagnosis of watersheds. This is because GISs help in the integration of information from each variable chosen for analysis and the information contained in maps, especially pedological, geological and land use. With this, it is possible to superimpose thematic maps and data of the physical characteristics of each area of interest, as well as adding historical images of areas relative to use and occupation, making it possible to collect more actual data of the characteristics of each drainage network and highlight areas that may have potential for processes that point to levels of fragility (França et al, 2017, p. 24).
Based on Tricart’s Eco-dynamic concept, of 1977, Ross (1994, 63-73) presented a methodological proposal for analyzing the fragility of stable and unstable environments, classifying in hierarchical levels the characteristics found within each variant defined for analysis. Thus, the dynamics of the functioning of a geosystem can only be understood through the integrated analysis of a territory, due to the diversity of both the natural physical characteristics and the characteristics imposed by the occupation of a given territory.
The idea brought by the methodology proposed by Ross (1994, 63-73) is that all these components of the geographic stratum should be surveyed and analyzed individually, as they are distinct, but they must be analyzed in an integrated way, “always based on the principle that nature has intrinsic functionality between its physical and biotic components” (Ross and Fierz, 2017, p. 66).
The installation of Hydroelectric Power Plants in recent years, according to Gallardo et al (2017, p. 22-47), has generated new dynamics in the landscape, accelerated existing degradation processes or initiated new processes and the loss of the natural landscape, resulting from the installation of large enterprises, as well as the “extinction of rapids and the emergence of lakes, in addition to the resulting decrease in biodiversity, emergence of erosive processes and the generation of pollutants, mainly in flooded areas” (Gallardo, 2017, p, 33).
Currently, the use of water resources depends on diagnostic studies of environmental quality. Each environment, if respected and studied, can determine the type of occupation to be carried out, thus avoiding the evolution of erosive processes and environmental disasters, mainly associated with the change of river channels with the creation of reservoirs in large dams.
For Morais et. al (2010), the factors that influence the water regime and the production of sediments in Brazilian basins depend on the systemic action of natural conditions and human activities. Thus, it is admitted that some basins have higher levels of fragility, due to the pedological and geological characteristics, as well as the interaction with the characteristic rainfall patterns of each region or section.
Among energy generation activities, hydroelectric plants was the fastest growing in Brazil, since the 70s of the 20th century. (Albuquerque et al., 2010; Gallardo et al, 2017). From this, the impacts on hydrographic basins, the main unit for the environmental analysis, became constant and cumulative, if we consider that a single basin receives the installations of one or more Small Hydroelectric Centrals and Hydroelectric Power Plants.
In Brazil, CONAMAResolution No. 001/86 establishes the definition of environmental impacts, which impacts are classified in the resolution as direct and/or indirect, which is also established by directly and indirectly affected areas of influence. Carvalho et al (2018, p. 641) state that the Area of Direct Influence - ADI encompasses areas in which the impacts generated directly affect the environment and/or society, and may cover the area of the hydrographic basin where it is included, taking into account rural properties and surrounding communities. Therefore, based on the choice of the study area where diagnosis is to be carried out, it is possible to establish a cutout for the area of influence of the impact.
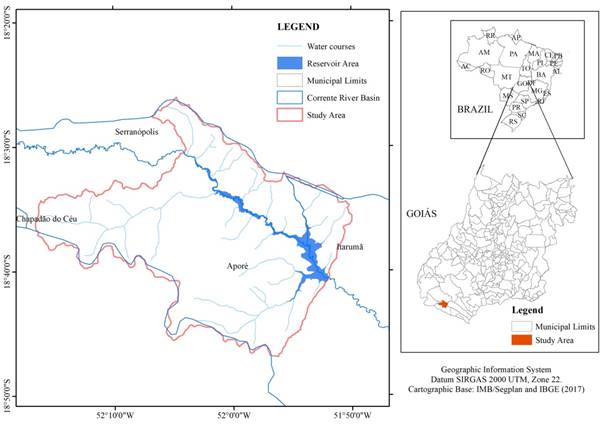
In view of the need to assess the different landscape delimitations and mainly discuss the impacts of the reservoirs and the weaknesses that may result from land use in these areas, the area chosen for the present study was the area of direct influence of the Espora Hydroelectric Power Plant, which has about 30 km² and is installed in the Corrente River, approximately 455 km southwest of Goiânia, with a distance of 55 km from the urban area of Serranópolis/GO.
The general objective of the present study was to detect sites with the lowest and highest degree of environmental fragility in the Area of Direct Influence (ADI) of the Espora Hydroelectric Power Plant (HEPP), through the integration of data, aiming to collaborate with the management and planning of the Corrente River basin.
According to the company Espora Energética S.A. (Espora), the project was created in May 2001. The installation of the Espora HPP took place in a rural area, with no need to relocate people or houses. The reservoir area occupies 28,057 km² and its dam is 45.78m high. It has been granted for use for 35 years. As we will see later, the area has a history of occupation by pastures, and this has been gradually replaced in recent years by monocultures of mostly corn, soybeans and sugarcane.
The delimitation comprises the directly affected portion of the reservoir area, in this case, considering the physical impoundment of the HEPP and its influence, comprising an area of 839.3 km² and a perimeter of 181 km. In view of the large extension of the Corrente River Basin, the area of direct influence was delimited with a natural barrier identified in the first waterfall, upstream of the flooding area, identified in the vicinity of the village of Itumirim/GO, and the springs that comprise the area up to the impoundment. Figure 1 shows the delimitation selected as the area of direct environmental influence, susceptible to changes caused by changes in the form of use and occupation after installation of the HEPP.
2. Methodological procedures
This study presented the hypothetical deductive method of analysis, influenced by the methodologies of environmental studies, adopting the landscape as a category of geographic analysis, the river basin as a spatial unit, and, finally, the methodology of environmental fragility, initially proposed by Ross (1994, p. 65) and reviewed by Ross and Fierz (2017, 58-77), as an evaluation model.
Thus, the present study presents the analysis of potential and emerging environmental fragility, in the spatial area of direct influence of the Espora Hydroelectric Power Plant - Espora HEPP, delimited for this study, predominantly covering the municipality of Aporé/GO, in order to understand the characteristics of the different levels of fragility to be found.
The methodological model applied aimed at using the classes of slope, which are also related to the pedological variable, geology/geomorphology, climate and land use and cover. The survey of the variables mentioned, according to Ross (1994, p. 63), is essential for generating the synthesis product and geomorphological analysis, the fragility of the site from its genetic characteristics, and the level of intensification of this fragility due to anthropic influence.
Thus, climatic characteristics were surveyed and geomorphology/geology map, to understand the dynamics caused by slope, land use map and pedological map were generated, considering that only after obtaining these maps on can generate Potential Fragility and Emerging Fragility maps. Table 1 shows the classification of the variables found in the area and the score applied according to their variations in slope, land use, climate and pedology.
Table 1 Classification of fragility levels er variable.
| VARIABLE | FRAGILITY LEVEL | |
|---|---|---|
| Sloe | ||
| 0 - 2% - Flat | 1 | |
| 3 - 15% - Gently Undulating | 2 | |
| 16 - 30% - Undulating | 3 | |
| 31 - 50% - Strongly Undulating | 4 | |
| Land use | ||
| Natural vegetation | 1 | |
| Flooded Areas | 1 | |
| Pasture | 3 | |
| Agriculture | 4 | |
| Silviculture | 2 | |
| Climate | ||
| Uneven Annual Distribution (Dry eriods between 2 and 3 Months in Winter and Rainfall volumes from 1,300 to 1,600 mm/year). | 3 | |
| Pedology | ||
| Medium-textured Latossolos (Oxisols) | 2 | |
| Sandy-textured Latossolos (Oxisols) | 3 | |
| Neossolos (Entisols) | 4 | |
Organization: Authors (2019)
The present study was conducted using geoprocessing application procedures, constructing the maps from Shuttle Radar Topography Mission - SRTM images, obtained through the site of the United States Geological Survey (USGS, 2015), with spatial resolution of 30 m, and the cartographic bases obtained through the RADAMBRASIL Project (1981) and from the database of the Goiás State Geoinformation System - SIEG. The processing of these databases, both for the delimitation of the basin area and for the physical aspects, was carried out with ArcMap 10.1® geoprocessing software (ESRI, 2015), licensed for use in the Geoinformation Laboratory of UFG/Regional Unit of Jataí. Thus, maps of geology, pedology, geomorphology, hypsometry, slope and land use and cover were generated.
For the characterization and evaluation of pedology, geology and geomorphology of the area, surveys were carried out in laboratory, together with analyses of existing maps, in the database RADAMBRASIL Folha SD 22 - Goiás (1981), at a scale of 1,000,000. The Geological/Geomorphological map, elaborated from this database, was used as a support for the analysis of the identification of influences by morpho-structure and morpho-sculpture, aiming at greater level of detailing in the field, for a scale of 1:100,000, with particle-size analysis of soils, characteristics of relief and vegetation, also relating to the existing data of the parent material, relief, climatic and hydraulic conditions, general characteristics, which are fundamental in the characterization in the research area.
The pedological classification was performed based on the classification of the Brazilian Soil Classification System - SiBCS, by Santos et al. (2018, 356p), which establishes 6 categorical levels, where the first four levels are called orders, suborders, major groups and subgroups, while the others have atypical characteristics and remain under discussion for classification, along with the opening of pedological profiles in the field, as well as collection and granulometric analysis.
To construct the Digital Elevation Model (DEM) and generate hypsometry and slope maps, the river basin was delimited by the topographic factor, applying the procedure already described by Souza (2012, 12-22), with SRTM images, using the following processing commands in ArcGIS 10.1® software; Spatial analyst Tools - Hydrology: - Fill: fill the surface of the image removing small imperfections; - Flow Direction: evaluation of flow direction; - Flow Accumulation: accumulated flow; - Watershed: delimitation of the basin; - Raster to Features: Conversion of the basin, from image to polygon.
For the survey of climatic data, due to the low distribution of weather stations along the basin and their proximity, bibliographic references about the climate of the region were used, as well as data from bibliographic and scientific materials, based on rainfall levels of the year 2017, collected by the Automatic Surface Observation Meteorological Station of Jataí, for the mode of exhibition of regional characteristics.
These data were made available on the HidroWeb portal (http://hidroweb.ana.gov.br/) under the responsibility of the National Water Agency - ANA, a national database for hydrological information, part of the National Information System on Water Resources - SNIRH. Thus, for confirmation, the rainfall levels of 2017 in the most comprehensive season to the research area were surveyed for analysis of monthly rainfall data, summing all precipitation occurred in the months of this year, and summing the monthly levels to obtain the annual rainfall values.
The land use and cover map of the Corrente River Basin (CRB) was generated by following the methodology of maximum likelihood classification, using images of the Landsat 8 Satellite (2018) made available by the United States Geological Survey (USGS, 2015), with spatial resolution of 30 meters. The information was classified with respect to vegetation cover, pasture, agriculture, silviculture, exposed soil and water mass and confirmed on a field visit. ArcMap 10.1® software (ESRI, 2015) was used to generate an automatic classification, Isoseg, a data clustering algorithm that could be reclassified and adjusted with the creation of polygon shapes of each type of use to improve the final results.
To generate potential fragility, the maps of climatic, clinographic and pedological characteristics received new indicators added to the table of attributes, where the field “Fragility” was created so that each item described had a classification, in this case from one to five, according to methodological description of the fragility levels calculated by simple average. This base, generated in polygon, was transformed to Raster through the ArcToolbox tool along with the Conversion Tools>To Raster>Polygon to Raster function, and only then could they be calculated.
The calculation entered in the software program, together with the Spatial Analyst Tools >Map Algebra> Raster Calculator function present in the ArcToolbox tool, used for generating indicators for the Potential Fragility Index - PFI, was expressed by the following formula:
PFI = (1) CLIM_VALUE + (2) SOIL_VALUE + (3) SLP_VALUE/3
Where CLIM_VALUE refers to climate, SOIL_VALUE refers to soil and SLP_VALUE refers to slope.
The result of the generation of this map is the basis of the next product, the emerging fragility, which uses the PFI and the base map concerning the delimitation of the areas of land use and occupation, expressed by the formula:
PFI + USE_OCCUP = EFI
Where PFI is the Potential Fragility Index, USE_OCCUP is the base of use and occupation, already changed in its table of attributes, with addition of the levels of fragility by type of occupation, according to the methodology described. EFI is the result of the final product, the Map of Emerging Fragility Index of the area, where the areas of emerging instability were identified according to the types of anthropic interventions and their impacts.
These intermediate cartographic products, along with the result of the mapping of structural features, provided the data necessary to perform the analyses and make considerations.
3. Results and discussion
3.1 Climate Characterization
According to the studies conducted by Mariano (2005, 251p.) and Lima and Mariano (2014), rainfall and air temperature vary seasonally in the region throughout the year, and this is considered a predominant climatic characteristic in the Brazilian Cerrado. The annual total rainfall levels in 2017 were surveyed and indicated predominance of rainfall distributed between October and May, as well as scarcity of rainfall in the months from June to September. According to the characteristics established in the proposed methodology in application, the climate had classification 3 regarding the level of existing potential fragility, where there is a situation of rainfall with unequal annual distribution, with dry periods between 2 and 3 months in winter (From July to September) and in summer with higher intensities from December to March, with volumes from 1,300 to 1,600 mm/year.
3.2 Geology and geomorphology
The characteristics of Geomorphology and Geology were used as a basis for the analysis of the dynamics of the present relief. The geomorphological map showed that the area is characterized by some portions of plateaus upstream of the reservoir, characteristic in the upper course of CRB. The delimited area is located in a transition from upper to lower course, transporting deposits and detrital sedimentary covers (Figure 2) originating from the weathering processes of the rocks, occurring from the top of the basin, which explains the denomination for the intermediate coalescent surface, present throughout the middle course of the CRB.
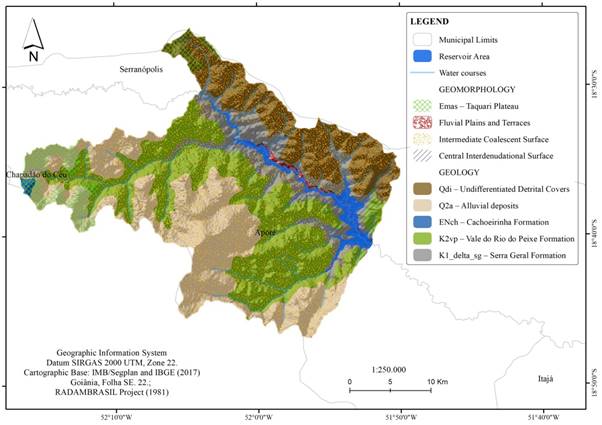
Santos (2013, p. 63) argues that the interdenudational areas are characteristic of sites that receive material that has been weathered and eroded, coming from steeper areas. Note that this area becomes wider as it reaches the lower course, where there is the presence of the more pronounced reliefs of the Marília Formation.
Regarding its geology, it is possible to note the presence of the Vale do Rio do Peixe Formation, which according to Fernandes (2004, p. 57) has coarse- to fine-grained sandstone and crossed structures. Thus, the presence of this formation was identified along the water courses of the tributaries that flow into the Corrente River, always overlapping with the basalts of the Serra Geral Formation.
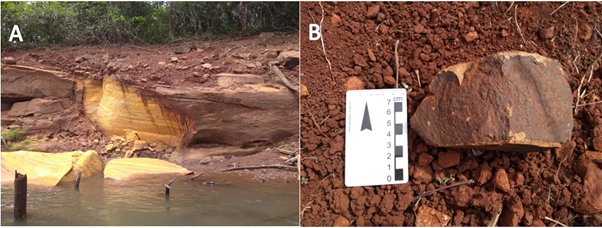
According to the description of Souza and Candeiro (2012, p. 9), the Vale do Rio do Peixe Formation is formed by sandstones interspersed with siltstones or sandy mudstones, which can be very fine to fine, pinkish light brown to orange, and uniformly sorted. This could be associated with the sandstones found in the area under study, with orange color and visibly crossed stratigraphy, shown in Figure 3(A), identified on the banks of the Corrente River, enabling the identification of the Vale do Rio do Peixe Formation.
Authors’private collection, January 2018
Figure 3 (A) Sandstone of the Vale do Rio do Peixe formation and (B) Basaltic Rock of the Serra Geral Formation.
According to Hartmann (2014, p. 175), the Serra Geral Formation was formed by numerous lava spills, which enabled the formation of several types of volcanic rocks, with different characteristics; “the dominant rocks are basalt, basaltic andesite and andesite, few rhyodacites and rhyolites”. The Serra Geral Formation contemplated the entire area of the river valley along this part of the basin and characterizes the areas of waterfalls and rapids identified upstream of this delimitation, as well as some tributaries.
In the area under study, basaltic igneous rocks were also identified, outcropping near the village of Itumirim and characterizing the incidence of steps and rapids along the river. Figure 3(B) shows an example of a basaltic rock fragment in the study area. The geological characteristics found in the area not only enabled the relationship with local geomorphology, but also the relationship with the textures of the soil types analyzed. This is because the weathering of sandstone in tropical environments can accelerate the process of material breakage, resulting in sandy soils with low compaction capacity, especially in areas of low organic matter concentration (Freitas, 2016, p. 31).
According to Hartmann (2014, p. 175), the Serra Geral Formation was formed by numerous lava spills, which enabled the formation of several types of volcanic rocks, with different characteristics; “the dominant rocks are basalt, basaltic andesite and andesite, few rhyodacites and rhyolites”. The Serra Geral Formation contemplated the entire area of the river valley along this part of the basin and characterizes the areas of waterfalls and rapids identified upstream of this delimitation, as well as some tributaries.
In the area under study, basaltic igneous rocks were also identified, outcropping near the village of Itumirim and characterizing the incidence of steps and rapids along the river. Figure 4 shows an example of a basaltic rock fragment in the study area.
The geological characteristics found in the area not only enabled the relationship with local geomorphology, but also the relationship with the textures of the soil types analyzed. This is because the weathering of sandstone in tropical environments can accelerate the process of material breakage, resulting in sandy soils with low compaction capacity, especially in areas of low organic matter concentration (FREITAS, 2016, p. 31).
3.3 Slope
Slope was used in this proposal, as the type of mapping does not allow the use of relief dissection for analysis, because the proposal of fragility in the methodology used requires a larger scale, between 1:10,000 and 1:50,000. This study presents scale varieties from 1,50,000 to 1,000,000,000, because of the already existing database used, and only soil and land use mapping was verified in the field by ground truth.
Thus, the slope map made it possible to use the contour lines existing in the charts of both IBGE and SRTM, of 90 m and 30 m, to generate the slope; the levels of dissection could not be generated with the cartographic scale used. These adaptations are used for the Midwest region of Brazil, given the absence of detailed mapping, as it is in an area of agriculture and livestock farming, which justifies the use of the methodology of Embrapa.
According to Braga et al. (2017, p. 106), “slope is one of the main variables in the mapping of environmental fragility, because the water erosion processes, associated with other factors, can be accelerated according to the degree of slope of the terrain”. Thus, in order to know the influence of slope on the incidence of local fragility, the slope of the area was generated considering the classification established by Ross and Fierz (2017, p. 58-77).
The local slope map (Figure 4) showed a flat relief in areas of tops and, in some cases, in river valleys, and the gently undulating to undulating relief towards the riverbed. A small stretch of deepening of the river can be seen upstream of the delimited area, with a greater slope, resulting from the presence of basaltic rocks of the Serra Geral Formation identified earlier, forming “steps” of rocks and an area of rapids.
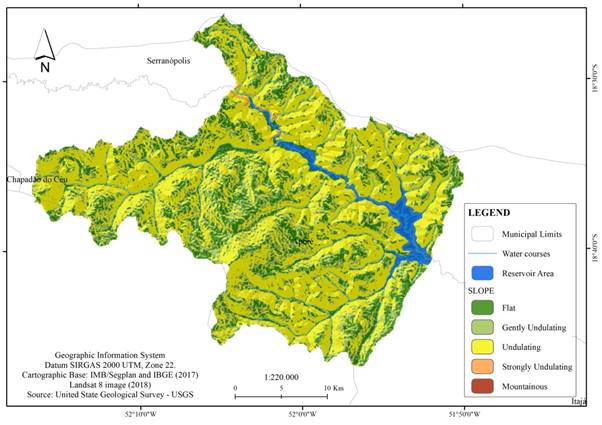
Cuiabano et al. (2017, p. 142) state that the slope present in the field, evaluated together with the type and texture of the soils, and the analysis of land use in the study area can help in the prediction of erosive processes, enabling decision-making that contributes to better use of space. Regarding the extents in the area, the slope was mostly classified as undulating (61.5%) to flat in top areas (28.7%), according to table 2, and may not have a great influence on erosive processes, until it is analyzed together with the other products generated.
Table 2 Result of the percentage of slope classes of the area.
| SLOPE | RELIEF (ROSS AND FIERZ, 2017) | AREA (%) |
| 0 - 2% | Flat | 28.7 |
| 3 - 15% | Gently undulating | 9.2 |
| 16 - 30% | Undulating | 61.5 |
| 31 - 50% | Strongly Undulating | 0.6 |
Organization: Authors (2019)
Undulating reliefs require more conservation practices such as terracing for agricultural crops than flat reliefs, where surface runoff is very slow and water erosion is not significant. Although gently undulating areas are very similar, surface runoff is slow, but may indicate greater fragility in sandy soils with long slope (Klein, C.; Klein, 2015, p. 87). It can be noted that each class of slope has characteristics that can affect the final levels of fragility, as they influence the flow of surface waters and have different forms of use and occupation.
3.4 Pedology
From the generation of the pedological map, it was possible to notice that much of the basin is located in areas covered by Latossolos (Oxisols), which, according to Santos et al. (2018, p. 84), have both clayey texture and medium to sandy texture. Still, this area has a predominance of sandy soils and some Neossolos Litólicos (Entisols) were identified, which, according to the methodology, can classify the area into a higher level of fragility in relation to the types of soils indicated.
According to Cuiabano et al. (2017, p. 143), density, porosity and the capacity of water retention and infiltration in the soil is what determines its vulnerability to erosive processes. Likewise, the intensive and inadequate use of soil can alter density and porosity, influencing physical attributes.
Neossolos Litólicos were identified upstream of the delimited area in the municipality of Serranópolis and Aporé. Soil profiles were opened to confirm the presence, and the following were identified in the basin: Neossolos Litólicos, Latossolos Distroférricos, Latossolos Vermelhos and Latossolos Vermelho-Amarelos (Figure 5). It can be notedthat Latossolos prevail along the basin, showing variation, which can be identified visually by the color, touch and profiles opened. Hydromorphic soils, or Gleissolos (Entisols), present in the lowest areas and wetlands, were also mapped.
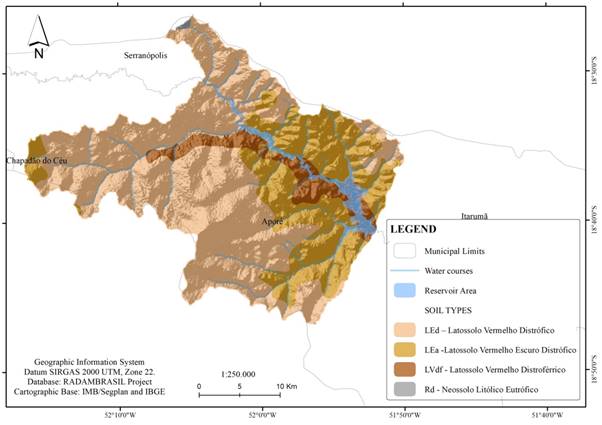
Latossolos can be identified throughout the area and Neossolos Litólicos are easily identified in the field, because they present themselves as decomposing rocks on the surface, described by Santos et al. (2018, p. 96), still to be altered, in this case being present in a flatter area upstream of the reservoir area, before the areas of waterfall and the river deepening stretch, identified in middle course.
3.5 Land use
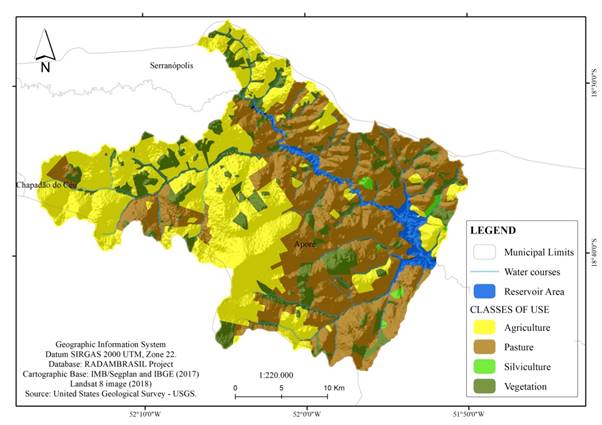
The survey of land uses combined with knowledge of soil characteristics is essential for the proper planning of the territory. Cuiabano et al. (2017, p.551) state that “intensive and inadequate land use and management systems can influence physical attributes of soils, predisposing them to degradation, causing damage to their sustainability”. The land use map reveals the predominance of pasture and agriculture areas, as shown in the table 3.
Table 3 Result of the ercentage of sloe classes of the area.
| CLASSES OF USE | AREA IN THE BASIN (KM²) | AREA IN THE BASIN (%) |
| Pasture | 356.1 | 42.5 |
| Agriculture | 319.4 | 38.1 |
| Vegetation | 130.9 | 15.6 |
| Water mass | 27.7 | 3.3 |
| Silviculture | 4.9 | 0.59 |
Organization: Authors (2019)
Pasture and agriculture (represented by soybean, sugarcane and maize cultivation) and also uses for silviculture predominate among the uses identified in the area of direct influence of Espora HEPP.
We highlight here the impacts of livestock farming, which in addition to the deforestation process, requires areas for animals to drink water, which can also aggravate the siltation of small watercourses that are present in the basin and nourish the main course. In addition, large tracts of sugarcane, soybean and maize crops contribute to the increase in deforestation, increasing soil fragility.
Just as there is a predominance of the use for pastures in the CRB, this delimitation (Figure 6) also identified the same, despite the expansion of agriculture in this region. It can be affirmed that non-conservation land use causes numerous impacts to the environment, involving reduction of biodiversity, soil degradation, siltation of water courses, among others (Dias-Filho, 2014, p.19), so this type of use can show, in the final product, an increase in the degree of emerging fragility, especially in agricultural areas, when combined with undulating slopes.
The areas covered by temporary crops tend to lose more nutrients, especially in sandy soils, as these are leached and can also contribute to the contamination of springs (Donagemma et al., 2016, p. 1009). The occupation of areas that have very sandy to loamy soils due to agricultural activities, for example, can facilitate the infiltration of insecticides, besides requiring more irrigation, given the difficulty in retaining water, or the opposite can occur, compacted soils can facilitate surface runoff and hinder water retention (Albuquerque Filho et al, p. 355-367, 2010).
The limited areas of native vegetation were identified as areas of mandatory preservation, both in gallery forests and riparian forests, the Permanent Protection Areas and Legal Reserve areas. In addition, the absence of these characteristics can cause great influence on the degrees of emerging fragility to be found in the final product of this study.
3.6. Environmental Fragility
Based on the results found, the empirical analysis of environmental fragility in the study area was performed using collected and analyzed data of climate, slope, soil and land use. The values of the variables of these results were established according to the methodology of environmental fragility proposed by Ross (1994, p. 63-73) and reformulated by Ross and Fierz (2017, p. 58-77).
The characteristics identified do not establish high levels of potential fragility, which is the result of the climate + slope + pedology correlation, since climate was characterized as of medium fragility throughout the area, and the slope, from flat to wavy, together with the predominance of sandy soils, also helped in these characteristics. Therefore, the map showed a results of 46.8% for low and 49.5% for medium (Figure 7), due to these factors.
Massa and Ross (2012, p. 76) state that “the little dissected relief is in fact more stable, given that fragility is also conditioned by other factors such as soil, land use and occupation and rainfall characteristics”.
Thus, this fragility mapping showed that the low to high potential fragility (Figure 7) is the result of soil texture, predominantly sandy throughout the area. As stated by Cuiabano (2017, p. 142), clay and organic matter are the main elements that contribute to soil aggregation, and slope is identified as gently undulating to undulating, justifying medium influence on the erosion percentage, along with the low fragility of the climatic classification of the area.
The map of emerging fragility brought the interpolation of potential fragility data along with the type of land use and occupation in the area under analysis. In this case, with greater weight, the use for agriculture, which occupies 38% of the area, intensified the increase of fragility (Figure 7) as it mainly had characteristics of temporary crops and under intensive use, adding 17% in area of high fragility.
On the other hand, the presence of vegetation cover generated an increase in areas with very low fragility, shown in Table 4. Donagemma et al. (2016, p. 1010) state that vegetation maintains balance in soils, mainly sandy ones, as it provides greater water retention capacity and stability through its roots, as well as cover.
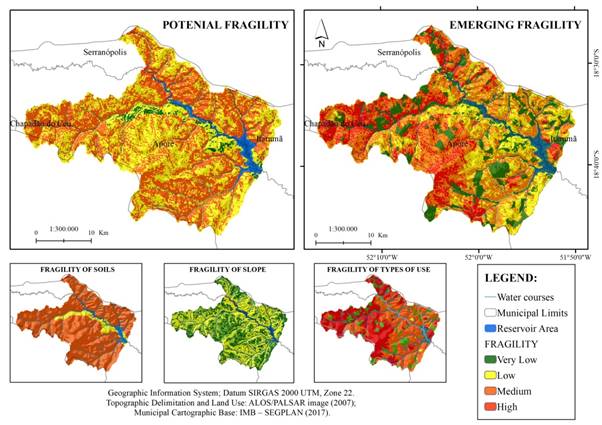
Table 4 Areas with the levels of Potential Environmental Fragility and Emerging Fragility.
| POTENTIAL FRAG. | AREA (%) | EMERGING FRAG. | AREA (%) |
| Very Low | 3.1% | Very Low | 20.1% |
| Low | 46.8% | Low | 19.9% |
| Medium | 49.5% | Medium | 42.4% |
| High | 0.6% | High | 17.6% |
Organization: Authors (2020).
The areas identified with low and medium emerging fragility mostly covered the use of pastures because, as previously mentioned, this type of use, in general, has lower fragility than agriculture, but is not exempt from soil erosive processes. Despite the large extent and the impacts of degradation on water courses, pastures end up controlling erosive processes, providing organic matter due to grass roots, which also decrease infiltration rate, contributing to some moisture retention in these soils (Dias-Filho et al. 2014, 36p).
Of the areas classified as of medium level of emerging fragility, 42.4% are under agriculture and pastures related to soil type and slope, showing that these deserve more attention regarding the type of management. According to Centeno et al. (2018, p. 34), soil texture defines the levels of water infiltration and absorption because, in general, sandy soils have a greater capacity for infiltration of rainwater, which carries nutrients, agricultural correctives and agrochemicals.
It should be remembered that the substitution of vegetation cover by pastures and agriculture areas, as well as the pressure of these uses on rivers and springs, favors the increase of environmental instability, especially with the absence of conservation practices. Thus, it is advisable to have a plan for controlling land use, especially in areas classified as of medium emerging fragility, which can be destined for both livestock activities and agriculture, provided that appropriate soil protection managements and techniques are applied.
4. Final considerations
In this study the natural physical factors of the area characterize medium potential fragility, mainly due to the type of soil. In addition, the type of land use leads to increase of emerging fragility, considering that the lower potential fragility of the area is directly related to the low slope and the pedological characteristics found, where the sandy texture of Latossolos prevented classification as very low potential fragility, but also did not result in high level of fragility, due to the slope characteristics of the terrain.
This study allows us to state that the integrated analysis of natural and anthropogenic variables allows us to make a reading of the degree of environmental fragility of the environments, whether for adequate planning or for predicting risks. In areas that support large projects, these environments must have continuous monitoring, considering that the change in space, in its various types of uses, is constant. As seen, the studied area is located in the Cerrado area, a central region of Brazil, characterized by mild slopes. Nevertheless, its fragility was shown to be aggravated by the type of use and occupation implemented in recent years.
Although the area showed a medium potential environmental fragility caused by erosive processes due to slope, special attention is needed regarding the concentrated flow of rainwater both in pasture areas and in crop areas, particularly along roads and service paths on farms. In this case, it is essential to use contour lines and temporary retention boxes alongside these roads, especially in agricultural areas.
The highlighted area of influence of the Espora HEPP is suitable to receive the installation of enterprises, such as the HEPP installed, but requires the application of legislation regarding the permanence of riparian forests and vegetation, in order to contain the siltation process in the reservoir and in the tributaries present.
The methodology of environmental fragility proposed by Ross (1994, 63-73) stands out for adapting to the various types of environments and purposes, enabling analysis at various scales. The identification of stable and unstable areas also enables a reading of the existing limitations and potentialities, essential for the planning of the space, which aims at the creation of proposals that point to reduction of impacts and better use of the environment.
The diagnoses of hydrographic basins and areas of influence of large projects, based on environmental mapping, are considered the technical-scientific supports for the development of strategic planning and government management, especially in aiding environmental zoning. Thus, these and other discussions around the planning of the territory must add specific knowledge that is extremely important for the appropriation of the environment to produce a lesser environmental impact.
The discussion presented is expected to provide debates about the importance of Physical Geography studies in analyses that promote a greater man-nature integration and mainly that provide adaptations and basis for other environmental quality studies and for planning and management of the territory.

