


 Inglés (pdf)
 Articulo en XML
 Referencias del artículo
 Enviar articulo por email
 Citado por SciELO
  Similares en
SciELO
Similares en
SciELO 
 Permalink
Introduction
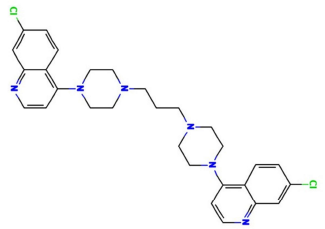
The struggle to combat corrosion effects on materials, especially metals, has come a long way regarding the use of different protective measures, especially environmental modifications 1. Corrosion is an Ec process that occurs at the major corrosion active sites of a material, which predominantly affects anodic areas and some parts of the cathodic ones. It is most likely to occur where moisture, air, electrolytes and possible electron migration from the anodic electrode or sites are present, due to metal dissolution that causes oxidation 1-2. Literature has proven that continued research on the use of organic phytocompounds for corrosion mitigation lies on their readily availability, low cost, and presence of phytoatoms such as N, Sulphur and P. 1,3. Organic CI is based on phytochemicals atoms adsorption onto the surface of a material, usually metal, to form a protective film which displaces water from the metal surface and protects it against deterioration 1-4. S275JR MS is one of the most commonly used grades in general construction. It is an un-alloyed, hot rolled and low C MS 2-3. S275JR is available in a wide choice of profiles and presentations. It is easy to cut, using appropriate grade cutting disks or flame cleaving methods, weld (without need to preheat the metal) machine and drill, which makes it the perfect choice for frames, vehicles, joist supports, lintels, shelves, brackets, construction and maintenance projects. 2-3. To obtain best results, the most appropriate specification of welding rods and electrodes for low C MS must be used. For annealing, the piece must be slowly heat from 650 to 700 ºC, and then gradually cooled, preferably in a furnace 2-3. S275JR is prone to rust. It is important that its surface is treated after fabrication, by using red oxide primer and an appropriate metal paint or spray 2. PPQ (1.3-bis(4-(7-chloroquinolin-4-yl)-4piperazin-1-yl)-propane) is a member of the 4-aminoquinoline antimalarial group, being structurally related to chloroquine, in which the N at position 4 of the PPQ moieties is replaced by a 7-chloroquinolin-4-yl group. PPQ is an N-arylpiperazine, an organochlorine and an aminoquinoline. It is repurposed as a partner drug in artemisinin-based combination therapy, of each tablet contains 320 mg PPQ (as phosphate). PPQ structure is presented in Fig. 1.
In the pursuit for an eco-friendly, readily accessible and inexpensive CI in strong electrolytes, especially those eroding MS in (Na3H(CO3)2), the present study assessed PPQ, for understanding its adsorption mechanism, thermodynamic stability, IE(%), T dependency, Ec relations, etc.
Materials and methods
MS and PPQ preparation
The metal employed in this study was S275JR MS obtained from Ibom Metal and Aluminum Company, Akwa Ibom State, Nigeria, with a composition of Fe (97.43%), C (0.2%), Si (0.05%), Mg (1.6%), S (0.05%), K (0.04%) and Cu (0.27%). It was cut into dimensions of 2.5 x 0.1 x 2.5 cm, for WL and HER experiments, and 1 x 1 cm, for Ec methods. MS physical properties are shown in Table 1.
Table 1 S275JR MS physical properties.
| Physical property | Value |
|---|---|
| Density | 7800 Kg/m³ |
| Mp | 1460 ºC |
| Elasticity mode | 210 GPa |
| Electrical resistance | 0.20-0.25 µΩm |
| Thermal conductivity | 50 W/m°k |
| Thermal expansion | 11 µm/m-k |
The resized MS samples were carefully polished to mirror surface, with 220, 800 and 1200 emery grade paper, using a UNIPOL-820 metallographic polishing machine. Then, they were washed with clean water, using a bristle brush, degreased with ethanol and rinsed in acetone, air dried and stored in an air tight 5YHT desiccator containing CaCl2, prior to use.
10 g PPQ were put in a 1000 mL round bottom flask with 5 M (Na3H(CO3)2), for 48 h, in order to allow for complete dissolution, and then filtered. Various Ct of PPQ (1.0, 2.5, 4.0, 5.5 and 7.0 g/L) were prepared.
Gravimetric experiment
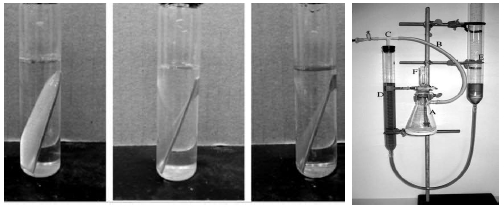
MS samples, which were initially stored in a desiccator, were removed and rinsed in distilled water, and its initial weight was taken using an ADAM PGW 253e electronic digital balance. They were then immersed in different 100 mL beakers containing the prepared inhibitor in 5 M (Na3H(CO3)2), at different Ct (1.0, 2.5, 4.0, 5.5 and 7.0 g/L) (Fig. 2a). The system was closely monitored for 60 min, and the corroded MS samples were removed and washed with clean running water, using a bristle brush, degreased with ethanol and rinsed in acetone, air dried, and then weighed. This process was repeated for another 300 min, at 60 min interval, to allow for variations in MS corrosion reaction. Data generated from WL experiment were used to calculate the CR of MS, and θ and IE(%) of PPQ, using Eqs. 1 and 2.
 ()
()
 ()
()where Ҕr 0 and Ҕr 𝑖 are WL in 1 M (Na3H(CO3)2) with and without inhibitor, respectively.
HER experiment
This experiment was conducted using a gasometric (HER) assembly (Fig. 2b). In a two-necked flask containing 5 M (Na3H(CO3)2), polished MS was immersed while the stopper from the assembly was cocked. Initial HER volume was recorded, while the flask was immersed in a water bath, at a regulated T of 208 K. The readings from the burette for HER volume due to MS corrosion were taken at every 60 s, for 30 min. This process was repeated for each Ct, at different T (208, 308, 318 and 328 K). Data generated from this experiment were extrapolated, and CR was determined. ( and IE(%) of PPQ were determined from Eqs. 3 and 4.
 ()
()
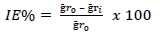 ()
()where ḡ𝑟 0 and ḡr 𝑖 are WL in 1 M (Na3H(CO3)2) with and without PPQ, respectively.
EIS experiment
EIS test was carried out at 208 K, using a Gamry reference 600 potentiostat/galvanostat with a Gamry framework EIS300 system. Echem Analyst software was used for data analyzing and fitting. The frequency range was from 100 kHz to- 0.01 Hz, and an AC signal amplitude of 10 mV was used. Pt electrode, SCE and S275JR MS were used as CE, RE and WE, respectively. Measurements were performed in an aerated solution, after 30 min (1800 s) immersion in the test solution, at ambient T, in order to attain a steady-state OCP. Nyquist plots derived in PPQ absence and presence were used to obtain some useful kinetic parameters, such as Rct. EI(%) was calculated according to Eq. 5 (Ugi and Obeten, 2019).
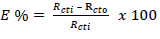 ()
()where R 𝑐𝑡0 and R 𝑐𝑡𝑖 represent Rct without and with PPQ, respectively.
PDP technique
PDP tests were performed at 303 K, using the same instrument as for EIS, and the same data analyzer software. PDP curves were measured at a SR of 0.5 mV/s, from -0.25 to +0.25 V vs. SCE. Linear segments of the anodic and cathodic curves were extrapolated from the plots, which gave useful thermodynamic parameters. Icorr was used to calculate PPQ IE(%), according to Eq. 6.
 ()
()where I°corr represents Icorr obtained without PPQ, respectively (Dagdag et al., 2019).
SEM
SEM, model number JSM-5600 LV, Tokyo, Japan, was used to produce micrographs of MS coupons without and with PPQ in a 1 M HCl solution. The selected coupons were retrieved from the test solution, after 160 h immersion. Each sample was mounted on a metal stub and sputtered with gold. Scanned micrographs were taken at an accelerating V of 1.5 and 12.00 kV. Similar procedure was used by 3.
Result and discussion
Gravimetric analysis results
PPQ IE(%) was assessed through WL procedures. The data obtained through the WL plot of MS in mg, against its IT in the solution with inhibitor, were analyzed, (Table 2). PPQ strength in preventing the of Na3H(CO3)2 ) deposits effect on MS was shown by CR values, which decreased with higher Ct of PPQ. This was due to PPQ strong adsorption onto the MS corrosion active sites 5-9. IE(%) values of PPQ also proved that it was able to drastically reduce anodic dissolution and cathodic HER 5,9-10. Table 2 also shows that ( of PPQ on MS increased with higher Ct. ( explains the exposure area of a material (MS) to an open environment (PPQ). Thus, this trend was to PPQ drastically reduction of MS exposure area to (Na3H(CO3)2), hence inhibiting corrosion 4-5,11.
Table 2 WL results showing CR, ( and IE(%) data.
| System (g/L) | CR (mg/cm2/h) | θ | IE(%) |
|---|---|---|---|
| Blank | 1.099 | - | - |
| 1.0 | 0.115 | 0.896 | 89.5 |
| 2.5 | 0.055 | 0.940 | 94.9 |
| 4.0 | 0.031 | 0.972 | 97.2 |
| 5.5 | 0.016 | 0.985 | 98.5 |
| 7.0 | 0.013 | 0.988 | 98.8 |
Gasometric experiment
Regarding T effect on PPQ action, Table 3 shows gasometric data.
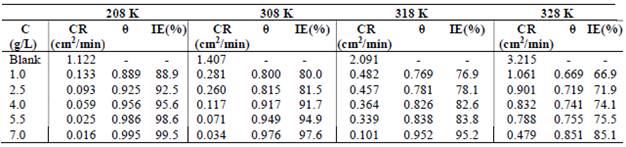
CR results indicate PPQ physical adsorption onto MS, at ambient T (208 K) 10,12-13. The decrease in IE(%) with higher T, and correspondent increase in CR of MS, as seen in Table 3, not only indicate physical adsorption, but also explain the possible losing of weakly bonded PPQ molecules, due to the heat effect 13-15. The desorption process shows that, although PPQ still inhibited MS surface corrosion at higher T, its IE(%) was higher at lower T. This was also due to the inhibitor molecules stronger adsorption onto the MS surface, where CR was minimal 7,10,16.
Ec results (EIS and PDP)
Fig. 3a describes Nyquist plot obtained from EIS technique. It shows larger semicircles of high frequency loops, with an increase in PPQ Ct.
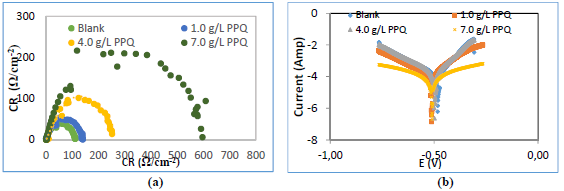
Figure 3 Graphical representation of: (a) Nyquist, (b) circuit and (c) Tafel plots, for Ec determination.
This implies that (Na3H(CO3)2) effect on MS was overcome by PPQ strong adsorption onto the metal corrosion active sites 15-17. IE (%) data were determined by Eq. 7.
 ()
()where r ct 0 and r ct i correspond to Rct values in (Na3H(CO3)2) with and without PPQ, respectively.
Rct increased with higher Ct of PPQ (Table 4). More often than not, Rct describes the resistance against the process of electrons transfer from one phase to another. From this result, it was confirmed that electrons transfer from MS anodic sites was retarded by PPQ molecules adsorption onto the metal surface, thus decreasing CR and increasing IE(%) 9,17.
Table 4 Values of Ec result from EIS and PDP data.
| C (g/L) | Rct (Ω/cm-2) | Cdl (µF/cm-2) | IER (%) | Icorr (µA/cm-2) | βa (mV/dec) | βc (mV/dec) | IEPDP(%) |
|---|---|---|---|---|---|---|---|
| Blank | 104 | 1.2 x 10⁻⁵ | - | 2.913 | 633 | 711 | - |
| 1.0 | 152 | 1.9 x 10⁻⁶ | 31.6 | 1.046 | 362 | 682 | 64.1 |
| 4.0 | 294 | 1.1 x 10⁻⁶ | 64.6 | 0.872 | 173 | 552 | 70.1 |
| 7.0 | 609 | 0.9 x 10⁻⁶ | 82.9 | 0.118 | 98 | 319 | 95.9 |
The tendency to store charges by an electrode during an Ec process like corrosion was also considered. Obtained values show a decrease in Cdl, which indicates that PPQ separated the electronic and electrolytic charges at the MS-solution interface. This, in turn, reduced the tendency to store charges, hence enabling CI 18-20.
Fig. 3b reveals Tafel plots for PDP analysis. The plots show divergence towards anode and cathode sites, which implies that PPQ had a mixed type behavior, just as for βa and βc values (Table 4) 18,20. However, values obtained in Table 4 show that icorr values decreased, while IE(%) increased. This implies that the current produced in the Ec cell decreased while corrosion was occurring 8,12,21, due to PPQ molecules strong adsorption onto the anodic sites, which halted electrons transfer from the anode to the cathode, as Ct increased 12.
Quantum chemical calculations
In order to confirm the chemical data and inferences, Ec analyses were conducted. The following parameters were calculated (Eqs. 8 to 12), using the output generated from EHOMO, ELUMO, IP, EA, χ, η, σ, ω and δ, according to 2 and 22.
 ()
()
 ()
()
 ()
()
 ()
()
 ()
()The computational information showing optimized structures, HOMO, LUMO, ω, δ and radial functions for PPQ, is shown in Fig. 4, and the corresponding calculated data are shown in Table 5.
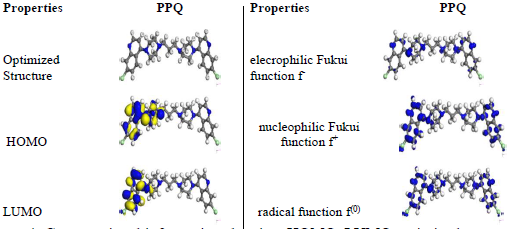
Figure 4 Computational information showing, HOMO, LUMO optimized structures, ω, δ and radial functions for PPQ molecule.
Table 5 Quantum chemical parameters for PPQ.
| Inhibitor | EHOMO | ELUMO | ΔE (eV) | IP (eV) | EA (eV) | χ (eV) | ( (eV) | ( (eV) | ω (eV) | δ (eV) |
| PPQ | -3.104 | -2.997 | 0.107 | 4.110 | 3.287 | 3.698 | 0.412 | 2.427 | 16.596 | 0.060 |
(E value was recorded as 0. 107 (Table 5), indicating a very close molecular interaction between the various energy levels 25-28. (E is the minimum energy required to excite an electron, which is stuck in its bound state, into a free state, where it can participate in a reaction 21-23. By this definition, (E obtained from this experiment shows that PPQ molecules were likely to easily be excited into a free state on the MS surface, hence leading to faster and stronger adsorption and IE(%) 19,24,27. This result was supported by EHOMO higher value (-3.104) than EHOMO (-2.997).
Fig. 4 shows that PPQ is symmetrical. HOMO electron density distribution was deeply located on the double bonds of the aromatic benzene ring and N heteroatoms. LUMO was located on the individual C atoms of the aromatic ring, heteroatoms and Cl atom present as a substituent. PPQ high IE(%) is linked to the donating power of the π-electrons and heteroatoms present in the aromatic ring 28-32. PPQ had a higher absolute molecular σ and ( of 2.4 and 0.4, respectively, which makes it a better CI for MS in (Na3H(CO3)2) heavy deposits 33-35.
Thermodynamics consideration
To access the inhibitor strength in increasing the energy barrier required to be overcome for the corrosion reaction between (Na3H(CO3)2) and MS to occur, Arrhenius Eq. (its plots are shown in Fig. 5) was adopted 16,21.
 ()
()where r is rate and A is collision factor, while other constants remain the same, as conventionally known.
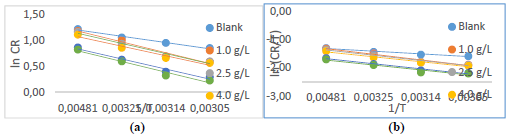
Figure 5 Plots of: (a) Arrhenius and (b) Eyring for PPQ IE(%) of MS corrosion in (Na3H(CO3)2) deposits.
From Table 6, Ea values in the solution with PPQ were higher than of those without it, and increased with higher Ct, implying that there was a CR slowdown, due to PPQ adsorption, and a likely physical adsorption 22-24,29. The transition state Eq. for ΔH and ΔSads determination is 13,19,30:
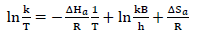 ()
()where k is reaction rate, kB is the Boltzman constant and h is the plank constant. Table 6 presents negative entropy values, implying an increased inhibition, due to PPQ stronger adsorption onto MS, which resulted from the significant degree of orderliness 31-33. ΔHads values that are positive and lower than 80 Kj/mol-1 represent a physical adsorption mechanism and an endothermic reaction, indicating bond breaking around corrosion forming sites 5,17,34. ΔGads values in Table 6 were negative and lower than -20 kJmol-1, implying physical adsorption, spontaneity of reaction and high PPQ stability 22,33-35. These results showed strong agreement with gravimetric analysis.
Table 6 Thermodynamic data on PPQ adsorption onto MS in (Na3H(CO3)2) deposits.
| Inhibitor C (g/L) | Ea (kJ/mol) | ∆Hads (kJ/mol) | (R2) | ∆Sads (kJ/mol) |
|---|---|---|---|---|
| Blank | 1.01 | 78.8 | 0.9689 | -951.5 |
| 1.0 | 1.74 | 164.6 | 0.9665 | -943.6 |
| 2.5 | 1.63 | 153.8 | 0.9813 | -948.4 |
| 4.0 | 1.53 | 143.9 | 0.9752 | -974.5 |
| 5.5 | 1.62 | 145.6 | 0.9358 | -978.1 |
| 7.0 | 1.23 | 149.9 | 0.9981 | -984.8 |
Adsorption consideration
Langmuir’s adsorption isotherm was used to test PPQ, to determine its inhibition mechanism. This process was accomplished through Langmuir’s plots of Ct/( vs. Ct (g/L) (Fig. 6), using Eq. 10 6,18,34.
 ()
()Table 7 shows the data obtained from the plots in Fig. 6.
Table 7 Langmuir’s isotherm data for PPQ adsorption onto MS in (Na3H(CO3)2) deposits.
| T (K) | k (mg/L) | (R2) | ∆G*ads (kJ/mol) |
|---|---|---|---|
| 208 | 4.845 | 0.99 | - 9.67 |
| 308 | 2.258 | 0.99 | - 12.37 |
| 318 | 1.904 | 0.98 | - 12.32 |
| 328 | 1.599 | 0.98 | - 12.23 |
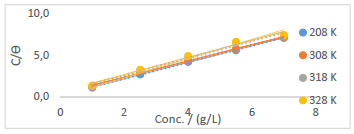
Figure 6 Langmuir’s adsorption isotherm plot for PPQ inhibition of S275JR MS corrosion in (Na3H(CO3)2) deposits.
It was observed that k values in the inhibited solution decreased with increased T. This phenomenon is always suggestive of a physical adsorption mechanism, as it was confirmed from the T dependent result (gasometric analysis) 30,34. This result also indicates that there was room for a speedy migration of the molecules in the solution, which enabled a strong bond formation between PPQ and MS, hence obeying Langmuir’s assumption of monolayer adsorption 14,19. ΔGads values were negative, and lower than -20 Kj/mol-1, which defines a physical adsorption phenomenon, spontaneity to the forward direction and increased inhibitor stability 35.
SEM analysis
To investigate PPQ nature of adsorption onto MS, SEM was deployed 34-35, through the study of topographic, morphological and compositional information. Fig. 5 shows MS micrographs in blank, 1.0 and 7.0 g/L (Na3H(CO3)2. The micrograph in Fig. 7a shows a very rough surface area, which depicts the aggressive attack by the (Na3H(CO3)2) solution on MS, due to PPQ absence 35. This was due to the corrosion sites activation triggered (Na3H(CO3)2), which caused MS anodic dissolution and possible cathodic HER (30-31). However, PPQ lowest Ct gave the micrograph seen in Fig. 7b, which shows a possible decrease in the Ra of MS. A further increase in the Ct of PPQ (Fig 7c) caused complete MS smoothness. This could be due to the large θ by PPQ of the MS surface, which protected anodic corrosive active sites that could have been open for electrons transfer into (Na3H(CO3)2), leading to corrosion 30,35. These micrographs show that PPQ is a good inhibitor of MS corrosion in (Na3H(CO3)2).

Conclusion
PPQ as alternative inhibitor showed effective corrosion mitigation of S275JR MS in heavy deposits. IE(%) of 98.8, 99.5, 82.9 and 95.9% were obtained by gravimetric, HER, EIS and PDP, respectively, which makes PPQ a better inhibitor for corrosion deactivation. It had a shortest (E of 0.1 Ev, with a molecular σ and η of 2.4 and 0.4, respectively, which makes it a better inhibitor of MS corrosion in (Na3H(CO3)2) heavy deposits. PPQ was thermodynamically stable, and had low disorderliness. Its adsorption onto the MS surface was physical and spontaneous. These are qualities that come with a good and reliable inhibitor.
Authors’ contributions
B. U. Ugi: designed the research work; carried out data analysis and interpretation; supervised all the work. V. M. Bassey: was involved in materials and samples collection and preparation; did the experimental work. P. B. Ashishie: was involved in materials and samples collection and preparation. N. D. Obi: did experimental work. F. B. Ugi: carried out data analysis and interpretation. All authors read and review the manuscript.
Abbreviations
AC: alternating current
CaCl2: anhydrous calcium chloride
Cdl: double layer capacitance
CE: counter electrode
CI: corrosion inhibitor/inhibition
CR: corrosion rate
Ct: concentration
Ea: activation energy
EA: electron affinity
Ec: electrochemical
Ecorr: corrosion potential
EHOMO: energy of the highest occupied molecular orbital
EIS: electrochemical impedance spectroscopy
ELUMO: energy of the lowest unoccupied molecular orbital
icorr: corrosion current density
IE(%): inhibition efficiency
IP: ionization potential
IT: immersion time
k: equilibrium constant values
Mp: melting point
(Na3H(CO3)2): sodium sesquicarbonate
OCP: open circuit potential
PDP: potentiodyamic polarization
PPQ: piperaquine
R2: correlation coefficient
Ra: surface roughness
Rct: charge transfer resistance
RE: reference electrode
S275JR MS: mild steel
RE: reference electrode
SCE: saturated calomel electrode
SR: scan rate
T: temperature
WE: working electrode
WL: weight loss
Symbols definition
(a: anodic slope
(c: cathodic slope
ΔE: energy gap
ΔGads: adsorption free energy
ΔH: heat of adsorption
ΔHads: enthalpy of adsorption
ΔSads: entropy of adsorption
η: absolute hardness
σ: absolute softness
δ: neucleophilicity
(: surface coverage
ω: electrophilicity index
χ: absolute electronegativity

