


 Inglês (pdf)
 Artigo em XML
 Referências do artigo
 Enviar este artigo por email
 Citado por SciELO
  Similares em
SciELO
Similares em
SciELO 
 Permalink
INTRODUCTION
Cashew (Anacardium occidentale L.) is among the most important cash crops in tropical countries, where is a major revenue at both governmental and smallholder farmers levels. Native from Brazil, cashew has expanded into tropical countries from Africa and Asia, due to its high value agriculture product, the cashew nut (Salam and Peter, 2010). In East-Timor, nowadays, cashew has been implemented as an alternative cash crop to coffee, by the rural community (Timor-Leste Ministry of Agriculture and Fisheries, 2012). Cashew was introduced in East Timor by the Portuguese in 18th century and was planted in several district as ornamental plant for daily consumption (reported). Cashew has been growing in arid and semiarid regions with temperatures from 17ºC to 23ºC and good adaptation to the varied dry climate.
The aim of this work was to analyse the soils cultivated with cashew and verify whether there has been any change in their characteristics as a result of this plantation.
MATERIAL AND METHODS
Extensive field surveys on cashew orchards were conducted in seven districts in East-Timor and in Kefamenanu - Indonesia (2018-2020) to perform a global characterization under this agroforestry system. Cashew orchards were selected at four sites to study their soils: Sanirin and Maumali in Maliana Municipality, and Cribas and Natarbora in Manatuto Municipality (Figure 1).
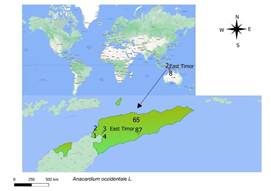
Figure 1 Cashew soil sites map location of Sanirin (1,2) Maumali (3,4), Cribas (5,6) and Natarbora (7,8), in East-Timor.
According to East-Timor Soil Map (Garcia & Cardoso, 1978), the Sanirin site is located in one area characterized by soils of medium texture from the Soil Association A (sub-unit Am), composed mainly by Fluvisols (Fluvissolos êutricos) and Kastanozems (Castanozems fluviáplicos e fluvicálcicos), and also with Dystric Fluvisols and Cambisols as subdominant units, usually developed from modern alluvial deposits; at Maumali site, we have the Association of Soils Atc, composed of Fluvisols (Fluvissolos calcários) and Kastanozems (Castanozems fluvicálcicos) developed from ancient alluvial deposits; at Cribas site the Association of soils was the At, with Eutric and Dystric Fluvisols, Kastanozems (fluviáplicos and fluvicálcicos), and Cambisols (Cambissolos fluvihúmicos) developed also from ancient alluvial deposits. Finally, the soils at Natarbora site were from the complex TCMC, composed by the Soil Associations Atc (60%) and CMC (40%) being the last one mainly integrated by of Cambisols (Cambissolos vérticos calcários), Regosols (calcários) and Rendzinas.
In each site, soil samples were collected under the cashew canopy (UC) and outside the canopy influence (OP) to assess soil dynamics and evaluate physical and nutrient variability.
The pH was measured by the electrometric method; organic C was determined by the wet digestion method (De Leenheer & Van Hove, 1958); the total N by the Kjeldahl method (Bremner & Mulvaney, 1982); cation exchange capacity (CEC) and exchangeable base cations (Ca2+, Mg2+, K+ and Na+) by atomic absorption spectrophotometry (AAS) after extraction with ammonium acetate at pH 7.0; and Egner-Riehm extractable P and K were measured by colorimetry (Watanabe & Olsen, 1965) and by AAS.
RESULTS AND DISCUSSION
Comparing the results of soil analysis of samples collected under the canopy (UC) and at open space (OP) from the four sites, we found a significant difference on the amount of organic C and extractable K at the surface horizon, with much higher amounts of those elements in the area of influence of the trees. In fact, the average of organic C was 2.61% in the plots UC and 1.06% in the OP, while the average of extractable K was 623.32 mg kg-1 UC and 89.05 mg kg-1 in the OP (Table 1). This pattern is probably related with the effect of litterfall deposition, and of throughfall and stemflow waters coming from the trees, as have been already reported for other species in Portugal (Cortez & Madeira, 1998; Cortez et al., 2004; Nunes, 2004).
Table 1 Mean values ± standard error (n=4) of pH, organic C, total N and extractable P and K of the soils under canopy (UC) and at open space (OP) of Anacardium occidentale plantations at 0-10, 20-30, 40-50, and 60-70 cm deep
| pH | Org. C | Total N | Extr. P | Extr. K | ||
| H2O | KCl | (%) | (g kg-1) | (mg kg-1) | ||
| 0-10 cm | ||||||
| UC | 6.10 ± 0.29 | 5.21 ± 0.45 | 2.61 ± 0.75 * | 2.13 ± 0.89 | 225.69 ± 214.76 | 623.32 ± 400.79 * |
| OP | 6.31 ± 0.37 | 4.65 ± 0.19 | 1.06 ± 0.20 * | 0.85 ± 0.14 | 20.52 ± 9.30 | 89.05 ± 22.93 * |
| 20-30 cm | ||||||
| UC | 6.17 ± 0.34 | 4.36 ± 0.34 | 0.69 ± 0.07 | 0.63 ± 0.04 | 15.36 ± 8.58 | 131.27 ± 23.65 |
| OP | 6.35 ± 0.43 | 4.63 ± 0.26 | 0.65 ± 0.08 | 0.66 ± 0.08 | 11.80 ± 6.77 | 80.46 ± 20.60 |
| 40-50 cm | ||||||
| UC | 6.19 ± 0.33 | 4.53 ± 0.26 | 0.53 ± 0.05 | 0.57 ± 0.09 | 14.05 ± 7.74 | 111.86 ± 28.82 |
| OP | 6.36 ± 0.43 | 4.56 ± 0.23 | 0.45 ± 0.09 | 0.59 ± 0.10 | 12.77 ± 7.24 | 72.63 ± 9.83 |
| 60-70 cm | ||||||
| UC | 6.15 ± 0.39 | 4.47 ± 0.28 | 0.48 ± 0.06 | 0.47 ± 0.10 | 17.36 ± 9.93 | 70.41 ± 22.15 |
| OP | 6.38 ± 0.39 | 4.70 ± 0.30 | 0.52 ± 0.10 | 0.47 ± 0.10 | 17.39 ± 10.30 | 61.66 ± 20.95 |
* in the same column indicate significant differences (P < 0.05) estimated by the Mann-Whitney-Wilcoxon Test.
The same patterns were found for extractable P, total N, CEC and exchangeable Ca2+, Mg2+ and K+, however without statistical significance. The average values under canopy and in the open space were, respectively, 225.69 and 20.52 mg kg-1 for extractable P, 2.13 and 0.85 g kg-1 for total N (Table 1), 22.38 and 10.22 cmolc kg-1 for CEC, 16.09 and 12.50 cmolc kg-1 for exchangeable Ca2+, 3.46 and 3.09 cmolc kg-1 for exchangeable Mg2+, and 1.40 and 0.50 for exchangeable K+ (Table 2).
When we look further, for the second horizon of those soils, at 20 to 30 cm deep, those differences on soil characteristics almost disappear. We only find the same pattern of larger amounts under canopy than in open space for the extractable K (respectively 131.27 and 80.46 mg kg-1), the extractable P (15.36 and 11.80 mg kg-1), and also for the exchangeable K (1.40 and 0.50 cmolc kg-1), thus, the effect of the trees on the characteristics of the soils seems to be present only in the upper part of the soil profile (Tables1 and 2).
Table 2 Mean values ± standard error (n=4) of exchangeable Ca2+, Mg2+, Na+ and K+, total cations (SB) and cation exchange capacity (CEC) of the soils under canopy (UC) and at open space (OP) of Anacardium occidentale plantations at 0-10, 20-30, 40-50, and 60-70 cm deep
| Ca | Mg | Na | K | SB | CEC | |
| cmol c kg-1 | ||||||
| 0-10 cm | ||||||
| UC | 16.09 ± 8.57 | 3.46 ± 0.80 | 1.47 ± 0.03 | 1.40 ± 0.84 | 22.41 ± 10.23 | 22.38 ± 6.01 |
| OP | 12.50 ± 7.00 | 3.09 ± 1.09 | 1.81 ± 0.14 | 0.50 ± 0.14 | 17.89 ± 8.18 | 10.22 ± 5.84 |
| 20-30 cm | ||||||
| UC | 8.66 ± 4.55 | 2.71 ± 0.95 | 1.52 ± 0.09 | 0.38 ± 0.09 | 13.26 ± 5.37 | 11.70 ± 2.61 |
| OP | 9.73 ± 5.37 | 2.77 ± 1.04 | 1.43 ± 0.04 | 0.15 ± 0.09 | 14.07 ± 6.42 | 13.89 ± 2.88 |
| 40-50 cm | ||||||
| UC | 7.68 ± 3.24 | 2.99 ± 0.93 | 1.51 ± 0.03 | 0.16 ± 0.07 | 12.34 ± 4.16 | 10.63 ± 1.90 |
| OP | 8.51 ± 4.34 | 3.33 ± 1.67 | 1.60 ± 0.06 | 0.22 ± 0.07 | 13.66 ± 5.99 | 11.08 ± 2.74 |
| 60-70 cm | ||||||
| UC | 6.70 ± 2.65 | 3.29 ± 1.45 | 1.76 ± 0.13 | 0.38 ± 0.11 | 12.13 ± 4.33 | 10.46 ± 2.51 |
| OP | 7.07 ± 2.94 | 2.96 ± 1.07 | 1.62 ± 0.13 | 0.33 ± 0.11 | 11.97 ± 4.22 | 9.18 ± 2.62 |
* in the same column indicate significant differences (P < 0.05) estimated by the Mann-Whitney-Wilcoxon Test.
Furthermore, the accumulation of organic C, extractable K and P, total N, and exchangeable K+ is much more evident in Sanirin site, where those parameters reached values of 4.83% for the C, 1817.27 mg kg-1 for extractable K, 869.85 mg kg-1 for extractable P, 4.73 g kg-1 for the total N and 3.91 cmolc kg-1 for the exchangeable K+, than in the other sites. In fact, it was reported before that the dynamics of nutrients and pH of the soil depend on the amount of elements coming from rainfall, stemflow and throughfall, leading to variations in soil with distance from the tree trunk, as a result from the different amount of nutrients incorporated in the soil as well as the different annual deposition flows (Cortez & Madeira, 1998; Cortez et al.; 2004; Nunes, 2004).
On the contrary, those differences between soils under canopy and in open space are much less evident in Maumali site, where we have more clayey soils, with amounts of organic C of 1.69% under canopy and 1.50% in open space, and exchangeable K+ of 0.63 cmolc kg-1 UC and 0.60 cmolc kg-1 in OP. But also in Cribas site, in a sandy loam soil, the total N was 1.13 g kg-1 under canopy and 0.96 mg kg-1 in open space, and the amount of extractable P was a little higher in open space than under canopy.
The understory vegetation does not seem to be influenced by the trees, as the same species can be found both under canopy and at open space, like, for example, some herbaceous varieties as Eleusine indica, Sida acuta, and Elephantopus scaber.
In addition, it was not possible to relate cashew productivity to soil characteristics in the different locations, as the quantities of cashew produced were heavily influenced by the existence of many pests and diseases, due to the lack of phytosanitary management.
CONCLUSIONS
Overall, our results show few differences inside and outside cashew canopy thus highlighting that cashew does not limit soil nutrients. More future studies to analyse the effect of canopy coverage on differences in soil properties under and outside canopies are needed to assess the effect of the cashew land-use and determine the beneficial effect of agroforestry of this cropping system

