


 Inglês (pdf)
 Artigo em XML
 Referências do artigo
 Enviar este artigo por email
 Citado por SciELO
  Similares em
SciELO
Similares em
SciELO 
 Permalink
Introduction
HDH is hydroxyzine hydrochloride salt, with the international union of pure and applied chemistry (IUPAC) name 2-[2-[4-[(4-chlorophenyl)-phenylmethyl]piperazin-1-yl]ethoxy]ethanol;dihydrochloride, shown in Fig. 1.
HDH is a common medicament, a first generation drugs of antihistamines (H1 receptor antagonist). HDH H1 receptor antagonism is widely used in the treatment of pruritus, chronic and cholinergic urticaria and dermatoses. It has mild gastric secretion blockade, antibradykinin, anticholinergic, antiserotonergic, sedative, anxiolytic and anti-emetic properties 1)-(4. The prescribed usage of HDH as a medicament does not have serious contra-indications. However, the geriatric patients are liable to suffer from secondary effects, such as sedation, cognitive impairment, confusion, blurred vision and urinary retention. A daily dosage of 50 to 100 mg is advisable for the treatment of tension and anxiety. An overdose of HDH or its combination with other sedatives, alcohols or lithium may be associated with hallucinations 5), (6.
The ability to design, construct and run an electroanalytical method that is more specific, sensitive and robust is crucial for drugs assay or quantification. Electroanalytical techniques are quite popular, not only to study chemical and biological species electrical behaviour, but also for quantitation purposes. To mention a few, it were used, for the detection of: resorcinol, a carbon nanotube paste electrode (CNTPE) modified with a graphite mixture 7; dopamine, a CNTPE modified with poly basic blue B 8, a CPE modified with poly nicotinic acid 9 and poly phthalo blue 10; indigo carmine, in food and water samples, a poly (glutamic acid) layered multi-walled (M-W) CNTPE 11; tartrazine, a CPE modified with a polymer 12; formoterol fumarate, a layered M-WCNTPE modified with poly(thiazole yellow-G) 13; ciprofloxacin and estriol, an anionic surfactant (AS) and a CPE modified with a polymer 14; riboflavin, AS, a polymer-modified electrode 14 and a C sensor modified with poly (DL-phenylalanine) 15; curcumin, a CNT electrochemical sensor modified with a polymer 16; and vanillin, in food samples, a poly(glutamic acid) functionalized M-WCNT and a graphite composite paste sensor 17.
Despite the electroanalytical techniques vast employability for the quantification of compounds of therapeutic interest, they are not widely used. By keeping features such as ease of performance, cost-effectiveness, and non-requirement of highly skilful operators, potentiometry with selective electroanalytical potentiometric sensors is highly useful for assaying therapeutic compounds such as HDH.
The extensive literature survey on the analytical methods reported for HDH quantification in pharmaceuticals revealed that there is a monography in United States Pharmacopoeia (USP) that adopted a high-performance liquid chromatography (HPLC) procedure, with uv-detection at 232 nm 18)-(23. The other methods used different analytical techniques, such as gas 24, thin layer 25 and micellar liquid (26) chromatography, capillary zone electrophoresis 27, voltammetry 28, LC-MS (mass spectrometry) 29, potentiometry 30), (31, gravimetry 32, visible spectrophotometry 33)-(38 and titrimetry 33), (39)-(42. The method reported by Sanrick and Janik 42 employed HDH precipitation with sodium tetraphenyl borate, and filtration and dissolution of the precipitate in acetone, followed by potentiometric titration with silver nitrate (AgNO3). The chromatographic, electrophoretic and voltammetry procedures for HDH detection are not simple and easy to apply. Despite of their high sensitivity, they are not cost effective, and need an operator with high skills. On the other end, methods such as titrimetry and gravimetry require precipitation, filtration and titration of the residual precipitant. The required steps are complex, tedious and time-consuming. The spectrophotometric procedures involve the use of organic reagents, stringent experimental conditions and tedious extraction procedures.
In contrast to the limitations of the reported methods, this study presents a simple, novel and reliable potentiometric procedure for HDH determination, using the ion-pair complex of HDH and Orange II (ORG II) in a PVC matrix. A simple electronic device, and non-toxic, low cost and common standards and reagents were used in the development of this method, which has been optimized and validated. The procedure has showed good applicability to determine HDH in pharmaceuticals.
Experiment
Apparatus
A digital dual channel potentiometer (PICO Chennai-32, India) and an Elico (Mumbai, India) pH-meter were used in the potential and pH recordings. Ag/AgCl and Al wire were used as WE and CE, respectively, to build an electrochemical cell for potential measurements.
Reagents and solutions
All chemicals used were of analytical reagent grade. Spectroscopic grade chloroform was used. Distilled water was used throughout the investigation.
A 2 M sulphuric acid (H2SO4) solution was prepared with concentrated H2SO4 (S. D. Fine Chem., Mumbai, India, sp. gr. 1.84). 2 M sodium hydroxide (NaOH) was prepared in water. For the 0.1% (w/v) Orange II (ORG II) solution preparation, 500 mg of the dye (S. D. Fine Chem., Mumbai, India) were warmed with 200 mL water. Then, the solution was filtered through a Whatman No. 42 filter paper, and diluted to 500 mL with water. Tetrahydrofuran (THF), polyvinylchloride (PVC), dibutyl phthalate (DBP), dioctyl sebacate (DOS) and nitrophenyl octyl ether (NPOE) were purchased from S. D. Fine Chem.
Aqueous solutions of NaOH, potassium hydroxide, sodium carbonate, monopotassium phosphate, sodium acetate, sodium bicarbonate, acetic acid, potassium chloride, AgNO3, potassium nitrate, phosphoric acid, sodium nitrite, cobalt chloride, cadmium chloride, glucose, sucrose, oxalic acid, glycine, arginine, talc and urea (S. D. Fine Chem.) were prepared in bi-distilled water, by maintaining the required strength of 1 M each.
Standard drug solution
The pure Pharmaceutical grade HDH was offered by UCB Pharma Ltd, Mumbai, India. A standard 5.0 mmol/L-1 HDH stock solution was prepared in water, and used for experimentation.
General procedures
Preparation of HDH-ORG II ion-associate
10 mg of HDH were dissolved in 25 mL water, and 19 mg of ORG-II were added to the mixture. The contents were transferred to a clean separating funnel, and acidified with 1 mL of 2 M H2SO4, followed by the addition of 10 mL of chloroform (CHCl3). The contents were shaken rigorously for 60 s, and the layers were allowed for equilibration. The organic layer was passed through anhydrous sodium sulphate, and put into a dry 100 mL beaker. The procedure was repeated twice with fresh 10 mL CHCl3. The combined extract was kept on a water bath, to evaporate the solvent, and the resultant solid HDH-ORG II ion-pair complex was collected.
Designing of the HDH-ORG II sensor
10.0 mg HDH-ORG II ion pair complex, 0.16 g PVC and 0.1 g DBP were dissolved in 10 mL THF. The solution was transferred to a 4 cm wider Petri Dish, and dried under laboratory temperature, for 24 h. The thin membrane obtained with 3.7% (w/w) HDH-ORG II ion-associate, 59.2% (w/w) PVC and 0.37% (w/w) DBP was attached to one end of a plastic tube using THF, and dried at room temperature, for 24 h. 4 mL of 5.0 mmol/L-1 HDH and 2.0 m mol/L-1 KCl solutions were inserted into the tube. An Al wire was immersed into the tube, and connected to a potentiometer. The electrode was soaked in a 50 mmol/L-1 HDH solution, and was used after 5 h.
Procedure for bulk drug
Construction of the calibration curve
Suitable aliquots of a 5.0 mmol/L-1 standard drug solution, equivalent to 2.2 × 10⁻⁵ - 1.1 × 10⁻³ mol/L-1 of HDH, were measured and put into a series of 25 mL calibrated flasks. The volumes in each flask were raised to 30 mL with water, and the solutions pH in each flask was brought to the range from 2.5 to 5.21, in a 3 M NaOAc solution. The solutions were diluted up to the mark with water and well mixed, and the potentials were measured with the respective membrane sensor, using Ag/AgCl as reference electrode, at 25 ºC.
The measured potentials calibration plot versus log[HDH] was constructed and used to find an unknown HDH concentration. The corresponding RE was also obtained and used to calculate HDH concentrations in the samples.
Procedure for tablet analysis
20 Atarax 25 and Atarax 10 (UCB Pharma Ltd, Mumbai, India) tablets were roughly weighed for the required quantity, powdered and used for the analysis. An accurate amount of the powder equivalent to 50 mg HDH was transferred into a 100 mL calibrated flask, and 70 mL water were added to it. The mixture was shaken during 20 min, for proper dissolution, and the volume was brought up to the mark with distilled water. The solution was then filtered through Whatman no. 42 filter paper. A calculated volume of the tablet extract solution was diluted to obtain 5.0 mmol/L-1 HDH, and a suitable aliquot was used for the assay that followed the procedure above described.
Interference study
1 to 10.0 mL of the 5.0 mmol/L-1 pure HDH solution, 10 mL water and 1 mL of the 1 mol L-1 interferent solution were put into a series of 50 mL beakers. After the solutions pH adjustment from 2.5 to 5.21, they were diluted to 25 mL with water, mixed for homogeneity, and their potentials were measured by the proposed sensor, relative to the Ag-AgCl reference electrode.
Sensor K HDH.I determination
In a group of 50 mL beakers, 1 to 10 mL of a 5 mmol/L-1 HDH solution were taken and mixed with 1.0 mL of 1.0 mol/L-1 interferent. The solutions pH was adjusted in the range from 2.5 to 5.21 and, then, the volumes were raised with water to 25 mL, and homogenised. The new sets of solutions were prepared using the same procedure for different interferents. The potentials were recorded using the HDH-ORG II sensor.
The graph of ECell (cell potentials) versus log[HDH] was plotted, the point of intersection was located, and the KHDH.I values for each interferent were calculated using the following formula 43:
where z HDH is the cationic and anionic charges on HDH, zI is the charge on the added interferent, [HDH]E and [I]E are the HDH and interferent concentrations, respectively, to generate indistinguishable ECell values, [HDH]Int is the HDH concentration in the internal solution and [I]add is the interferent concentration present in or added to the HDH solution.
Results and discussion
Due to the sulfonate anionic group present in the ORG II dye, there isa strong tendency to form the complex with the counter cations. In the membrane preparation, the dye was utilised as an ion-pair complexing agent with HDH in CHCl3. Hydroxyzine, as a positively charged amino compound in an acidic medium, formed an extractable red coloured HDH, in CHCl338, ion-pair complex with the ORG II anionic dye [1:2], which shows maximum absorption at 480 nm, as represented in Fig. 2.
Figure 2 Absorption spectra of A: ion-pair complex (9.0 µg/mL-1 HDH with ORG II); and B: blank (ORG II without HDH).
The possible reaction pathway showing the formation of the ion-pair complex between the drug and the dye is shown in Scheme 1.
The resultant ion-pair complex was used in the membrane fabrication. The systematic representation of the electrochemical cell for HDH determination, using the membrane sensor, is shown below:

where Ag-AgClIR and Ag-AgClSR are the reference electrodes immersed into an internal (HDHI) and reference (HDH) sample solutions, respectively, and Membrane is a sensor devised with ORG II as an ion associating agent, DBP as plasticizer and PVC as matrix.
The relation between ECell and [HDH]Sample is given by the Nernst equation 43:
where K accounts for the reference electrode.
Variables optimization
Membrane components
At the beginning, a series of trials, with different amounts of materials, such as ion exchangers, plasticizer and PVC, were executed to obtain the suitable membranes. The membranes obtained with different amounts of each of the above components were used for constructing ionic selective electrodes (ISEs), and their effective functioning for HDH sensing was checked by potentiometry. The results obtained for the membrane sensors, using 10 mg of ion-associate, 160 mg PVC and 100 mg DBP, were highly reliable. Moreover, the calibration line slope prepared with varying materials amounts, at other concentrations than those indicated above, was not acceptable for Nernstian behavior. 10 mL THF were found suitable for the complete materials dissolution. At larger volumes than 10 mL, no much variation was seen. The membranes became dried enough in 24 h, after being poured into a Petri Dish. Hence, the same standing evaporation time was fixed. Thus, the membranes were prepared by the optimised procedure.
Plasticizer choice
Different plasticizers, such as dibutyl sebacate (DBS), DBP, dioctyl phthalate (DOP) and NPOE, were used in different amounts, to obtain a suitable membrane. The Nernstian behaviour was seen in the membranes prepared with 100 mg DBP. The sensor showed a quick performance, with consistent potentials and ease of conditioning. However, the evaporation and response time were prolonged when the DBP amount was greater than 100 mg. So, 100 mg DBP is recommended to be used as plasticizer to design the HDH-ORG II sensor. Other plasticizers did not yield acceptable results in relation to calibration, Nernstian behaviour, quick response and consistent ECell values.
Internal reference solution
The calibration curve was prepared for HDH potentials and logarithmic concentrations data, using a HDH-ORG II sensor, with varied concentrations of internal HDH and KCl solutions, for obtaining linearity between the potentials, logarithmic concentrations and the Nernstian slope. The required result was obtained when a mixture of 5 mM HDH and 2 mM KCl solutions, as internal standard, was used. An acceptable correlation between potentials and log[HDH] was observed, with a Nernstian slope of 57.41 mV/decade, for the proposed sensor. The calibration curve between potentials and log[HDH] is shown in Fig. 3.
Figure 3 Calibration plots of ECell against log[HDH], for HDH concentrations in the range from 2.2 × 10⁻⁵ to 1.1 × 10⁻³ M, under optimum conditions, with the HDH-ORG II sensor.
Soaking time
The sensors were soaked in a HDH standard solution, for different intervals of time to sufficiently activate their surfaces. The soaking was finalised by locating the time point from which the potential became steady and constant. The experimental results indicated the need of soaking the sensors for 5 h. Thus, this time was fixed as the duration required to make the membrane active surface ready for effective use at 25 ºC. The fixed time factor and its variation, to measure the HDH sensors potential, are indicated in Fig. 4. This study also revealed and confirmed that the dried sensors may be placed in any closed opaque vessel, and used after conditioning, by soaking them in a standard HDH, for 5 h.
Figure 4 Effect of soaking/conditioning time on the potential of a 6.6 × 10⁻⁴ M HDH solution measured with a HDH-ORG II sensor.
Effect of pH
The pH effect on the HDH ECell solutions using the proposed sensor, relative to the Ag-AgCl electrode, was evaluated. The HDH solutions ECell values, in the pH range from 0.5 to 10, were measured using the proposed electrochemical cell assembly. The solutions pH was brought to the required values by adding 1 M NaOAc or diluted NH3 solutions, and the potentials were recorded. The steady state was found to be attained in the pH range from 2.5 to 5.21. The potential values were lower and inconsistent out of the mentioned pH range. This pH effect on the HDH solutions ECell is showed in Fig. 5. According to the trend in the plot, the pH in the range from 2.5 to 5.21 was fixed as optimum for the HDH solutions potentials measurement using the HDH-ORG II sensor.
Figure 5 pH effect on the potential of a 6.6 × 10⁻⁴ M HDH solution measured with a HDH-ORG II sensor.
Response time
The experimental response time of the conditioned sensor was evaluated. It was found to be 30 s for HDH solutions, after immersion in an analyte solution. Therefore, the conditioned sensor was immersed into HDH sample solutions, and the potentials were recorded after 30 s.
Sensor life time
The sensor was assessed for its stable and uncompromised performance ability. The resultant Nernstian slope was free from deviations, while the sensor was used for, at least, 48 days. However, after this period, the Nernstian behaviour was disturbed. Therefore, 48 days of validity were declared for the devised sensor.
KHDH.I evaluation
The chemical interaction between the membrane surface active sites and the analyte is responsible for the membrane potential (Em) generation. The membranes poor selectivity towards a single species is due to the chemical process on the signal. Em is practically in proportion to the ions concentration capable of interacting at the membrane active sites. The generalized Nernst equation, that includes the contribution of an interferent, I, is convened as below:
where K constant includes the reference electrode potential, the liquid junction potential and Em. The charges on HDH and I are denoted by ZHDH and ZI, respectively. The KHDH.I parameter is defined as:
where [HDH]E and [I]E are the HDH and interferent concentrations, respectively, to yield the same Ecell values. When KHDH,I is equal to unity, the membrane responds for both HDH and I. A selective membrane must always possess a KHDH.I value < 1.0.
Thus, KHDH.I can be evaluated using the solutions potentials with I and [I]add known but constant amounts, and varying HDH concentrations. Two distinct linear regions in the Ecell plot against the analyte concentration logarithmic values gave significant data for the KHDH.I value assessment. When [HDH]E is significantly > KHDH,I [I]add, Ecell is a linear function of the log [A]. However, if KHDH.I [I]add is significantly > [A], Ecell remains constant. The analyte and interferent concentrations, at the two linear regions intersection, were used to calculate KHDH.I for HDH, with different Is (Table 1). The sensor was tested with various inorganic and organic compounds, anions and cations. For the tests, a 1 M solution of each interferent was spiked into a pre-analysed HDH solution 44), (45. The results show that the developed sensor was free from the interfering species action during the HDH analysis, as shown by the KHDH.I values (Table 1).
Table 1 Sensor KHDH.I for different interferents.
| Interferent | KHDH.I |
| -Na+ | 0.235 |
| K+ | 0.213 |
| H+ | 0.123 |
| Ca2+ | 0.342 |
| Zn2+ | 0.234 |
| Glycine | 0.090 |
| Ammonium oxalate | 0.063 |
| Formic acid | 0.089 |
| Citric acid | 0.127 |
| Tartaric acid | 0.342 |
| Benzoic acid | 0.211 |
| Salicylic acid | 0.132 |
| Phthalic acid | 0.187 |
| Oxalic acid | 0.127 |
| Boric acid | 0.389 |
| Talc | 0.474 |
*Average of 5 determinations.
Therefore, the developed sensor is the most suitable electrode for HDH analysis, even with such interferents.
Sensor validation
The sensor has been validated for various parameters, according to IUPAC 44), (45 and the International Council for Harmonization of Technical Requirements for Pharmaceuticals for Human Use (ICH) guidelines 46. The results are presented in the following sections.
Linearity of calibration curve, regression data and performance characteristics
HDH measured potentials and concentrations were in very good correlation with linearity, as shown in the calibration curves in Fig. 3. The linearity obeying the Nernstian behavior has been reflected by the slope of 57.41±1.04 mV/decade. The curve fitting equation from the regression data is obtained as Y = 57.41 X + 312.2.
The RC value, with very good linearity between the measured potentials and log[HDH], has also been calculated. All these data, along with the LOD, were calculated by following IUPAC’s recommended procedures 44), (45. The values measured from the intersection of the calibration line extrapolated linear portions and other parameters for the sensor performance are given in Table 2.
Table 2 HDH-ORG II membrane sensor performance features.
| Parameter | Values |
| Linear range, M | 2.2 × 10⁻⁵ to 1.1 × 10⁻³ |
| Limit of detection (LOD), M | 4.5 × 10⁻⁶ |
| Slope (m), mV/decade | 57.41 |
| Intercept (b), mV | 312.2 |
| Correlation coefficient (R) | 0.9995 |
| R2 | 0.9990 |
| pH (optimum) | 2.50 - 5.21 |
| Life time, days | 48 |
Evaluation of precision and accuracy
For studying precision with intra-day variations, seven replicates, each of 0.4, 0.6 and 0.8 mM HDD, were prepared by diluting a 0.005 M HDH standard solution with distilled water, and analysed. The %RSDs for each solution were calculated (Table 3). For inter-day deviations, the analysis of five replicates, each of 0.4, 0.6 and 0.8 mM HDH, were analysed in three days.
Table 3 Results of precision and accuracy of the HDH-ORG II sensor.
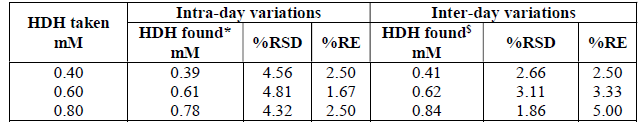
*Mean value of seven measurements; $Mean value of five measurements.
The calculations were also undertaken to obtain the %RE (relative error) inter- and intra-day analyses values, and used as an accuracy metric. The %RSD values, from 1.86 to 4.81, and the %RE values, from 1.67 to 5.0, indicate the accurate and precise functioning of the ion electrode for HDH determination.
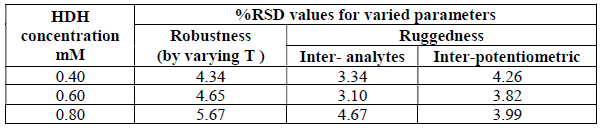
Robustness and ruggedness
The sensor robustness was assessed by purposely changing the optimum operating temperature by 2 ºC, in the analysis of 0.4, 0.6 and 0.8 mM HDH solutions. The %RSD values for HDH, at 23, 25 and 27 ºC, were found to be in the range from 4.34 to 5.67 (Table 4). The proposed sensor was used for analysing HDH by analytes. The instrumental variations were also evaluated by three different potentiometers. The %RSD values variation of <5.7 confirmed the sensor robust and rugged behaviour.
Applicability of the HDH-ORG II sensor for HDH tablets analysis
The analyses were done by taking five replicates of tablet extracts containing 0.6, 0.8 and 1.1 mM HDH, and using the designed and validated sensor. The found HDH amount and recovery values (%), with the RSD values, were calculated. The mean recovery and RSD values were compared with those of the official United States Pharmacopeia (USP) method 18, which describes an HPLC procedure with uv-detection at 232 nm, to determine HDH in tablets, by the Student-t and F- tests. The tablet extract HDH analytical recovery values obtained by the proposed and official methods, tCal and FCal (calculated), are all presented in Table 5. The tCal and FCal values were lower than 2.77 ttab and 6.39 Ftab (tabulated), respectively, at a 95% confidence level, for four degrees of freedom. Hence, the sensors accurate and precise results inference was statistically given.
Table 5 HDH tablets analysis results using the proposed sensor, and statistical comparison with those of the official USP method.
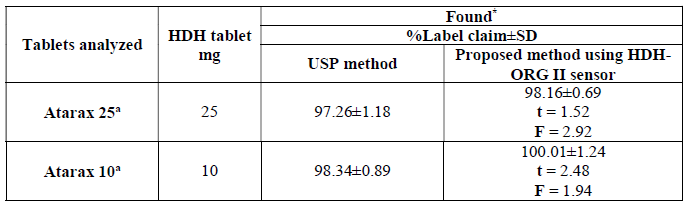
*Mean value of 5 determinations. (The t-tab value is at the 95% confidence level, and, for four degrees of freedom, is 2.77). (The F- tab value is at the 95% confidence level, and, for four degrees of freedom, is 6.39). a Marketed by UCB Pharma Ltd, Mumbai, India.
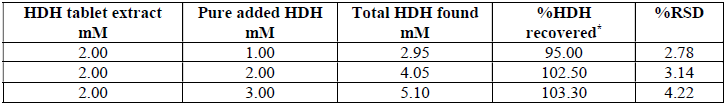
Recovery study
The proposed HDH-ORG II sensor was used for recovery experiments, by following the standard addition procedure. Three different levels of pure HDH solutions spiked into a pre-analyzed tablet extract were obtained, and the potentials were recorded by potentiometry, using the HDH-ORG II sensor. Into five replicates of 2 mL tablet extract of 5 mM HDH, 1, 2 and 3 mL of a 5 mM HDH standard solution were spiked. The pH was adjusted to an optimum value and, after adding water up to 25 mL and mixing, the potentials were measured. The total HDH amounts were calculated in each case, and, finally, the recovery values were computed. The recovered HDH values (Table 6) were from 95 to 103.3, which highlighted the assay procedures accuracy using the proposed sensor.
Conclusions
A simple and cost effective PVC mediated ion selective electrode has been newly devised, for HDH potentiometric assay. It uses a sensor with ORG II as ion-exchanger, DBP as plasticizer, and PVC as matrix component, for HDH selective and rapid determination. The method does not pose any environmental hazard and, thus, it has a highly green approach. A simple potentiometer and eco-friendly analytes were required, which has made the method economic. The reported literature has described many analytical procedures for HDH determination, but they have disadvantages such as the need of sophisticated instruments, highly skilful operators, and costly and toxic solvents. Thus, this green sensor is useful within a wide linear range, with Nernstian response and a low LOD. The statistical tests confirmed the procedure accessibility for HDH assay in pure and tablet forms, with excellent recoveries, and agreement with the official USP method results. The excipients in tablets did not show any interference, and, hence, the method is extremely selective. Therefore, the HDH-ORG II sensor can be used as an analytical tool to determine HDH in quality control laboratories, on a routine basis.
Acknowledgments
The authors thank UCB Pharama Ltd, Mumbai, India, for gifting pure HDH. The authors are deeply grateful to the authorities of JSS Mahavidyapeetha and the Principal of JSS College of Arts, Commerce and Science, Mysuru, for providing all the required infrastructure facilities and consumables, to undertake this work.

