Introduction
Hospital wastewater is considered to be one of the main sources of water resources contamination, as the result of the different activities carried out there and of the excretion of substances by patients [1, 2], which, in consequence, consume large quantities of water on a daily basis, ranging from 400 to 1,200 liters per day-1 * bed-1 [3], exceeding the minimum domestic water consumption of 100 L per inhabitant in one day [4]. The effluents composition is quite complex and includes emerging pollutants, pathogenic micro-organisms, toxic chemicals and radioactive elements [5]. Studies have shown that these components are not easily removed by conventional treatment processes such as treatment plants using biological processes [6, 7]. As a consequence, they have been found in drinking water sources, constituting a potential risk to human health [1, 7]. Despite their specific nature, hospital effluents are not considered differently from urban wastewater, and are discharged to public sewerage systems, in some cases, without any kind of treatment [8]. The growing presence of contaminants produced by hospital wastewater, and its negative effect on living beings, is generating the need to develop non-conventional technologies suitable for their degradation and/or stabilization [9]. In addition, the lack of knowledge of waste treatment techniques in hospital activities makes it imperative to innovative methods of treatment, alternatives to the conventional ones, which are more economical and effective, and suitable for the environment conservation. An electrochemical method such as electrocoagulation can be an alternative for hospital wastewater treatment, as it is used for different organic and inorganic contaminants removal, offering economic accessibility, easy operation and maintenance [10, 11]. The objective of the present study was to evaluate the continuous flow electrocoagulation process for hospital wastewater treatment, in order to establish the operating conditions on a pilot scale. For this reason, from this perspective, the electrocoagulation technique becomes a process that can have successful results in its application, optimizing the factors that make it up, answering the challenge of protecting, conserving and recovering the water resources.
Materials and methods
Sample collection and preservation
A twelve (12) hour composite sampling was performed in a hospital facility in the city of Montería - Córdoba, Colombia. The sample was directly obtained from the outlet ducts to the sewage system, without any type of pre-treatment, every hour until completing the time of composite sampling. Afterwards, it was stored in dark plastic containers of 10 liters, previously washed and dried. Subsequently, integration was carried out depending on the discharge flow rate. The hospital wastewater sample characterization was performed according to the following parameters, based on standard methods [12]: chemical oxygen demand (COD), phenols, naproxen, pH, biochemical oxygen demand (BOD), total suspended solids (TSS) and phosphates (PO4 -3) parameters. The naproxen determination was performed by high-performance liquid chromatography (HPLC-DAD), based on the method described by [13].
Experimental setup
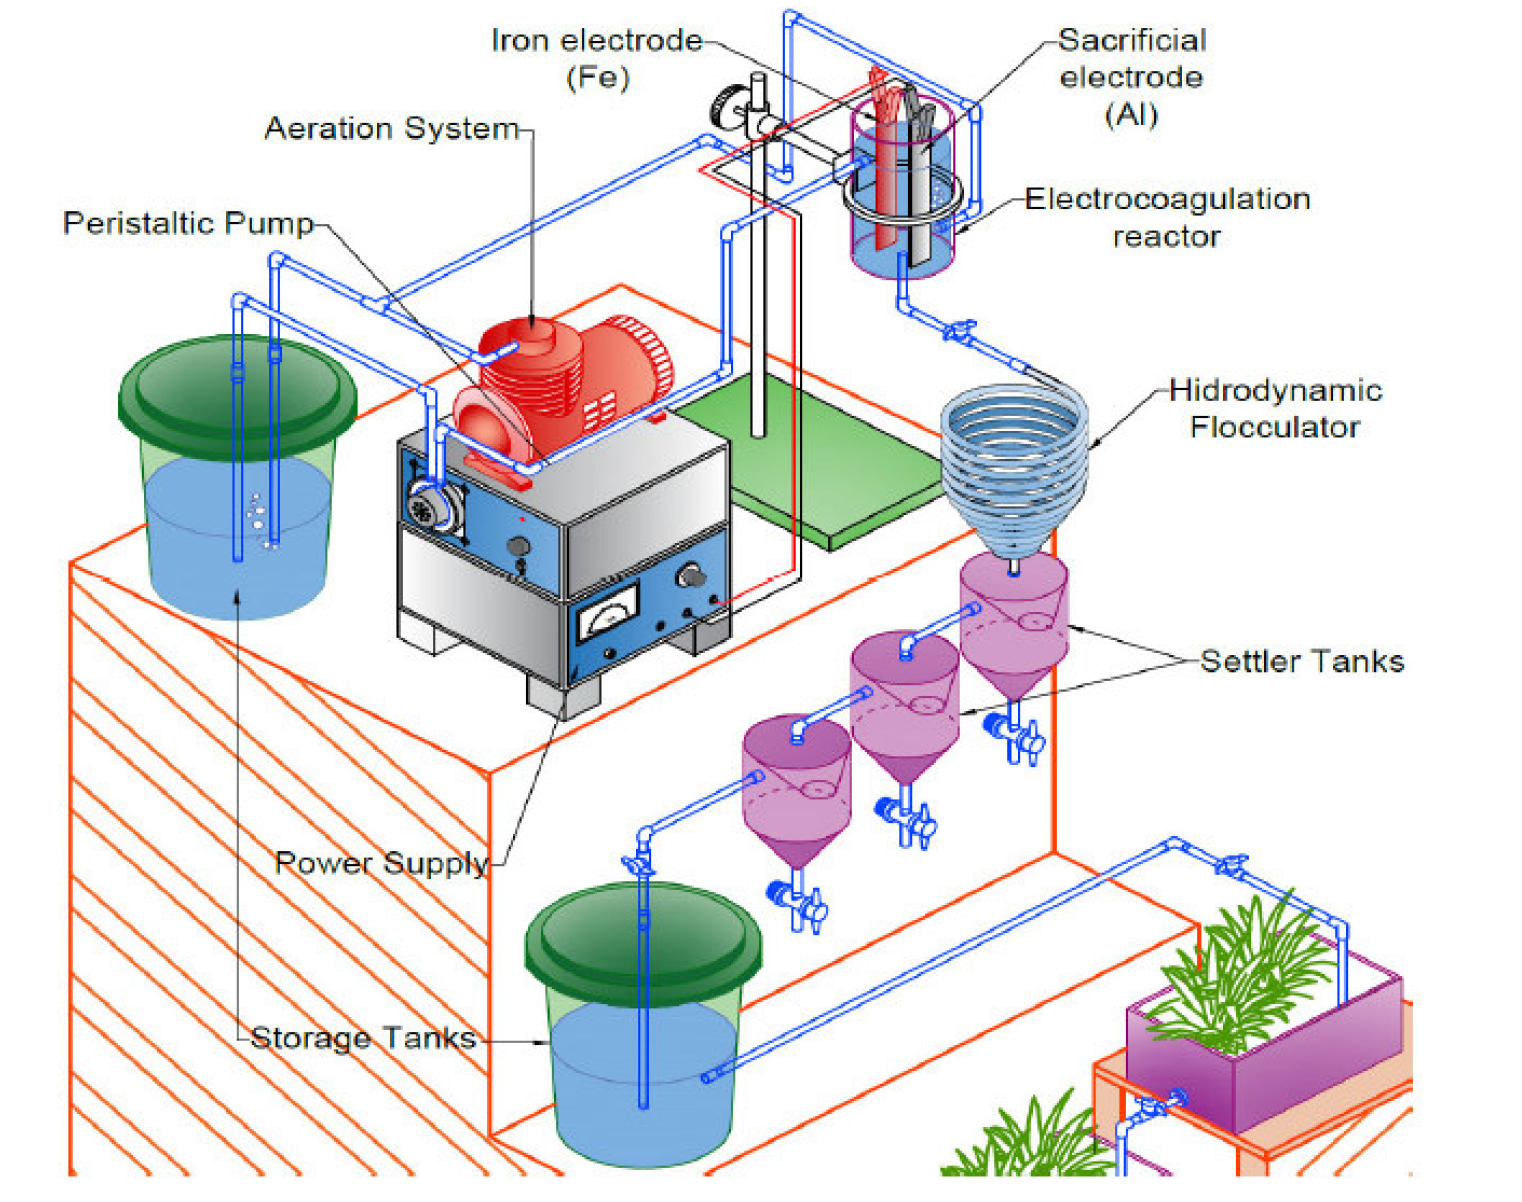
The experimental scheme used is shown in Fig. 1. The electrocoagulation system consisted of a cylindrical electrochemical cell made up of non-conductive material (plastic), with a work volume of 1000 mL, iron (Fe: cathode) and aluminum (Al: anode) electrodes, with the dimensions of 20 x 2.7 x 0.3 cm, connected to a direct current power supply (PHYWE 0-50V). The aeration system was a compressor, with diffusion to the storage tank and an electrocoagulation cell. A hydraulic flocculator with different configurations, composed of a transparent industrial hose with three different diameters and lengths, was adapted by an interconnection that allowed the flow to enter directly to the settler, consisting of three 3 L plastic containers and a lower valve to expel the sediment. The operation mode had a continuous flow using a peristaltic pump (Microgon INC, Laguna Hills, Model No. 92653), to maintain the inlet flow to the electrolytic cell. Optimization of the experimental conditions of the electrocoagulation process experimental conditions was carried out using a Box-Behnken (BBD) design, under the surface response method (SRM).
| Testing | pH | Potential (V) | RT (min) | %R (COD) |
|---|---|---|---|---|
| 1 | 0 | -1 | 1 | 64.8 |
| 2 | 0 | 1 | 1 | 68.4 |
| 3 | 0 | 0 | 0 | 72.7 |
| 4 | 1 | 1 | 0 | 76.4 |
| 5 | -1 | -1 | 0 | 59.1 |
| 6 | 0 | -1 | -1 | 52.1 |
| 7 | 1 | 0 | 1 | 68.5 |
| 8 | -1 | 1 | 0 | 57.4 |
| 9 | 0 | 1 | -1 | 54.3 |
| 10 | 1 | 0 | -1 | 70.1 |
| 11 | 0 | 0 | 0 | 72.7 |
| 12 | 1 | -1 | 0 | 63.2 |
| 13 | 0 | 0 | 0 | 72.7 |
| 14 | -1 | 0 | 1 | 60.3 |
| 15 | -1 | 0 | -1 | 53.3 |
RT: retention time; %R: removal percentage.
The variables or factors were: pH (4, 6 and 8 units), potential (20, 30 and 40 volts) and retention time (10, 30 and 60 min). The factors were coded as: -1, representing the lower levels; 0, indicating central points; and +1, showing the upper levels (Table 1). The established response variable was the percentage of organic matter removal, as COD. Statistical analysis was performed with Statgraphics Centurion XV.II software. The phenols, naproxen, pH, SST, BOD5 and PO4 -3 parameters were determined pre and post treatment, depending on the optimization conditions established on the basis of the experimental design.
Results and discussion
Physicochemical characterization of hospital wastewater
Table 2 shows the evaluated parameters for the initial physicochemical characterization of hospital wastewater. It is observed that the COD, phenols and TSS parameters exceed the limit established in Resolution 0631 of 2015 for human health care activities (article 14), in a ratio of 2.5 (COD), 14 (phenols) and 3.2 (TSS) times, compared to the established reference value. pH values are close to neutralization and remain within the reference range. Although the resolution does not present permissible limits for phosphates and naproxen, it should be noted that the phosphate content can cause eutrophication processes in water bodies without prior treatment. In the case of naproxen (an emerging contaminant), treatment plants generally use biological processes without showing results on hospital wastewater, since their removal capacity in this type of recalcitrant compounds is low [14, 15]. This is why electrochemical processes are an option for the treatment of this type of contaminants. The BOD5/COD ratio was 0.27, indicating that wastewater is not biodegradable (< 0.3) [16]. This indicates that hospital wastewater is inherently recalcitrant in nature, therefore, being susceptible to electrochemical treatment. However, it should be noted that the found values are very variable, since they depend on the type of activity and the intensity at which it is carried out.
Table 2 Physical-chemical characterization of hospital waste water.
| Parameter | Unit | Value | Norm (Res. 0631 de 2015) |
|---|---|---|---|
| COD | mg/L | 502.8 ± 4.8 | 200 |
| BOD5 | mg/L | 136.4 ± 17.2 | 150 |
| Phenols | mg/L | 2.8 ± 0.6 | 0.2 |
| Naproxen | mg/L | 3.85 | NA |
| Phosphates | mg/L | 10.4 ± 1.5 | Analysis and report |
| TSS | mg/L | 158.6 ± 22.4 | 50 |
| pH | - | 7.6 | 6.0 - 9.0 |
TSS: total suspended solids.
Optimisation of electrocoagulation conditions
In order to find the optimal operating conditions for the electrocoagulation treatment of hospital wastewater RSM statistical analysis was applied to evaluate the simple and combined effects of independent factors (pH, potential, retention time) on COD removal (variable response), and the optimization of working conditions based on the results obtained from the experimental design (Table 1).
RSM application, on the basis of parameters estimation, generated the second order regression model that indicates the relationship between the removal percentage (y) and the studied independent variables (Equation 1).
y1 = -142.213 + 10.1937*X1 + 2.425*X2+ 4.2475*X3- 0.70625*X12 (1)
+ 0.18625*X1*X2 - 0.0716667*X1*X3 - 0.0585*X22
+ 0.00316667*X2*X3 - 0.0303333*X23
where X1 is pH, X2 is the potential and X3 is the retention time. By replacing terms, the equation can be expressed as:
%COD = -142.213 + 10.1937*pH + (2)
2.425*potential+4.2475*retention time - 0.70625*pH2
+ 0.18625*pH*potential - 0.0716667*pH*retention time - 0.0585*potential2
+ 0.00316667*potential*retention time - 0.0303333* retention time2
The determination coefficient (r2) was 0.799, which implies that 79.9% of the variations in COD removal efficiency are explained through independent variables. Furthermore, according to Montgomery [17], it is higher than 75%, indicating the possibility of continuing with the methodology.
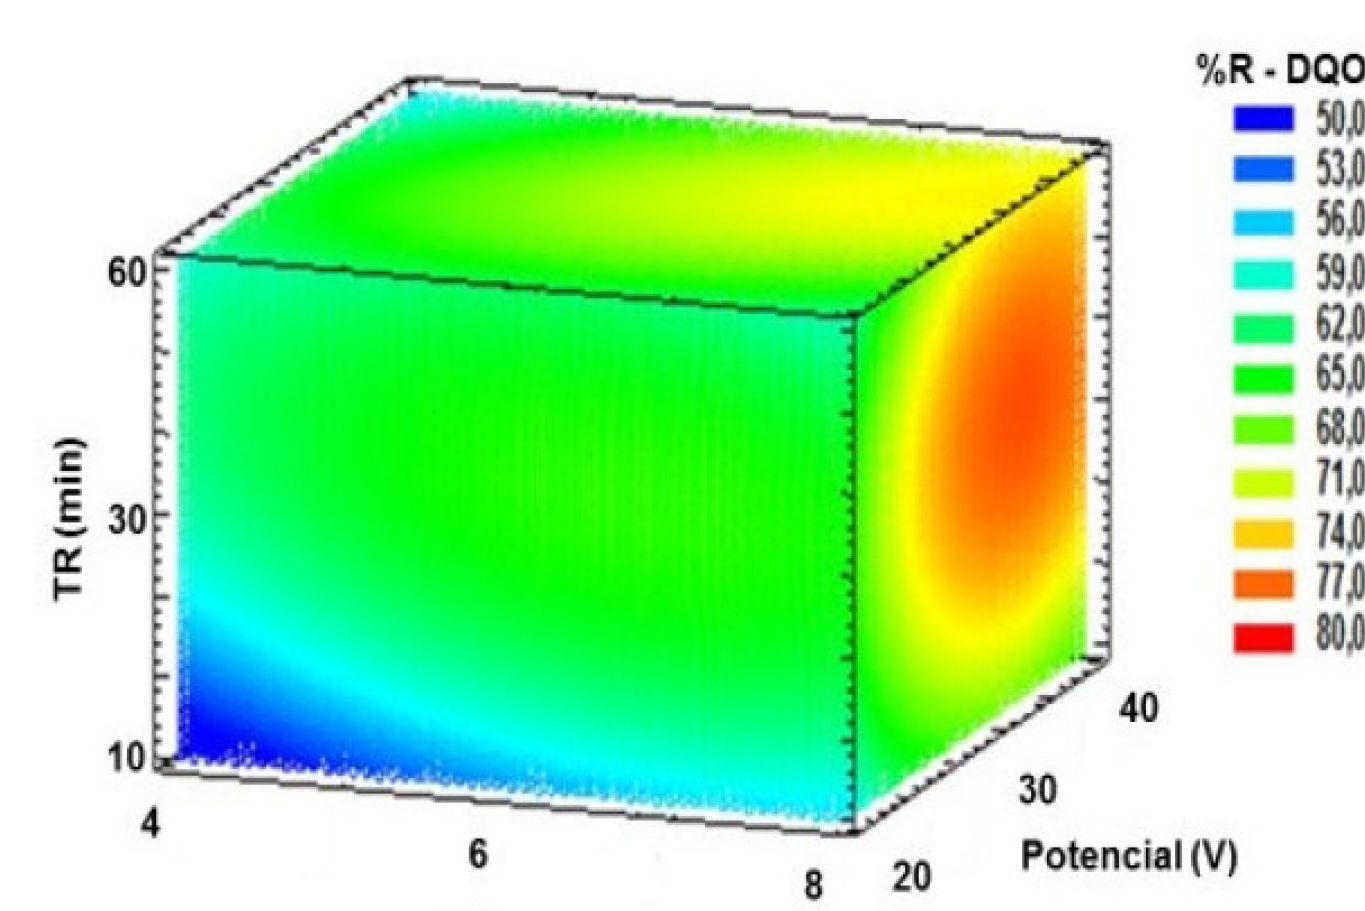
Fig. 2 shows the response surface calculated on the basis of the model, which allows visualizing the response variable behavior, and indicates the combination of levels factors that led to a selected removal efficiency value. In this study, the best results were found in the orange and red region, where the interaction of factors led to results from 74 to 80%.
To test the statistical significance of the effects, as a function of the mathematical model, a variance analysis was performed (Table 3).
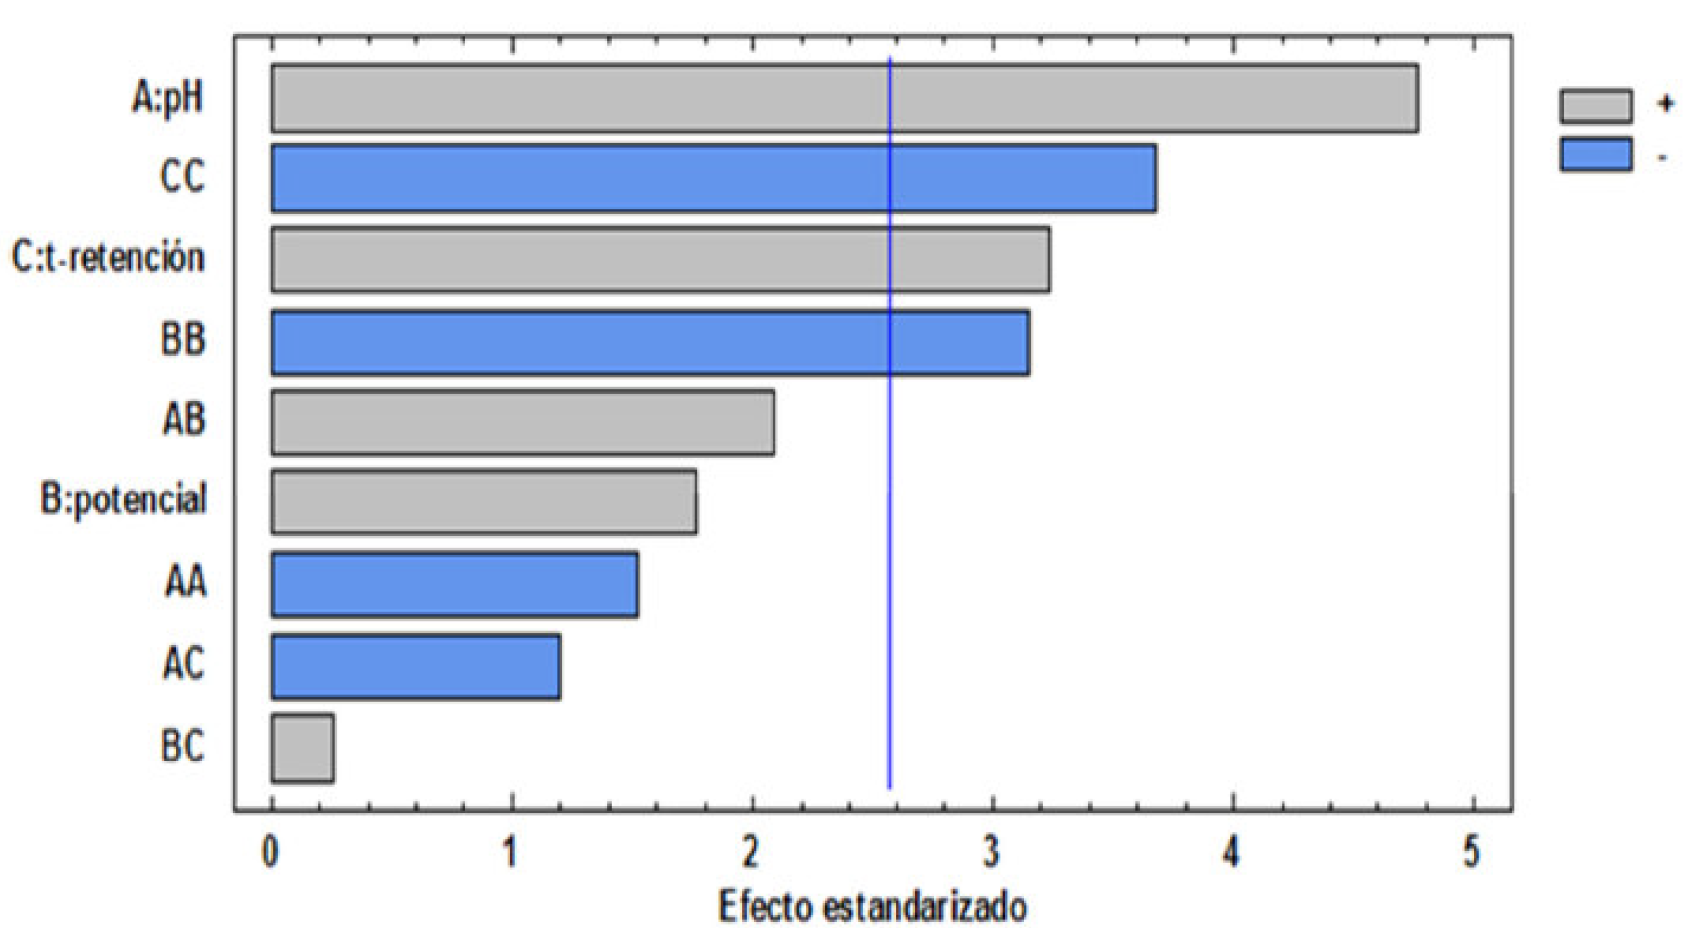
It is observed that linear terms (X1: pH; X3: retention time) are statistically significant variables (p <0.05), as they are quadratic factors (X2 2: potential; X3 2: retention time). However, the Pareto diagram (Fig. 3) was used to evaluate the positive or negative influence of changes in the variables on the percentage removal response.
Table 3 Analysis of variance for COD removal efficiency by EC.
| Source | Sum of squares | Gl | Middle Square | Reason-F | P-value |
|---|---|---|---|---|---|
| X1: pH | 289.20 | 1 | 289.20 | 22.67 | 0.0051 |
| X2: Potential | 39.60 | 1 | 39.60 | 3.10 | 0.1384 |
| X3: retention time | 133.66 | 1 | 133.66 | 10.48 | 0.0230 |
| X1 2 | 29.47 | 1 | 29.47 | 2.31 | 0.1890 |
| X1X2 | 55.50 | 1 | 55.50 | 4.35 | 0.0914 |
| X1X3 | 18.49 | 1 | 18.49 | 1.45 | 0.2825 |
| X2 2 | 126.36 | 1 | 126.36 | 9.91 | 0.0255 |
| X2X3 | 0.902 | 1 | 0.902 | 0.07 | 0.8009 |
| X3 2 | 171.99 | 1 | 171.99 | 13.48 | 0.0144 |
| Total error | 63.78 | 5 | 12.76 | ||
| Total (corr.) | 892.21 | 14 |
This figure shows each of the estimated effects on an in increase in the order of magnitude. Therefore, the Pareto diagram analysis indicates that the pH (A) and retention time (C) factors are directly proportional to the COD removal response, unlike the quadratic factors (BB) and (CC) which are inversely proportional to the response variables. In general, pH is a key factor in electrochemical processes and chemical coagulation, because, under certain conditions complexes and polymeric compounds, they occur through hydrolysis and polymerization reactions of electrochemically dissolved aluminum (Al) [18, 19]. It should be noted that the electrocoagulation process presented the best results at slightly basic pH, which is possibly attributed to the aluminum hydroxide amphoteric character that makes it not to precipitate at low pH values [20]. Similar results have been reported in other studies using Al electrodes [21]. Considering the retention time, a significant parameter for the electrocoagulation process, it appears that the COD removal efficiency increased as a function of the retention time, possibly due to the fact that, in the early stages of electrolysis, there is a greater formation of alumina, a polymeric species that increases the removal efficiency, precipitating a greater amount of organic matter [22]. In addition, as the electrolysis time increases, the mixing and reaction times increase, generating a greater proportion of hydrogen bubbles in the cathode, which improves the degree of mixing and enhances the flotation capacity [23, 24].
In the case of potential, although it was not a significant parameter in terms of statistical analysis, it should be noted in general that COD efficiency removal increased at higher potentials, possibly due to the fact that they increase the anode dissolution. Consequently, the resulting aluminum hydroxide produces a greater proportion of sludge, while, in its absence, the organic matter removal occurs [25]. In addition, the increase in bubble formation improves the degree of mixture, as a function of Al (OH)3, and the capacity to form flocs [26].
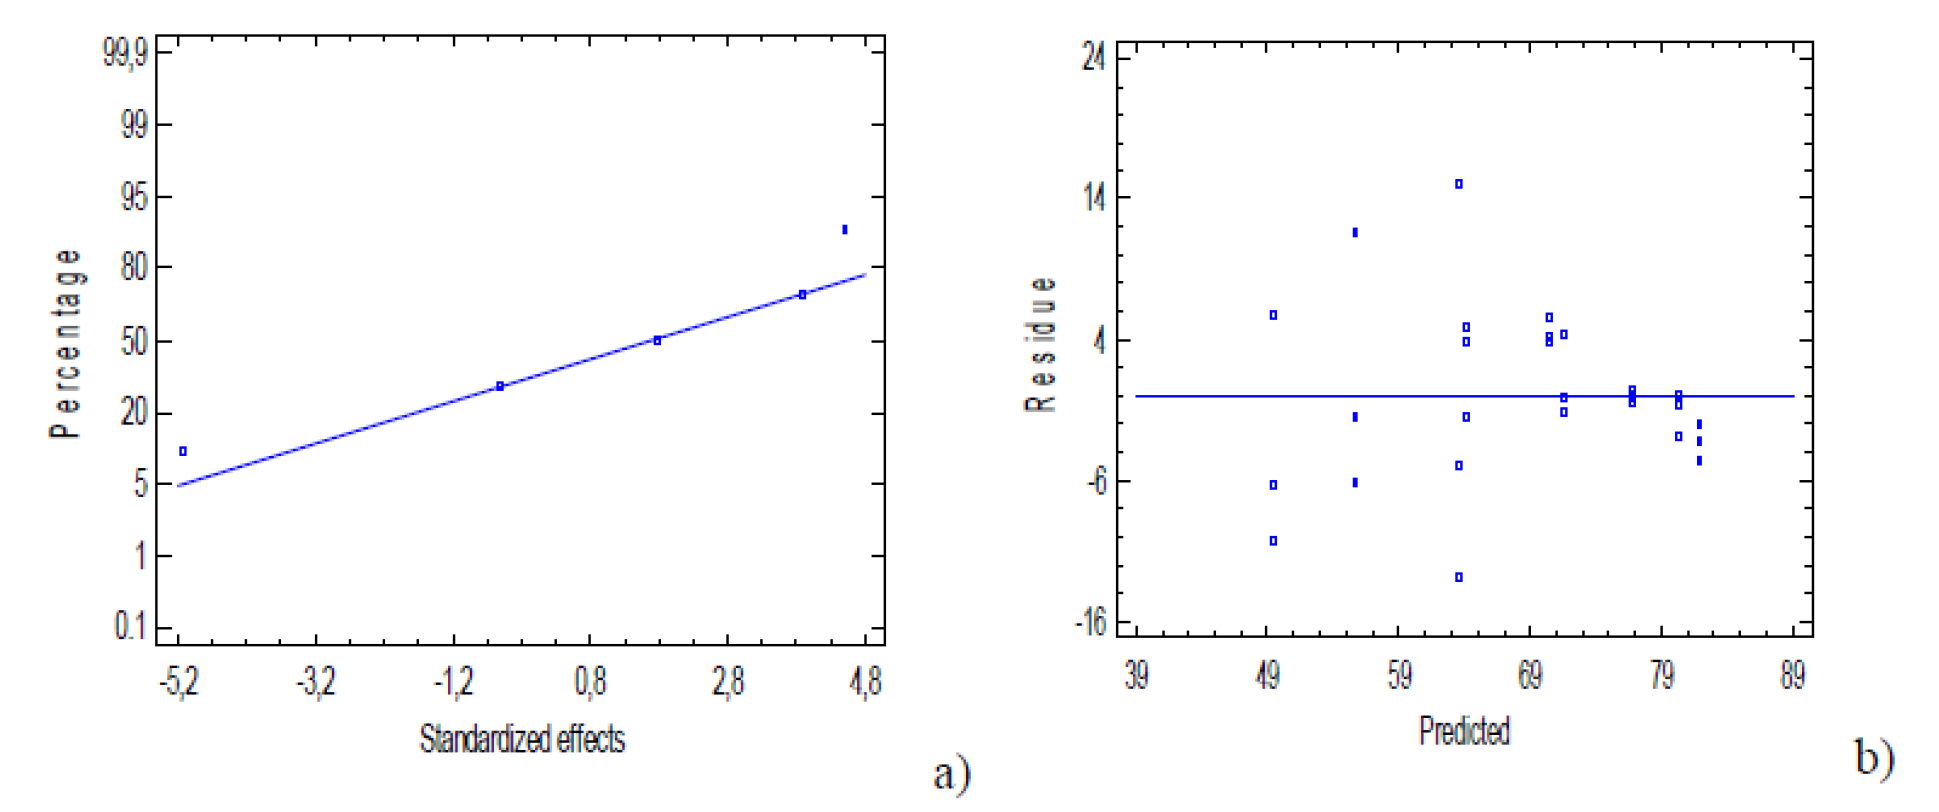
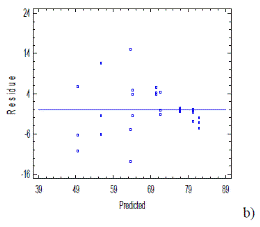
In addition to the mentioned criteria that were used to evaluate the fit of the model developed to optimize the electrocoagulation process, the normal probability of the residues, and the difference between the experimental results and the response prediction (residues) were used to analyze the model graphical effectiveness.
Fig. 4 a-b shows the graph of normal probability and residues which met the statistical criteria established by Sarabia and Ortiz [27], by presenting a linear trend based on the probability and random pattern of residues that were founded from the prediction model.
Finally, the model generated the optimal values for maximum COD removal efficiency, as a function of the factors (Table 4). It is observed that there are no significant differences (p <0.05) when experimentally evaluating the optimal conditions, which confirms that the response surface methodology can be used to optimize the process parameters. In addition to COD physicochemical parameter evaluation (123.18 mg L-1; post electrocoagulation treatment), BOD5 (55.64 mg L-1), phenols (0.54 mg L-1), phosphates (1.53 mg L-1), TSS (38.74 mg L-1) and naproxen (0.91 mg L-1) concentrations were determined using the optimal operating conditions of the response variable used as a COD reference, and have reached removals of 59.2%, 80.7%, 85.3%, 75.6% and 55.7%, respectively. Comparing the results with respect to the permissible limits established in Resolution 0631 of 2015, it is observed that the criteria established for the COD, BOD5, TSS and phenols parameters were met.
The results show that the application of the electrocoagulation technique had a positive effect under the studied optimal operating conditions, because the BOD5/DQO ratio value (biodegradability index) increased from 0.27 to 0.45, thus indicating that the sample went from not being biodegradable to being slightly biodegradable [16, 28], possibly because the organic matter was not mineralized; rather, it was only transformed to a more biodegradable state [29].
When comparing the results with other studies, it is found that they are similar or superior, in some cases, to those reported by: Elazzouzi, et al. [29], for urban wastewater electrocoagulation/flocculation treatment (COD: 85%, BOD: 84%; TSS: 94%; and PO4: 99%); Farhadi, et al. [30], for COD removal from pharmaceutical wastewater by electrocoagulation processes (< 35%); Wang, et al. [31], for COD removal from domestic wastewater by electrocoagulation (62%); Hutnan, et al. [32], for COD removal from urban wastewater by electrocoagulation (COD: 50-80%); Chen, et al. [33], for COD removal from wastewater (restaurants) by electrocoagulation (COD: 95-99%); Pouet and Grasmic, [34] for COD removal from urban wastewater by electrocoagulation (COD: 70-80%); Fajardo, et al. [35], for synthetic wastewater treatment by electrocoagulation (phenols: 84.2%; COD: 40.3%) and for olive oil effluent wastewater treatment (phenols: 72.3%; COD: 20.9%); Bazrafshan, et al. [36], for phenol removal from aqueous solutions by the electrocoagulation process using iron (94.7%) and aluminum (98.0%) electrodes; Irdemez, et al. [37], for phosphates removal from wastewater by electrocoagulation using aluminum electrodes (99-100%); Kuokkanen, et al. [38], for phosphates removal from synthetic wastewater by electrocoagulation (96%); and Franco, et al. [39], for phosphates removal from wastewater by electrocoagulation (99%).
Conclusions
The applied electrochemical treatment allowed COD (75.5%), BOD (59.2%), phenols (80.7%), PO4 (85.2%), TSS (75.5%) and naproxen (75.5%) removal, under optimal electrocoagulation conditions, at pH of 7.92, potential of 40 V and retention time of 15 min. These results indicated that the electrochemical treatment process is an effective method, in terms of the physicochemical parameters removal evaluated in hospital wastewater. In addition, this study demonstrated that the response surface methodology is a suitable method for optimizing operating conditions and maximizing COD removal, as well as other physicochemical parameters.


