


 Inglês (pdf)
 Artigo em XML
 Referências do artigo
 Enviar este artigo por email
 Citado por SciELO
  Similares em
SciELO
Similares em
SciELO 
 Permalink
Introduction
MS is used in making alloys for structural and industrial applications, and has become essential since the industrial revolution. New high strength alloys are usually more susceptible to a certain type of corrosive attack. Generally, metallic materials that use acids undergo corrosion, which is inevitable. The acids used as media in MS corrosion studies are important, due to their industrial applications, such as pickling, industrial cleaning, descaling, oil-well recovery and petrochemical processes 1-3. The refining of crude oil has been carried out in a variety of aggressive conditions which cause the corrosion of equipments by a strong acid attack on its surface. Corrosion is a natural, gradual and costly destruction process of materials (usually metals), which converts a refined metal to a more chemically-stable form, such as its oxide, hydroxide or sulfide, by chemical and/or electrochemical reactions with its environment 5. Considerable progress towards the understanding of corrosion has been made. The consequences of corrosion are many and varied, and its effects on the safe, reliable and efficient operation of equipment or structures are often more serious than the simple loss of metal mass. Failures of various kinds and the need for expensive replacements may occur, even though the amount of metal destroyed is quite small 4. It is a constant, continuous and costly problem, often difficult to eliminate completely. Therefore, it is required to prevent it, or at least control it. Corrosion is minimized by using inhibitors in the industrial process, in order to control metal dissolution, especially in acidic, neutral and basic environments. Most of the efficient and well-known inhibitors used in industry are organic compounds containing hetero atoms, such as O, N, S and multiple bonds, which possess at least one functional group that is considered as the active center for the adsorption process. Several researchers studied the inhibition action of various organic compounds on Al, alloys, MS, CS and composites corrosion, in acidic, alkaline and neutral media 6,7.
The main aim of the present study was to use DBS to inhibit the corrosion of MS immersed in a 0.25 mol/L H2SO4 solution. DBS, in terms of IE% against MS CR, has been evaluated by the WL method. The corrosion inhibition mechanism has been examined by electrochemical studies, such as ACIS and PDP studies. MS surface morphology has been characterized by FTIR, SEM, EDAX and AFM techniques.
Materials and methods
MS specimens with the composition of 0.026% S, 0.068% P, 0.36 % Mn, 0.13% C, 0.23% Zn and the remainder Fe, and the dimensions of 1.0 × 4.0 × 0.2 cm, were polished to mirror finish, degreased with acetone, and used for the WL method.
Preparation of stock solutions
The 0.25 mol/L H2SO4 solution was prepared by the dilution of a H2SO4 analytical grade with double distilled water, to the required concentration. The DBS stock solution desired concentration was prepared by dissolving it in a minimum amount of ethanol, making it up to the required volume with double distilled water and, then, adding it to the H2SO4 solution.
WL method
WL measurements were done according to the described method 8-10, for 2 h, by immersing the MS specimens in 0.25 mol/L H2SO4, without DBS and with it, at different concentrations (5, 10, 30, 50 and 100 mM). After the elapsed time, the specimens were taken out, washed, dried and accurately weighed. MS corrosion IE(%) by DBS was determined through the following equation:
 (Eq. 1)
where Wi and Wo are the WL values in g, with and without DBS, respectively.
CR determination
The weighed triplicate MS specimens were suspended by glass hooks in 100 mL of 0.25 mol/L H2SO4, without DBS and with it, in various concentrations, for 2 h. After that period, the specimens were taken out, washed in running water, dried and weighed. From the change in the specimen weights, CR values were calculated using the following relationship:
 (Eq. 2)
Corrosion IE% was then calculated using the equation:
 (Eq. 3)
where W1 and W2 are the CR values without and with inhibitor, respectively.
Electrochemical techniques
PDP study
PDP studies were carried out in a Princeton Applied Research vs. STAT electrochemical work station impedance analyzer model. A three electrode cell assembly was used. The WE was MS, with one constant 1cm2 area exposed face, and the rest was shielded with red lacquer. Saturated calomel and a rectangular Pt foil were used RE and CE, respectively. The CE area was much larger than that of the WE, which exerted a uniform potential field on the former. The WE and CE were immersed in 0.25 mol/L H2SO4, with and without DBS 11. The RE was connected with the test solution, through a salt bridge.
EVs log I plots were recorded. The parameters, such as Ecorr, Icorr, βa and βc, were determined from E vs. log I plots.
AC impedance measurements
AC impedance studies were carried out in an electrochemical work station impedance analyzer model Princeton Applied Research versa STATMC. The cell setup was the same as that used for PDP measurements.
A time interval of 5 to 10 min was given for the system to attain a steady state OCP. Then, over this steady state potential, an AC potential of 10 mV was superimposed. The AC frequency was varied from 100 KHz to 100 MHz.
The real part (z’) and imaginary part (z”) of the cell impedance were measured in ohms, for various frequencies.
Rct values were calculated. Cdl values were calculated using the following relationship 12:
 (Eq. 4)
Surface examination techniques
The MS specimens were immersed in the solutions without and with DBS, during 2 h. After that, they were taken out and dried, and the nature of the film formed on their surface was analyzed by various analysis techniques.
Surface analysis by FTIR spectra
After an immersion period of 2 h in the solutions without and with DBS, the MS specimens were removed and dried. Their surface films were carefully scratched, thoroughly mixed with KBr pellets, so as to make them uniform, and their FTIR spectra were recorded in a Perkin-Elmer 1600 spectrophotometer, with a resolving power of 4 cm-113.
SEM
After an immersion period of 2 h in the solutions without and with DBS, MS specimens were removed, rinsed with double distilled water, dried and observed in a CAREL ZEISS EVO 18, Hitachi computer controlled SEM, to assess their surface morphology 14.
EDAX
After an immersion period of 2 h in the solutions without and with DBS,MS specimens were removed, rinsed with double distilled water, dried and observed in a Bruker computer controlled EDAX (Brucker Nano, GMBH, Germany), to assess the elements present on their surface 15.
AFM characterization
After an immersion period of 2 h in the solutions without and with DBS,MS specimens were removed, rinsed with double distilled water and dried 16.
The MS surface morphology measurements were carried out by AFM, using Agilent technology 5500 series model.
Results and discussion
The IE% and CR values (Table 1) of MS immersed in 0.25 mol/L H2SO4, without DBS inhibitor and with it, in different concentrations, were obtained by the WL method.
Table 1 CR and IE% data obtained from WL measurements for MS immersed in a 0.25 mol/L H2SO4 solution, without DBS and with it, in various concentrations (mM), for 2 h.
| DBS (mM) | CR (mmy) | IE (%) |
| - | 1.4478 | ----- |
| 0.8423 | 41.8 | |
| 10 | 0.7061 | 51.2 |
| 30 | 0.6001 | 58.5 |
| 50 | 0.5456 | 62.3 |
| 100 | 0.3797 | 80.9 |
The CR was found to depend on the DBS concentration. IE% reached its maximum at 80.9%, with DBS concentration of 100 Mm. Consequently, the CR decreased, due to a wider MS surface coverage, which limited the metal dissolution, by blocking its corrosion sites. The S atom electron donating properties can be attributed to higher IE(%) values. These data are in good agreement with the results reported by many researchers 17.
Electrochemical analysis
The electrochemical measurements are a way for calculating MS CR. They also quickly assess the inhibitor performance and the surface film durability. The following techniques were used for studying MS corrosion in 0.25 mol/L H2SO4, without and with DBS. They revealed if the inhibitor was of the cathodic, anodic or mixed type, and also formulated an appropriate mechanism for its action against corrosion.
PDP study results
PDP study has been used to confirm the formation of a protective film on the MS surface, during the corrosion inhibition process. If a protective film is formed on the MS surface, LPR values increase and Icorr decreases 18-20. PDP curves of MS immersed in 0.25 mol/L H2SO4, and DBS IE%, are shown in Fig. 1 (a, b).
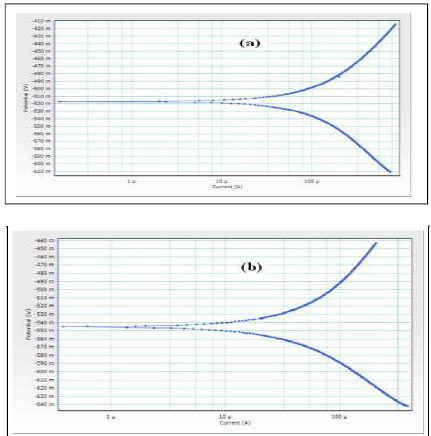
Figure 1 PDP curves of MS immersed in test solutions: (a) 0.25 mol/L H2SO4 (blank); (b) 0.25 mol/L H2SO4 + 100 mM DBS.
The corrosion parameters are given in Table 2.
Table 2 Corrosion parameters, obtained by PDP, for MS immersed in 0.25 mo/L, without and with DBS.
| Systems | Ecorr vs SCE (mV) | Icorr (A/cm2) | βa (mV/dec) | βc (mV/dec) | LPR (ohm/cm2) |
| 0.25 mol/L H2SO4 | -518 | - 617 | 136 | 112 | -0.4323 |
| 0.25 mol/L H2SO4 + 100 mM DBS | -545 | - 666 | 192 | 131 | 0.5102 |
When MS was immersed in 0.25 mol/L H2SO4, its Ecorr was -518 mV vs SCE. When 100 mM DBS were added to the solution, MS Ecorr shifted to the cathodic side, at -545 mV vs. SCE. This indicates that the protective film was formed on the MS surface cathodic sites. This film controlled the MS dissolution cathodic reaction, by forming a Fe2+-DBS complex on the metal surface cathodic sites. Further, the LPR value increased from -0.4323 to -0.5102 ohm/cm2, and Icorr decreased from -617 to -666 µA. Thus, PDP study confirmed the formation of a protective film on the MS surface.
Analysis of ACIS results
ACIS analysis has been used to confirm the formation of a protective film on the MS surface 21-22. If a protective film is formed on the MS surface, Rct and the impedance log (z/ohm) values increase, and Cdl decreases. ACIS of MS immersed in 0.25 mol/L H2SO4, without and with DBS, are shown in Fig. 2 (a, b), and their values are given in Table 3.
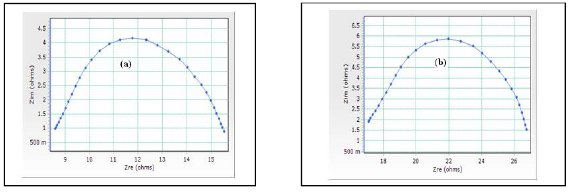
Figure 2 a. ACIS of MS immersed in 0.25 mol/L H2SO4, without DBS; b. ACIS of MS immersed in 0.25 mol/L H2SO4, without DBS and with it.
Table 3 Corrosion parameters, obtained from ACIS, of MS immersed in 0.25 mol/L H2SO4, without and with DBS.
| System | Nyquist plot | Bode plot | |
| Rt (Ω/cm2) | Cdl (F/cm-2) | Impedance [log (Z/ohm-1)] | |
| 0.25 mol/L H2SO4 | 14 | 8.6412×10⁻⁵ | 0.1180 |
| 0.25 mol/L H2SO4 + 100 mM DBS | 21.97 | 9.317×10⁻⁶ | 1.053 |
It was observed that, when DBS was added to MS immersed in 0.25 mol/L H2SO4, Rct increased from 14 to 21.97 Ω cm2, and Cdl value decreased from 8.6412 × 10⁻⁵ to 9.317 ×10⁻⁶ F/cm-2. The impedance value [log (z/ohm)] increased from 0.1180 to 1.053. These results led to the conclusion that a protective film was formed on the MS surface.
FTIR spectra analysis
FTIR spectra have been used to analyze the protective film formed on the MS surface 23-24. DBS structure is shown in Fig. 3.
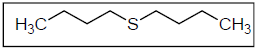
DBS FTIR spectrum is shown in Fig. 4a. The CH and CS stretching frequencies appear at 2836.25 and 780.96 cm-1, respectively.
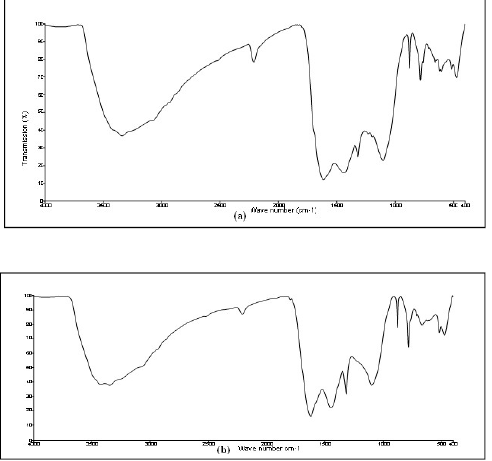
Figure 4 (a) FTIR spectrum of pure DBS; (b) FTIR spectrum of the film (Fe2+-DBS complex) formed on the MS surface after immersion in 0.25 mol/L H2SO4 containing 100 mM DBS.
FTIR spectrum of the film complex (Fe2+-DBS) formed on the MS surface, after its immersion in 0.25 mol/L H2SO4 with 100 mM DBS, is shown in Fig. 4 b. The CH and CS stretching frequencies have shifted from 2836.25 to 2925.32 cm-1 and from 780.96 to 712.65 cm-1, respectively. A new peak appeared in the region of 490 cm-1, since the DBS S atom has coordinated with Fe2+, forming a complex on the MS surface.
MS surface SEM analysis
To understand the MS surface nature, and its CR without and with the inhibitor system, its SEM micrographs were examined. The SEM images of the MS specimen immersed in 0.25 mol/L H2SO4, in the inhibitor system absence and presence, for 2 are shown in Fig. 5 (a, b, c, d, e and f).
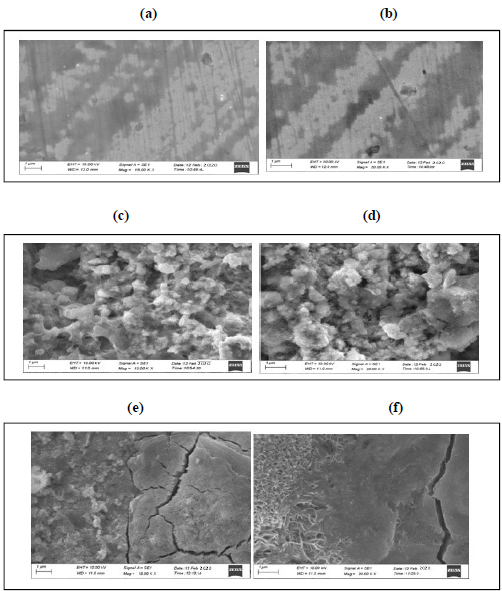
Figure 5 SEM analysis of MS: (a) magnification kX 15.00 (control); (b) magnification kX 20.00 (control); (c) in 0.25 mol/L H2SO4, magnification kX 15.00 (d) 0.25 mol/L H2SO4, magnif. kX 20.00; (e) 0.25 mol/L H2SO4 + 100 mM DBS, magnif. kX 15.00 (control); and (f) 0.25 mol/L H2SO4 + 100 mM DBS, magnif. kX 20.00 (control).
The SEM micrographs of Fig. 5 a and b show the polished MS surface (control), without any corrosion products; c and d show the rough MS surface immersed in 0.25 mol/L H2SO4, with its highly corroded area; e and f show the MS surface almost free from corrosion, in 0.25 mol/L H2SO4 with 100 mM DBS, due to the formation of an insoluble complex. 25.
MS surface EDAX spectra
The EDAX spectra were used to determine the elements present on the MS surface, before and after its exposure to the inhibitor system. The aim of this section was to confirm, with the results obtained from chemical and electrochemical measurements, that an inhibitor surface film was formed on the MS surface. 26-29. MS EDAX spectrum is shown in Fig. 6a.
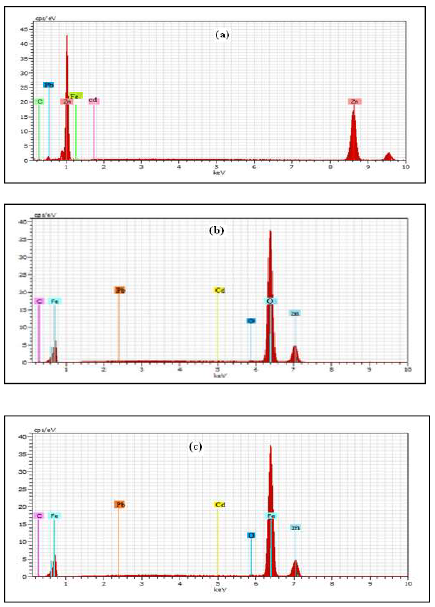
Figure 6 EDAX spectrum of: (a) MS specimen (control); (b) MS after immersion in 0.25 mol/L H2SO4; c) MS specimen after immersion in 0.25 mol/L H2SO4 + 100 mM DBS.
The EDAX spectrum of MS immersed in 0.25 mol/L H2SO4 is shown in Fig. 6b. It indicates that the Fe signal characteristic peaks was reduced, and that the O signal has increased in intensity. This means that MS underwent a corrosion attack by H2SO4.
The EDAX spectrum of MS immersed in 0.25 mol/L H2SO4 and 100 mM DBS is shown in Fig. 6c. It shows the additional line characteristic of the O signals reduced intensity, and the Fe signal increased intensity. These data show that the MS surface has been covered with Zn, Pd, Cd and Fe atoms. This layer was undoubtedly due to the inhibitor system.
The Fe peaks observed in 0.25 mol/L H2SO4 with DBS were considerably suppressed, compared to those observed in the solution without the inhibitor. This suppression occurred due to the overlying inhibitor film, i.e., an inhibitor adsorbed layer that protected MS against corrosion, suggesting that DBS S atom has coordinated with Fe2+, resulting in the complex formation on the MS surface.
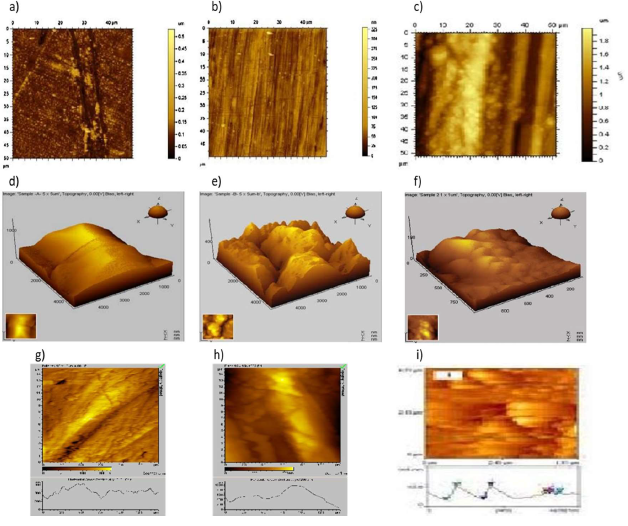
Analysis of the AFM results
AFM is a powerful technique for gathering roughness statistics from a variety of surfaces. It is becoming an accepted method of roughness investigation. All AFM images were obtained on an Agilent technology 5500 series mode that operated on the contact mode in air. The scan size of all the AFM images is 5 x 5 µm, at a scan rate of 2.4 lines per s 30-34.
Table 4 shows the various AFM parameters obtained for the MS surface immersed in different environments.
Table 4 AFM data for MS immersed in 0.25 mol/L H2SO4, without and with the inhibitor systems.
| Environment | AFM parameters | ||
| Average Ra (nm) | RMS value Rq (nm) | Maximum P/V height (nm) | |
| Polished MS | 423 | 367 | 2112 |
| Polished MS + 0.5 N H2SO4 | 709 | 606 | 2604 |
| Polished MS + 0.5 N H2SO4 + 100 mM dibutylsulphide | 589 | 459 | 2188 |
The two and three dimensional AFM morphologies and the AFM cross sectional profile, for MS polished surface (reference sample) immersed in 0.25 mol/L H2SO4 and 0.25 mol/L H2SO4 with 100 mM DBS, are shown in Fig. 7 (a, b, c), (d, e, f) and (g, h, i). andP/Vs , and, respectively
Fig.7, 2D, 3D and broken line (b, e, h) , after immersion in mH2SO4 without DBD, had Ra, RMS and maximum P/Vheight values of 709, 606 and 2604 nm, respectively, indicating the formation of Fe oxides and high roughness of the corroded metal surface. The surface microstructure shows many smaller and larger corrosion product deposits.
Conclusion
In this present study, the DBS compound was used as a corrosion inhibitor to control the corrosion of MS immersed in 0.25 mol/L H2SO4. The present study led to the following conclusions:
DBS acted as an inhibitor against corrosion of MS immersed in 0.25 mol/L H2SO4, and showed good corrosion IE(%).
PDP study indicates that the effective DBS system functioned as a cathodic inhibitor, predominantly controlling the cathodic reaction.
The WL technique showed the IE of 80.9%.
EIS measurements indicate an increase in Rct, a decrease in Cdl and Icorr values, due to the adsorbed layer increased thickness.
FTIR spectra revealed that the protective film composition was the Fe2+-DBS complex.
SEM micrographs showed a polished and smooth MS surface without the aggressive media, and in it with DBS. The AFM microscopes confirmed the MS surface roughness in 0.25 mol/L H2SO4, and its smoothness in the solution with DBS.
Authors’ contributions
P. Vijayakumar: selected the problem; made the literature survey; incorporated new ideas with available literature; has done the experimental part. S. Valarselvan: helped in the spectral characterization; suggested the interpretation report; guided in the paper writing. S. S. Syed Abuthahir: gave outlines about how to write the paper; helped in the interpretation and analysis part; suggested this Journal.
Acknowledgement
The authors are thankful to the Principal of H. H. Rajah's College and to the Principal and College Management Committee Members of Jamal Mohamed College. The authors are also thankful to the DST-FIST, for providing instrumental facilities to carry out research work.
Abbreviations
AC: alternating current
ACIS: alternating current impedance spectroscopy
AFM: atomic force microscopy
βa: anodic Tafel slope
βc: cathodic Tafel slope
Cdl: double layer capacitance
CE: counter electrode
CR: corrosion rate
DBS: dibutyl sulphide
E: potential
Ecorr: corrosion potential
EDAX: energy dispersive analysis of X-rays
FTIR: Fourier transform infrared
H2SO4: sulphuric acid
I: current density
Icorr: corrosion current density
IE(%): inhibition efficiency
KBr: potassium bromide
LPR: linear polarization resistance values
MS: mild steel
OCP: open circuit potential
PDP: potentiodynamic polarization
P/V: peak to valley
Ra: average roughness
RE: reference electrode
RMS: root-mean-square
Rtc: charge transfer resistance
SEM: scanning electron microscopy
WE: working electrode
WL: weight loss

