Introduction
Understanding the physical, mechanical and chemical properties of metallic materials is essential for their efficient usage in structural and building applications. The chemical properties of metals cannot be dissociated from the prevailing service environment and conditions 1-3. Although MS is commonly used for a wide range of industrial applications, because it is readily available at a low cost, and possesses good physical and mechanical properties, it has poor resistance to dissolution in a reactive service environment 4-6. This has led to increasing investigations on how to mitigate MS corrosion 7,8. Corrosion is a type of surface deterioration that occurs when metals are exposed to aggressive environments, due to reactions between them. During many of these industrial processes, MS is exposed to severe corrosive attacks by acid solutions 7,9-11, such as H2SO4, which is widely used in industries for pickling, descaling, acid cleaning, acidizing of oil wells, etc. In order to combat this problem, the use of chemical inhibitors is regarded as one of the most successful techniques, due to their ease of application and cost-effectiveness. However, since most of the compounds examined for CI are either toxic or very expensive, there is a need for further research, in order to identify non-toxic, environmentally benign and inexpensive inhibitors, with good IE(%) at low C 5. A large array of research publications has outlined and described numerous chemical compounds that possess corrosion protection properties. However, only a few of them have been employed as CI in the industries. To some extent, this is because the properties desired for a CI are not limited to the surface protection of metals in service. of Cost, availability, toxicity and eco-friendliness considerations are paramount, due to the rising global ecological campaigns, tougher environmental regulations and sanctions 5,9,11,13-15.
In water presence, which serves as an ion transport channel, metallic electrochemical corrosion occurs when electrons from atoms on the metal surface are transported onto a suitable electron acceptor. The most common electron acceptors (depolarizers) are O, acids and the cations of less active metals. CI are chemical compounds that interact with metallic surfaces, or with their environment, thereby giving them an amount of protection or corrosion resistance 16-18. The effectiveness of organic/inorganic CI is largely determined by factors such as the metal and aggressive solution properties, their mode of interaction, the inhibitor molecular and electronic structure, C, solubility, pH and T 5,19. The most extensively utilized methods to estimate the molecular reactivity of every inhibitors compounds are DFT and MD simulations 20,21. Any fundamental strategy for preventing corrosion must take into account the metal structural properties, the environment, and the reactions that occur between them 21,22. Research found that many organic compounds with N, O, P and S heteroatoms and/or with π-electron systems are employed as metals CI in different service environments 7,10,23. These inhibitors adsorb themselves onto the metallic surfaces, thereby changing the electrical double layer structure 5,11,24-26, and creating a protective surface film on the metal, which serves as a barrier against the aggressive media 9,15,27. Usually, CI are applied by dispersion, or distributed from a solution. Some of them are integrated into the formulation of protective coatings. They work by accelerating anodic or cathodic polarization behaviour, lowering the migration or diffusion of corrosive ions to the metal surface, and increasing its electrical resistance 5.
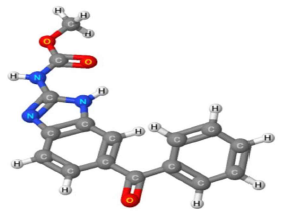
Many medicinal substances and medication have been identified as possessing chemical characteristics like those of some CI 4,26,28,29, since their chemical structures are similar. This is because they contain electronegative atoms and functional groups that can facilitate their adsorption onto the metallic surface, and form an adherent protective surface film 5,12,16. Medicines used as CI have relatively higher IE(%), as they possess complex molecular structures, with N, O and S multiple hetero-atoms and non-bonding π-electrons 12,28,30. Most heterocyclic medicines, according to reports, are ecologically friendly 16. The present work used MBZ as a chemical inhibitor of MS corrosion in a 0.5 M H2SO4 solution, using experimental and theoretical approaches. MBZ is a synthetic C7H6N2 derivative. It is a white to yellowish powder that is soluble in formic acid and other inorganic acids, but not in water or most organic solvents. MBZ chemical formula is C16H13N3O3, and its molecular weight is 295.30 g/mol 30-33. One of its most common pharmacological use is as an anthelmintic (worm-killing) agent 31. MBZ is being experimentally and theoretically studied as a suitable corrosion inhibitor for MS in H2SO4 and similar acidic service environments, since it is a low cost, non-toxic and biodegradable compound, with O and N hetero atoms in its aromatic ring structure (Fig. 1).
Experimental techniques
The following is a step-by-step summary of the experimental methodologies and procedures used in this study.
Materials reparation
Test media
All WL studies were carried out at room T in a 0.5 M H2SO4 solution made from double-distilled deionized water. The experiments were performed with 100 mL of the test media. A local pharmacy provided Wormin® MBZ (made by Cadila Pharmaceutical Ltd., Dholka, India).
Test specimen preparation
The chemical composition of a 16 mm cylindrical MS rod used for this examination was described in the authors’ prior investigations 32,33. The rod was meticulously cut and sliced into several 15 x 10 mm long test coupons. For the specimens suspension, a 5 mm hole was drilled in their centre.
Before each experiment, MS samples were polished with numerous grades of emery paper (from 800 to 1200), and, afterwards, they were cleaned with distilled water and cleansed with acetone.
FTIR spectroscopy characterization of the inhibitor
Agilent Technologies’ FTIR Cary 630 was used to assess MBZ functional properties. During the analysis, the inhibitor sample was scanned using transmittance method, and FTIR spectra were acquired over a wavenumber range from 650 to 4000 cm-1, with a resolution of 8 cm-1. MBZ chemical bond information and functional groups were detected using FTIR characterization.
WL measurements
MS test coupons were weighed and suspended in in 100 mL beakers containing the prepared test media, for 24, 48, 72, 96 and 120 h IT, with and without MBZ. They were removed when the required IT expired. The corrosion products were removed from MS samples by washing them in distilled water, rinsing in acetone and drying in ambient air. The coupons were then re-weighed to obtain their final weights. WL measurement findings are shown in Table 1. CR (mL/year) was calculated using Eq. 1.
where D is density (g/cm2) and A is area (cm2). IE(%) for MBZ was calculated using the relationship given in Eq. 2a.
CRc and CRi were determined without and with MBZ various C, respectively. IE(%) of MBZ was calculated for all its C during various IT of MS in H2SO4. θ by MBZ was determined using Eq. 2b.
Curves showing the relationship between IE(%) of MBZ, C and θ, and IT of MS, were also plotted.
Electrochemical measurements
IE(%) of MBZ was evaluated using a VersaSTAT 4 Electrochemical System auto lab potentiostat/galvanostat, controlled from a PC suitably equipped through a USB interface, and with Versa Studio electrochemistry software suite. All the experiments were conducted in a Pyrex glass cell with three electrodes. The WE was a test piece enclosed in polyester resin, with a total area of 1 cm2 exposed to a corrosive liquid, and the CE was a Pt rod. The RE was an Ag/AgCl rod. These electrodes were connected to the electrolytic cell by a Luggin capillary. All the electrochemical test procedures and parameters were per the authors’ previous investigations 32,35, and their values are shown in Tables 2 and 3. IE(%) was calculated according to Eq. 3.
where icorri and icorrc were determined for the MS coupon in the H2SO4 solution without and with MBZ, respectively, at a specified C.
SEM characterization of the MS surface
Following WL measurements, the corroded MS coupons surface morphology was scanned and examined by a SEM Phenom Pro X Model (Phenom world, Eindhoven, Netherlands) equipped with appropriate EDXS, for elemental and corrosion product characterization. The scanning techniques and SEM instrument parameters were reported in the authors’ previous studies 32,35,36.
DFT studies
All quantum chemical investigations were carried out utilizing DFT/B3LYP methods with the 6-311 G (d, p) basis set, which is very reliable for geometrical optimizations, using the Gaussian 09 software. Because corrosion occurs in the aqueous phase, it is computationally appropriate to incorporate the solvent effect. Hence, all quantum computations were done in the aqueous phase, using SCRF theory and PCM. HOMO, and LUMO have been measured as quantum chemical characteristics linked to 37,38 ELUMO, EHOMO and Δ. In an aqueous solution, µ and N110 were computed using Gaussian 09 W 39.
∆N from MBZ molecules onto the MS surface, during inhibitor-metal interaction, was computed using Eq. 4.
∅ value was 4.82 eV, and Fe was 0 40. When ∆N is greater than zero, the metal electron transfer inhibition occurs, i.e., ∆N > 0.
Fukui indices, which indicate the reactive centres within the molecules, may be used to analyse local reactivity 41.
MDS
Accelrys Inc.'s Materials Studio 6.0 42 was used to run MD simulations in a simulation box with periodic boundary conditions. A 5 slab was utilized to cut the Fe crystal, which was imported and cleaved along the (110) plane. The smart minimizer system was used to reduce the Fe (110) surface energy, which alleviated it. The Fe (110) surface was extended to a (10) supercell, in order to provide a large surface for the inhibitor action. A vacuum slab was built with a thickness of zero. A supercell with the dimensions of a = 28.66 Å, b = 40.53 Å and c = 33.24 Å, comprising 250 H2O, 20H3O+, 10H2SO2 and 1 MBZ molecule, was created based on molecules to sulfate proportion in 0.5 M H2SO443. The test was run in a simulation box (28.66, 40.53, 33.24 Å3), at 303/333 K, NVT ensemble (constant no. of atoms, volume and T) and COMPASS force field 44, with a time step of 1 fs and a total simulation time of 500 ps.
Einteraction and Ebinding determined using Eqs. (5) and (6) 45,46 were employed to understand MBZ/Fe (110) interfaces in the simulation framework.
where Etotal is the entire system total energy, Esurface + solution is the total energy of the Fe (110) surface and HCl without inhibitor, and Einhibitor is MBZ total energy.
Optimization of IE(%) and other corrosion properties using RSM
Researchers have attempted to describe and optimize CI factors, and anticipate their responses using experimental design software packages and approaches such as RSM 47-50. IE(%) and other corrosion parameters were changed using RSM, based on the CCD tool of Design-Expert software version 11. A quadratic design model was employed in the investigation. WL, CR, IE(%) and θ were employed as response variables (1 to 4), while C and IT were employed as independent factors (1 and 2). To acquire the optimized responses of the dependent variables, a total of 30 tests runs was carried out.
Results and discussion
FTIR spectroscopy analysis
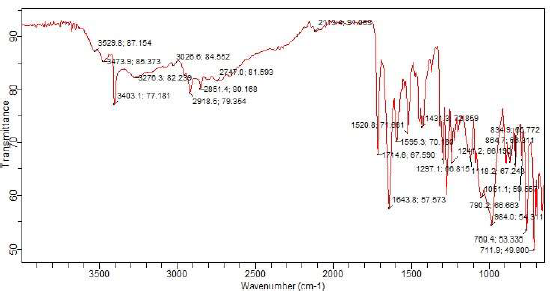
Fig. 2 illustrates FTIR spectra for MBZ.
CI and molecular adsorption of MBZ onto MS surfaces in H2SO4 were due to the functional groups and bond types within its structure. Inside MBZ molecular structure, due to NH group, there was a band from 3276 to 2113.4 cm-1, which is associated with intense stretching of the imidazole ring 7,51. C=N group was in the ranges from 1743 to 1595 cm-1. C=C group was in the ranges from 1431 to 1241 cm-1. The bands from 1241 to 1051 cm-1 and from 984 to 711.9 cm-1 depict in-plane and out of plane CH bending deformation of the imidazole ring, respectively. CH3 strong symmetric and asymmetric stretching bonds were also assigned from 3026.6 to 2918.5 cm-1 (52. C-C ring stretching vibrations were observed at the frequency bands from 1643.8 to 1431.3 cm-1 in FTIR spectra.
Gravimetric measurements
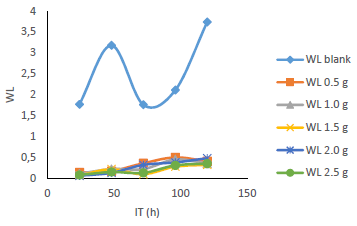
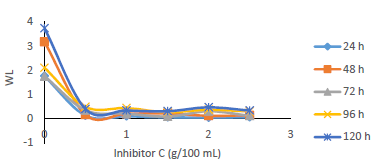
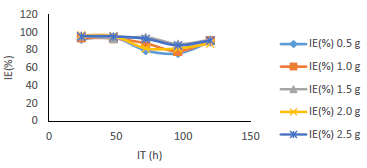
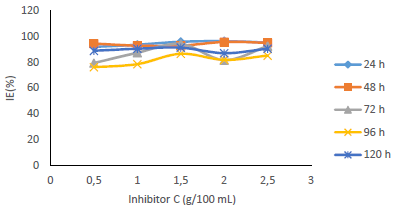
Table 1 shows WL and CR of MS, and IE(%) for MBZ, whereas Figs. 3 to 10 show a graphical representation and comparison of the corrosion parameters. At several C (0, 0.5, 1.0, 1.5, 2.0 and 2.5 g), IE(%) of MBZ against MS corrosion, in 0.5 M H2SO4, was investigated.
Table 1: CI results from WL of MS in 0.5 M H2SO4, at various IT, without and with MBZ, in various C.
| IT (h) | CI properties | Inhibitor C (g/L) | |||||
|---|---|---|---|---|---|---|---|
| Blank | 0.5 | 1.0 | 1.5 | 2.0 | 2.5 | ||
| 24 | WL (g) | 1.77 | 0.14 | 0.11 | 0.07 | 0.06 | 0.08 |
| CR (mm/yr) | 1.31 | 0.10 | 0.08 | 0.05 | 0.04 | 0.06 | |
| IE(%) | - | 93.79 | 96.05 | 96.61 | 95.48 | 92.09 | |
| ( | - | 0.94 | 0.96 | 0.96 | 0.95 | 0.92 | |
| 48 | WL (g) | 3.18 | 0.17 | 0.22 | 0.22 | 0.13 | 0.15 |
| CR (mm/yr) | 1.18 | 0.06 | 0.08 | 0.08 | 0.05 | 0.06 | |
| IE(%) | - | 94.65 | 93.08 | 93.08 | 95.91 | 95.28 | |
| ( | - | 0.95 | 0.93 | 0.93 | 0.96 | 0.95 | |
| 72 | WL (g) | 1.76 | 0.36 | 0.22 | 0.1 | 0.32 | 0.13 |
| CR (mm/yr) | 0.43 | 0.09 | 0.05 | 0.02 | 0.08 | 0.03 | |
| IE(%) | - | 87.5 | 94.32 | 81.82 | 92.61 | 79.55 | |
| ( | - | 0.88 | 0.94 | 0.82 | 0.93 | 0.80 | |
| 96 | WL (g) | 2.11 | 0.5 | 0.45 | 0.28 | 0.38 | 0.31 |
| CR (mm/yr) | 0.39 | 0.09 | 0.08 | 0.05 | 0.07 | 0.06 | |
| IE(%) | - | 78.67 | 86.73 | 81.99 | 85.31 | 76.30 | |
| ( | - | 0.79 | 0.87 | 0.82 | 0.85 | 0.76 | |
| 120 | WL (g) | 3.74 | 0.41 | 0.35 | 0.32 | 0.48 | 0.35 |
| CR (mm/yr) | 0.55 | 0.06 | 0.05 | 0.05 | 0.07 | 0.05 | |
| IE(%) | - | 90.64 | 91.44 | 87.17 | 90.64 | 89.04 | |
| ( | - | 0.91 | 0.91 | 0.87 | 0.91 | 0.89 | |
WL (g), CR (mm/yr), IE(%) (76.303-96.610%) and θ (0.76303-0.96610) ranges showed that MBZ effectively protected MS in H2SO4. This was due to MBZ molecules and atoms adsorption onto the MS test coupons surface, which formed a surface barrier coating against H2SO4. MS low CR and WL values obtained by gravimetric measurements (Fig. 1) was due to IE(%) and θ relatively high values for MBZ, because of its ringed structure with N and O heteroatoms, and nonbonding π-electrons 30,53. These hetero-atoms and free-electron sites enabled MBZ adsorption onto the MS surface, providing it with enough corrosion resistance.
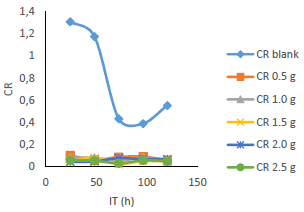
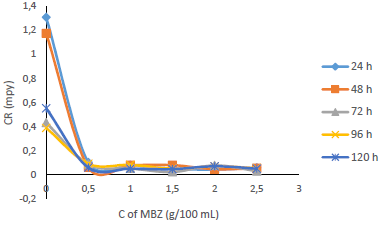
CR values of MS in 0.5 M H2SO4 were substantially reduced with its higher IT and C of MBZ, due to the inhibitor molecules action on the alloy surface (Figs. 3 and 4). CR was the lowest (0.024667 mm/yr), after 72 h IT of MS in the H2SO4 solution with 1.5 g/L MBZ. MBZ highest IE(%)was 96.610% for MS in 1.5 g/L H2SO4, with 24 h IT. MBZ was particularly successful as CI on MS in 0.5 M diluted H2SO4, as proven by the fact that CR and WL of the latter were much lower in the solution with the former than in the one without it.
WL (Fig. 5), for MS in 0.5 M H2SO4 without and with MBZ, in varying C, was remarkably reduced when the latter was added to the corrosive solution. On a close inspection, WL of MS decreased to a maximum, with higher C of MBZ, and longer IT, before maintaining a near-constant value, and then it slight increased. The test without MBZ recorded the highest WL and CR values for MS during its IT.
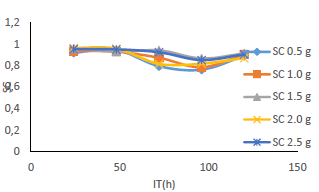
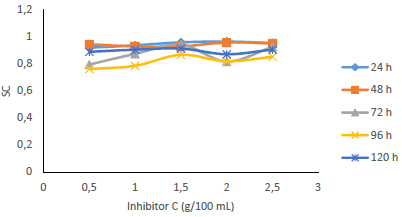
Fig. 6 revealed a marked reduction in WL, as C of MBZ was increased from 0 to 2.5 g/L, for all the considered IT. MBZ successfully decreased the CR of MS in H2SO4 to a minimal level. The plots of CR, IE(%) and θ against IT and C, as shown in Figs. 3, 4, 7-10, revealed a similar trend.
Fig. 7 shows that IE(%) decreased with higher IT, but remained above 70% for all IT, and increased with growing C of MBZ (Fig. 8).
Figs. 9 and 10 show that MBZ protective thin film provided enough coverage of the MS surface in H2SO4, throughout the IT, significantly reducing active corrosion sites.
Electrochemical measurements
PDP measurements
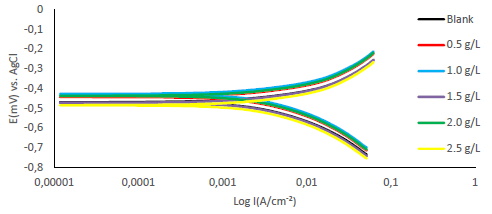
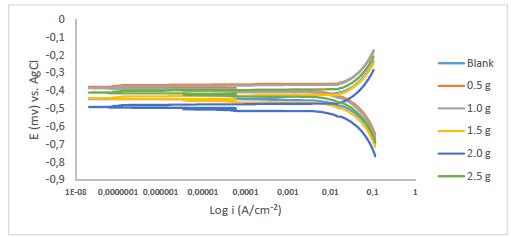
Fe anodic breakdown to Fe2+ is thought to be the cause of MS corrosion in aggressive acidic environments 54-56. Using Tafel extrapolation/polarization measurements, the effect of MBZ various doses on MS anodic dissolution, and on the related cathodic reduction of H ions during the corrosion process, was determined. MBZ addition to the H2SO4 solution moderately changed anodic and cathodic half-reactions, as seen by Tafel plots in Figs. 11 and 12.
Tafel curves extrapolation yielded PDP values shown in Tables 2 and 3. MBZ addition resulted in Ecorr huge displacement, as it can be seen in the tables. For all C of MBZ, anodic and cathodic Tafel constants were available. This suggests that MBZ is a mixed-type inhibitor. According to the overall polarization data, the trial without MBZ exhibited the highest CR. PDP test revealed that MBZ had a significant impact on the electrochemical process that led to the corrosion reaction. In addition, differences in the cathodic and anodic Tafel constants between the H2SO4 solution without and with MBZ indicate that redox reactions connected with the corrodent were impeded by the thin film formed by the inhibitor 18. The development of an adherent protective coating, and MBZ adsorption onto the MS surface, can be linked to the inhibitor corrosion IE(%) 18,35,57,58. Icorr values for the tests with MBZ and without it reinforce this conclusion (Tables 2 and 3). Since Ecorr displacement obtained in the test without MBZ (Tables 2 and 3) was less than 85 mV, at 303 and 333 K, it was deduced that it functioned as a mixed-type inhibitor, based on PDP data 30,59.
Table 2: PDP values for MS in 0.5 M H2SO4 without and with different MBZ C at 303 K.
| MBZ C (g/L) | Icorr (mA) | Ecorr (mV) | CR (mm/yr) | IE(%) | (a (mV) | (c (mV) |
| 0.0 | -3.352 | -470.939 | 24.779 | - | 198.367 | 123.246 |
| 0.5 | -179.323 | -442.306 | 1.3254 | 94.651 | 130.587 | 89.324 |
| 1.0 | -103.823 | -437.697 | 0.76734 | 96.903 | 121.614 | 67.34 |
| 1.5 | -155.868 | -452.045 | 1.152 | 95.351 | 122.923 | 80.257 |
| 2.0 | -136.153 | -437.823 | 1.0063 | 95.939 | 131.168 | 76.031 |
| 2.5 | -138.462 | -464.284 | 1.0234 | 95.870 | 124.738 | 91.449 |
Table 3: PDP values for MS in 0.5M H2SO4 without and with MBZ in different C, at elevated T (333 K).
| MBZ C (g/L) | Icorr (mA) | Ecorr (mV) | CR (mm/yr) | IE (%) | (a (mV) | (c (mV) |
| 0.0 | -34.01 | -440.497 | 251.37 | - | 400.406 | 351.646 |
| 0.5 | -12.06 | -396.102 | 89.136 | 64.540 | 317.637 | 173.616 |
| 1.0 | -563.79nA | -422.048 | 0.0041669 | 99.998 | 83.216 | 129.55 |
| 1.5 | -1.765 | -422.933 | 13.049 | 94.809 | 173.434 | 78.959 |
| 2.0 | -1.66 | -430.981 | 12.274 | 95.117 | 185.951 | 89.983 |
| 2.5 | -1.876 | -419.401 | 13.867 | 94.483 | 214.317 | 67.60 |
Furthermore, H2SO4 solutions with MBZ had lower icorr values than those of the blank ones. MBZ addition reduced cathodic and anodic half-reactions, thus supporting also the inference that it is a mixed type inhibitor 30,36.
At 303 and 333 K, corrosion IE(%) obtained using PDP parameters was slightly higher than that calculated using WL data. At 303 K, 1.0 g MBZ inhibited MS corrosion in H2SO4, with a maximum IE(%) of 99.998%. At 303 K, 1.0 g MBZ gave a maximum IE(%) of 96.903%. The similarity in the corrosion IE(%) values obtained at ambient T, by both gravimetric and PDP techniques, suggest agreement of both methods.
T effect
At 303 and 333 K, T effect on CR and IE(%) was investigated. As a rule of thumb, the rate of a chemical reaction doubles at every 283.15 K increase in T; so, corrosion kinetics, as an electrochemical process, should increase as T rises 32. With MBZ, a modest decrease in IE(%) and an increase in CR were detected at higher T, implying the creation of a physical/electrostatic adsorption coating 60,61. On the other hand, chemisorption occurs when there is an increase in IE(%), a drop in CR with higher T, lower acid C, and decreased Ea rate 60,61. MBZ lower IE(%) and MS higher CR observed in 0.5 M H2SO4 with low inhibitor C, at 333 K, revealed that the critical C of anions required for metals and alloys corrosion protection rose with higher T and aggressive solutions C 53,60,62.
Analysis of adsorption isotherms
The concept of molecular adsorption can be used to further explain CI mechanisms, as it is generally affected by the inhibitor chemical structures, the charge distribution in the molecule, the metal nature and surface charge, and the type of corrosion media 18,61. Evaluation of experimental data obtained with multiple adsorption isotherms is used to determine the most likely method of adsorption. Frumkin’s, Temkin’s, Freundlich’s and Langmuir’s isotherms are the most commonly used adsorption models for researching the inhibition mechanism of the corrosion process. Based on the given mathematical relations, Kads and G°ads values were calculated (Eqs. 7 and 8). The adsorption isotherms characterize the inhibitor molecules interactions with the active corrosion sites on the metal surface 5, and give more information on the CI mechanism. In this study, Temkin’s and Langmuir’s adsorption isotherms were investigated to determine MBZ adsorption mechanism onto the MS surface. With a linear graph, near unity slopes (1.0423 and 0.969) and R2 values of 0.9999 and 0.9839, at 303 and 333 K, Langmuir’s adsorption isotherm provided the best and most suitable description of MBZ behaviour, confirming its constituents adsorption onto the corroding MS surface. The interactions of the adsorbate species with the MS surface, as well as variations in Qads with increasing θ, can be attributed to the modest departure of the slopes and R2 of the Langmuir’s plot from unity 63. The linear form of the Langmuir’s adsorption isotherm given in Eq. 7 was used to plot the adsorption isotherm provided in Fig. 13.
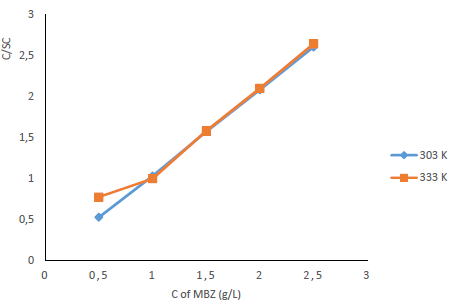
Figure 13: Langmuir’s adsorption isotherms for MS in 0.5 M H2SO4 with various C of MBZ, at 303 and 333 K.
The change in ΔG°ads was obtained using Eq. 8:
where R is the universal gas constant (8.314 kJ−1/mol−1) and 55.5 is the molar C (mol/L−1) of water in the solution. Kads and ΔG°ads values were obtained at various T and MBZ C (Table 5). High Kads and negative ΔG°ads values were obtained for MBZ molecules, which implies their effective and spontaneous adsorption onto the MS surface in 0.5 M H2SO4. ΔG°ads magnitude is a decisive factor in the adsorption process. Physisorption is generally associated with ΔG°ads values around -20 kJ·mol-1 and below, while chemisorption is attributed to ΔG°ads values around -40 kJ·mol-1 and above 5,7,9,32,35. ΔG°ads estimated values for MBZ varied from -15.4720 to -18.7870 and from -14.6965 to -18.0345 kJ/mol-, at 303 and 333 K, respectively, as shown in Table 4.
Table 4: ΔG°ads, θ and Kads calculated for MBZ in 0.5 M H2SO4.
| T (K) | MBZ C (g/L) | ΔG°ads (kJ/mol-1) | Kads (mol-1) | θ |
|---|---|---|---|---|
| 303 | 0.5 | -18.7870 | 35.3902 | 0.94651 |
| 1.0 | -18.4818 | 31.2893 | 0.96903 | |
| 1.5 | -16.4303 | 13.6703 | 0.95350 | |
| 2.0 | -16.0665 | 11.8037 | 0.95939 | |
| 2.5 | -15.4720 | 9.2852 | 0.95870 | |
| 333 | 0.5 | -14.6965 | 3.6402 | 0.64540 |
| 1.0 | -15.5749 | 4.9990 | 0.99998 | |
| 1.5 | -18.0345 | 12.1538 | 0.94809 | |
| 2.0 | -17.4214 | 9.7396 | 0.95117 | |
| 2.5 | -16.4471 | 6.8503 | 0.94483 |
This indicates that MBZ adsorption process was physisorption. As T and C of MBZ were increased from 303 to 333 K and from 0.5 to 2.5 g/L, respectively, ΔG°ads and Kads values decreased; a similar pattern was described in the literature 27,32.
SEM analysis
Figs. 14a and b show micro-analytical pictures of MS specimens before and after corrosion, with and without MBZ.
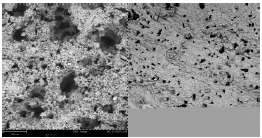
Figure 14: SEM surface morphology of MS specimens after gravimetric experiments in H2SO4: (a) without MBZ and (b) with MBZ.
The blank H2SO4 solution corroded the MS surface (Fig. 14a), which has a significantly deteriorated morphology, with obvious and deep macro and micro pits. Due to MBZ corrosion IE(%)on MS, Fig. 14b depicts a transition to a relatively smooth surface shape.
DFT studies
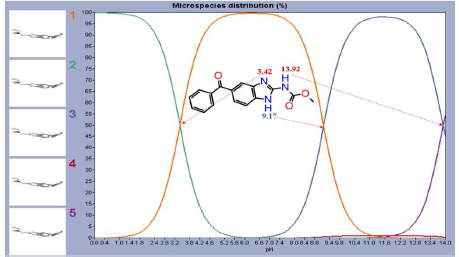
DFT-based structural analysis can be used to assess C7H6N2 carbamate MBZ derivative reactivity. Δ, EHOMO, ELUMO and N110 are considered good overall indices for assessing MBZ IE(%) of MS surfaces corrosion 64. In acidic media, protons are assumed to be present, making the protonation of organic molecules more likely. The most critical protonation site is displayed in Fig. 15, and MBZ had no active protonation site in acidic Ph, for fixing H+ to a pH of 3.42.
Thus, it was assumed that the molecule was stable at the acidic pH used in this experiment, as assessed by Marvin View software. At an acidic pH (pHexp of 0.5 M H2SO4 is pH = -log(0.5) = 0.301), MBZ had no protonation state, which means that the only neutral form remained in the solution. This is beneficial, because several experiments have shown that the protonation form of the molecule is not absorbed.
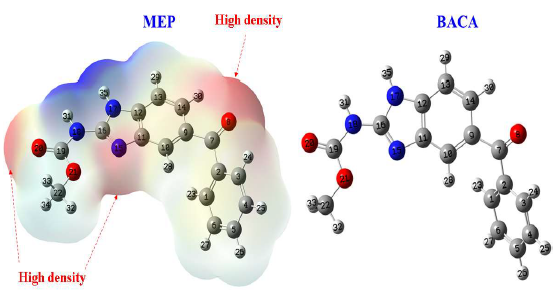
MBZ molecule optimal configurations and molecular electrostatic E distribution are shown in Fig. 16. The most stable and energy-efficient systems are interconnected systems. The average density (red colour) of MEP distribution is centred on O atoms of carbonyl groups; O8 atom has several electrons in this circumstance, facilitating the sharing phenomenon with the vacant iron orbitals 65.
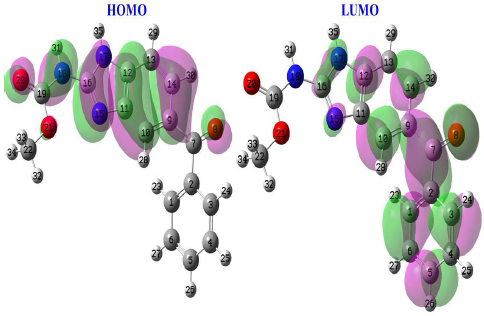
The distribution of electron density in molecular frontier orbitals (HOMO and LUMO) is described as global reactivity, as seen in Fig. 17, where HOMO electron density can be found on any chemical surface, except on the phenyl group linked to the carbonyl function. This demonstrates that MBZ contains a large number of active electron donor sites throughout the skeleton. LUMO electron density is represented over a wide section of the compound surface, except for the phenyl group, implying considerable adsorption of this substance onto the metal surface. EHOMO high value (-5.4754 eV) for MBZ indicates that it can effectively exchange electrons with empty spaces on the metal surface. This means that MBZ-metal is highly reactive. MBZ positive value of ΔN, but less than 3.6 (Table 5), means that it can release and share its electrons 66-68. O (O8 and O20) and C7H6N2 ring electron cloud are the active centres in MBZ, and they are responsible for this electron sharing behaviour. The µ descriptor interprets the polarizability of the chemical compounds under investigation; high polarizability (reactivity), i.e. strong adsorption of the inhibitory molecule onto the metallic surface, is shown by a high value of this descriptor 69.
Local reactivity is a popular strategy for determining the local active areas of a chemical inhibitor 70.
Tables 5 and 6 show the chemical structure descriptors and calculated Fukui indices of simplified functions (f+ and f-) for MBZ, respectively.
Table 5: Descriptors of MBZ molecule chemical structure.
| Complex | ELUMO | EHOMO | µ | Δ | ΔN |
|---|---|---|---|---|---|
| MBZ-Fe | -2.1135 | -5.4754 | 4.9782 | 3,3619 | 2.5744 |
Table 6: Fukui indices for MBZ f+ k and f- k measured at DFT/GGA/DNP.
| Atom | f + k | f - k | Atom | f + k | f - k |
|---|---|---|---|---|---|
| 1 C | 0.16820 | -0.12004 | 12 C | -0.15573 | 0.22856 |
| 2 C | -0.13104 | 0.11047 | 13 C | 0.16297 | -0.09522 |
| 3 C | 0.13203 | -0.06242 | 14 C | 0.21594 | -0.07532 |
| 4 C | 0.08012 | -0.06134 | 15 C | 0.34829 | -0.19004 |
| 5 C | 0.08959 | -0.01851 | 16 C | -0.18038 | 0.28582 |
| 6 C | 0.09187 | -0.06577 | 17 C | 0.46978 | -0.47136 |
| 7 C | 0.07746 | 0.08726 | 18 N | 0.27686 | -0.22970 |
| 8 O | 0.03460 | 0.11203 | 19 C | -0.02668 | 0.06965 |
| 9 C | -0.10926 | 0.08992 | 20 O | 0.06293 | 0.00204 |
| 10 C | 0.32256 | -0.18432 | 21 O | -0.00853 | 0.01471 |
| 11 C | -0.13117 | 0.12038 | 22 C | 0.31706 | -0.31829 |
Fig. 18 shows the condensed atom Fukui functions, while Tables 5 and 6 show the chemical structure descriptors and calculated Fukui indices of simplified functions (f+ and f-) for MBZ. Atoms with higher f- and f+ values are electrophilic and nucleophilic active centres, respectively 71. The findings show that O(8) atom underwent electrophilic assaults, indicating that it was prone to supply electrons, forming more stable coordination bonds with the metal surface. During nucleophilic assaults, atoms like C(10), C(12) and C(16) will accept electrons from the metal surface.
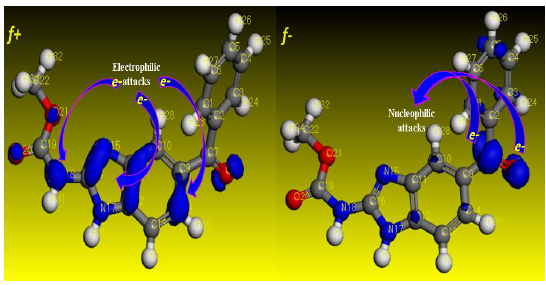
Figure 18: MBZ atom-condensed Fukui functions for f+ k and f- k estimated at DFT/GGA/DNP, using Material studio software.
Electronic conduct of Fe-MBZ complex
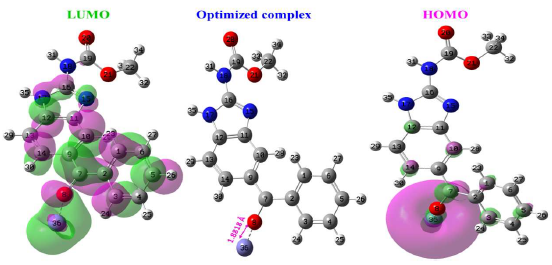
Fe-MBZ complex was investigated using DFT method, to see how the metal surface affected the inhibitor electron density distribution and quantum chemical descriptors. The chemical quantum computing was done with the Gaussian 09 software, and DFT was done on the B3LYP/LanL2DZ level. Fig. 19 shows Fefrontier-molecular MBZ orbitals, optimized structure and electronic density distribution.
There was no visible change in spatial conformation for MBZ optimized structure coupled to the Fe atom, when compared to its structure alone. As a result, Fe and O atoms are at the core of HOMO mass (O8). HOMO high density on the Fe atom indicates that it has received electrons from the inhibitor, resulting in a decrease in MBZ electronic density. LUMO, on the other hand, is almost on the complex structure. Therefore, the result for MBZ alone is the same. Hence, MBZ electron donor property to Fe atom was improved. Table 7 groups key quantum chemical descriptors values. Fe iron atom had a favourable impact on overall chemical reactivity, according to the results in this table. A drop in Δ and an increase in ΔN and µ values demonstrated this. These findings show that MBZ and Fe surface communicated effectively.
Table 7: Chemical structural descriptors for Fe-MBZ complex.
| Complex | EHOMO | ELUMO | µ | Δ | ΔN |
|---|---|---|---|---|---|
| MBZ-Fe | -3.5793 | -1.3926 | 11.4998 | 2.1866 | 1.06739 |
MD modeling
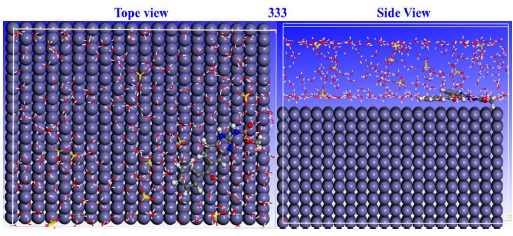
When the adsorption mechanism at the MBZ-metal interface was studied, theoretical modelling methods concentrated on MD simulation 72. When the inhibitor adsorbed onto the adsorbate, the fluctuation energies and T curves (303 and 333 K) were in equilibrium, as shown in Figs. 20 and 21, which illustrate top and lateral views of MBZ adsorption configurations on MS surface in H2SO4, at 303 and 333 K.
MBZ structure is visible on the initial Fe surface, indicating that the inhibitor molecule was firmly adsorbed. This could be due to the presence of covalent bonds at the MBZ-Fe (1 1 0) contact, which positively modified the adsorption behaviour.
This technique maximized θ qualities, by adsorbing the C7H6N2 derivative. Indeed, this species is a powerful CI, confirming IE(%) findings of the experimental studies. Energy concepts, explicitly, Ebinding and Einteraction, were used to express the simulation findings. The magnitude of MBZ adsorption and contact with the MS surface was determined by the values of these terms. Negative touch energy projections confirmed MBZ-metal contact capabilities 73. At 303 and 333 K, corresponding Einteraction values for MBZ were -536.33 and -694.53 kcal/mol, respectively.
Results of optimization by RSM
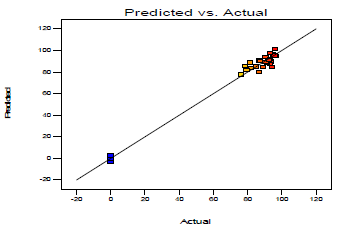
WL, CR, IE(%)and θ were all affected by inhibitor C and IT, according to the results of optimization research. Figs. 22, 23 and 24 illustrate MBZ IE(%) on MS in 0.5 M H2SO4. Fig. 22 shows a linear graph of anticipated versus real IE(%), suggesting that the design model was adequate for predicting MBZ inhibition 50.
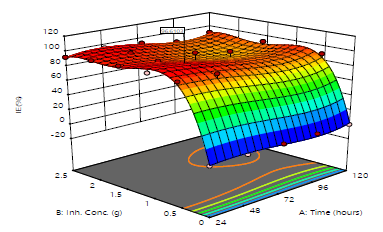
IE(%) level of reliance for MBZ C and IT was demonstrated by the 3-D surface plot (Fig. 23).
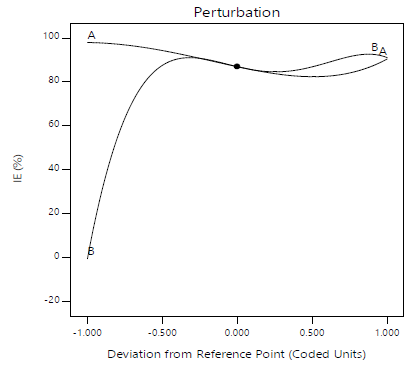
3-D surfaces structure suggests that, throughout the CI process, there were considerable interactions between the evaluated factors and the response variables. Fig. 24 shows a perturbation plot that can be used to compare the effects of various parameters on IE(%), at different points in the design space. Only one element changed over the response range, while the other remained constant. For all factors, the reference point was set by default to the midpoint (coded 0). This can be altered to any desirable point (perhaps the optimal run conditions). A component with a steep slope or curve implies that it is sensitive to the response. The response variable is insensitive to changes in that particular component, if the line is reasonably flat. The perturbation plot demonstrates the element that has the most impact on the response. IE(%) of MBZ was more responsive to its C (B) than to IT (A), in this case.
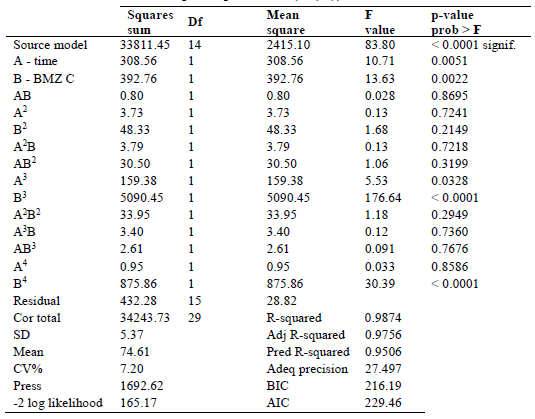
Eq. 9 provides a predictive model Eq. of MBZ IE(%), as a function of the components evaluated in terms of factors coding. The quartic model Eq. represented the link between IE(%) and independent parameters, such as MBZ C (B) and IT (A). For given levels of each factor, the model Eq. written in terms of factor coding can be used to predict the response of the dependent variable. By default, the high values of the components are recorded as +1, while the low levels are coded as -1. By comparing the factors coefficients, the relative impacts of the elements can be determined using the coded Eq. 50.
Table 8 contains a summary of the design parameters. F-value of 83.80 suggests a significant model, according to ANOVA results in Table 9. Due to noise, such high
F-value has a 0.01% probability of occurring. Model terms that have a value of prob > F less than 0.0500 are considered significant. A, B, A3, B3 and B4 are the model significant terms in this example. Insignificant model terms are indicated by values greater than 0.1000. Since the difference is smaller than 0.2, pred. Rsquared of 0.9506 is in reasonable agreement with adj. R-squared of 0.9756. These values are quite close to unity, indicating that the model was well-fit 74. The signal-to-noise ratio is measured using adeq. precision. A signal-to-noise ratio of more than 4 is always preferable. The research yielded a signal-to-noise ratio of 27.497, indicating that the signal was strong, and that this model may be utilized to navigate the design space effectively.
Numerical optimization result
Table 10 presents the optimal solutions found to suitably satisfy the target optimization goals set for the factors and the responses after numerical optimization.
The optimization report reveals that a minimum inhibitor C of 1.061 g/L was required, for 48 h IT, in order to obtain an optimal IE(%) of 96.61%, with near-unity desirability (0.879).
Conclusions
WL measurements, PDP techniques, design optimization, DFT and MD modelling were used to study MS corrosion and its inhibition in 0.5 M H2SO4. Based on the analysis and interpretation of the findings, the study concluded that:
According to the findings of the Tafel polarization investigation, MBZ acted as a mixed type CI, and its adsorption onto the MS surface followed Langmuir’s isotherm.
MBZ, at C of 1.061 g/L, exhibited an optimal IE(%) of 96.610% in 0.5 M H2SO4, after 48.58 h.
MBZ is highly efficient for MS surface CI in H2SO4.
DFT and MD studies show that increasing T improved MBZ IE(%), and that its adsorption onto the MS surface was proportional to T, corroborating the findings on T effect and molecular adsorption sections.
A quartic predictive model Eq. accurately illustrated the reliance of MBZ IE(%) on the investigated independent elements of the inhibition process in the operational environment.
Acknowledgement
The authors gratefully recognize the Tertiary Education Trust Fund (TETFund), Nigeria, for its financial support of this study under the Institution Based Research (IBR) Interventions.
Authors’ contributions
F. O. Edoziuno: conceived and designed the analysis; conceptualized ideas; performed the experiment and analysis; analyzed data; wrote the paper- developed some sections of the manuscript. B. U. Odoni: performed gravimetric experiments; wrote the paper - developed some sections of the manuscript. A. A. Adediran: conceived and designed the analysis: conceptualized ideas; offered key intellectual support, assessed and appraised the manuscript. S. Byadi: performed the analysis-MD simulation; analyzed data; wrote the paper - developed some sections of the manuscript. A. Barhoumi: performed the analysis - MD simulation; and analyzed data; wrote the paper - developed some sections of the manuscript. C. C. Nwaeju: assisted in the predictive modelling, optimization, edition of the manuscript and plagiarism test. L. U. Modebe: offered key intellectual support, assessed, reviewed and appraised the manuscript. J. O. Okeniyi: performed the analysis; offered key intellectual support, assessed, reviewed and appraised the manuscript.
Abbreviations
AgCl: silver chloride
AIC: Akaike information criterion
ANOVA: analysis of variance
BIC: Bayesian information criterion
C7H6N2: benzimidazole
C: concentration
CCD: central composite design
CE: counter electrode
CI: corrosion inhibition/inhibitor
CR: corrosion rate
CV: coefficient of variation
Df: degree of freedom
DFT: density functional theory
DNP: double numerical plus polarization
Ea: activation energy
Ebinding: binding energy
Einteraction: interaction energies
Ecorr: corrosion potential
EDXS: energy dispersive X-ray spectroscopy
EHOMO: energy of the highest occupied molecular orbital
ELUMO: energy of the lowest unoccupied molecular orbital
G°ads: standard free energy of adsorption
H2SO4: sulphuric acid
icorr: corrosion current density
IE(%): inhibition efficiency
IT: immersion time
Kads: adsorption equilibrium constant
MBZ: mebendazole (methyl-5-benzoyl-2-benzimidazole: C7H6N2 carbamate derivative)
MD: molecular dynamics
MEP: molecular electrostatic potential
MS: mild steel
N110: height of transmitted electrons
PCM: polarized continuum model
PDP: potentiodynamic polarization
Qads: heat of adsorption
R2: determination coefficient
redox: reduction and oxidation reactions
RE: reference electrode
RSM: response surface methodology
SCRF: self-consistent reaction field
SD: standard deviation
SEM: scanning electron microscopy
T: temperature
WE: working electrode
WL: weight loss
Kinetic parameters
(a: Tafel anodic slope
(c: Tafel cathodic slope
Δ: energy gap
ΔG°ads: Gibb’s free energy of adsorption
∆N: fraction of transferred electrons
µ: dipolar moment
ηFe: metal hardness
ηinh: inhibitor hardness
(: degree of surface coverage
∅: job function
χinh: inhibitor electronegativity


