Introduction
Corrosion is the deterioration of a material, especially metal, in an unfavorable environment 1. Generally, corrosion involves the decrease in valuable content of metals or alloy structures, to a point where they can no longer support the applied load. Corrosion is usually influenced by water and O presence, and could be either electrochemical or chemical 1,2. The main factor in any corrosion process is the environment, which is complex and susceptible to change over time and prevailing conditions. Metals are majorly used in industry, and their installation costs are high, but corrosion decreases the life span of these materials. The struggle to hinder corrosion effects on metallic materials has advanced greatly with the use of different protective measures, especially environmental modifications, metals selection and surface conditions 2,3. The prompt availability, Pc presence (N, S and P) and low cost of organic CI (plants) has motivated literature to continually research them and prove their properties 3-4. Similar assertion has been provided by 5, in their experimental and quantum chemical studies on tizanidine CI of E24 CS in oil field acidizing solutions. Among the various methods to avert or prevent metal surfaces destruction or degradation, CI are one of the best-known and successful methods of protection in the industry 4,6. Organic CI enable the formation of a protective film through their Pc atoms adsorption onto a metal surface. CI adsorption displaces water from the metal surface and protects it against deterioration, as previously reported by 6. Inhibitors can slow corrosion processes, through an increase in (a or (c polarization, which originates chemical reaction products on a galvanic/voltaic cell in the electrodes vicinity. This decreases ions movement or diffusion towards the metallic surface, which increases its resistance to current flow and electricity, and frequently reduces the cell EMF 5-7. Surface chemistry generally defines adsorption as the attraction and retention of molecules in a solid or liquid, which results in higher Ct of molecular species at their surface than in their core 8-10.
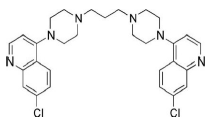
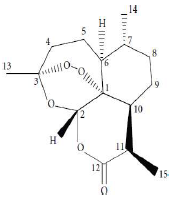
ATS molecular formula, molar mass, density and IUPAC name are C15H22O5, 282.332 g/mol, 1.24 g/cm3 and (3R,5aS,6R,8aS,9R,12S,12aR)-octahydro-3,6,9-trimethyl-3,12-epoxy-12H-pyrano(4,3-j)-1,2-benzodioxepin-10(3H)-one, respectively. ATS structure is shown in Fig. 1(11-13). PPQ is available as a base and as a water-soluble tetraphosphate salt. Its chemical formula, molecular mass and IUPAC nomenclature are C29H32Cl2N6, 535.51 g/mol and 1,3-bis(4-(7-chloroquinolin-4-yl) piperazin-1-yl) propane, respectively. PPQ is a white to pale yellow crystalline power, readily soluble in water, slightly bitter, sensitive to light, and its mp is from 246 to 252 ºC. PPQ structure is shown in Fig. 2 14.
The aim of this study was to investigate ATK mains components (ATS and PPQ) IE(%) on A36 MS corrosion surface active sites, define the inhibitor adsorption mechanism, and ascertain its Td and kinetic properties, using computational and electrochemical methods.
Materials and methods
Metal treatment and inhibitor preparation
The drug (an anti-malarial), sold under the trade name Artequick®, was obtained from Peaceland Pharmaceutical Shop, Calabar-Nigeria, and used without further purification, at a ratio of 1:6. ATK was weighed, powdered to fine particles size. and dissolved in a 1000 mL volumetric flask with 1 M HCl. The solution was filtered after 24 h, and different ATK Ct (150, 250, 500, 600 and 750 ppm) were prepared for the corrosion test.
Tests were performed on A36 MS coupons with the following composition by wt%: 98.35 Fe, 1.03 Mn, 0.04 P, 0.28 Si, 0.05 S and 0.25 C. MS was obtained from a heavy duty shop in Calabar, Nigeria. The MS coupons were resized to dimensions of 2 x 0.08 x 4 cm, mechanically ground with 220, 800 and 1200 emery grade paper (using a UNIPOL-820 metallographic polishing machine), washed in distilled water, degreased in ethanol, rinsed in acetone, air dried, and then stored in a desiccator.
Gravimetric technique
CR of MS and IE(%) of ATK were tested by the WL method, in which different inhibitor Ct were measured into a 100 mL volumetric flask. The treated MS coupons were immersed by suspension in HCl. Initial IT was taken, and, after every 1 h, MS was removed, washed, degreased, rinsed, air dried, and then weighed using an ADAM PGW 253e electronic digital balance. This process continued for 6 h. Data generated from WL experiment were used to calculate CR and θ of MS, and IE(%) of ATK, using Eqs. 1 and 2.
where WL0 and WLi are WL for MS in 1 M HCl without and with ATK, respectively.
Tm technique
The same WL method was adopted here, except that the beakers were immersed in a Tm water bath (MEMMERT WNB-14), at regulated T of 298, 308, 318 and 333 K. After 60 min, MS was removed, washed with fast flowing distilled water, degreased with ethanol, rinsed in acetone and air-dried, before weighing. The same experiment was conducted with ATK, at Ct of 150, 250, 500, 600 and 750 ppm. Data generated from the trial were used to obtain CR and θ of MS, and IE(%) of ATK, as shown in Eqs. 3 and 4.
where Ԓ 0 and Ԓ i are CR for MS in 1 M HCl without and with ATK, respectively.
EIS technique
EIS test was carried out at 303 K, in a three-electrode cell, using a Gamry 600 potentiostat/galvanostat, coupled with Gamry EIS300 framework. Echem Analyst software was used for data analyzing and fitting. The frequency range was from 100 kHz to 0.01 Hz, and AC signal amplitude was 10 mV. A Pt electrode was used as CE, SCE was used as RE and the WE was a MS exposed surface of 1 cm2. Measurements were performed in an aerated solution, after 30 min (1800 s) IT in the test solution, at ambient T, in order to attain a steady state OCP. Nyquist plots derived in ATK absence and presence were used to obtain some useful kinetic parameters, including Rct. IE(%) of ATK was calculated from its Rct, according to Eq. 5.
where Rct0 and Rcti represent Rct without and with ATK, respectively.
PDP technique
PDP tests were performed at 303 K, using a potentiostat, and data were analyzed using Echem Analyst. PDP curves were measured at a SR of 0.5 mV/s, from -0.25 to +0.25 V vs SCE. (a and (c, for MS dissolution in 1 M HCl, with and without ATK, were recorded. Their segments were extrapolated from the plots, which gave useful Td parameters. Icorr was used to calculate IE(%) of ATK, according to Eq. 6.
where I corr 0 and I corr i represent Icorr obtained without and with ATK, respectively.
SEM
SEM, model number JSM-5600 LV, from Tokyo, Japan, was used to produce micrographs of MS coupons immersed in 1 M HCl without and with ATK. Selected coupons were retrieved from the test solution (containing 750 ppm ATK, at room T), after 168 h IT. Each sample was mounted on a metal stub, and sputtered with gold, in order to make it conductive. Scanned micrographs were taken at an accelerating voltage of 2 and 15 kV.
Computational details
This study was performed using DMol3 code of Material Studio software (BIOVIA, USA). In this study, ATS and PPQ were sketched, H molecules were adjusted, and the compounds were cleaned using a sketch tool available in the material visualizer. Sketched ATS and PPQ were optimized using geometry optimization, in order to relax the atom positions, and try to find the optimum bond angle and length. ATK geometry calculations were done in the gas phase, using medium SCF tolerance. DFT optimization involved GGA, with PBE function, and the double numerical basis set, with d-functions on H atoms (DND), and the basis file set to 4.4. The convergence tolerance energy was set to 2.0e-5 Ha or 5.4e-4 Ev, with maximum force of 0.004 Ha/Å, and maximum displacement of 0.005 Å. The iteration was set at a max of 100, using a max step size of 0.3 Å. No symmetry was used during optimization. The surface was cleaved using a {1 1 1} plane on the (h k l) plane, respectively. Thereafter, the surface fractional thickness was increased to 4, which is equivalent to 9.352 Å. The vacuum slab crystal was built with vacuum thickness set to 20 Å, with orientation at C. The lattice maximum range for A, B and C was set to 4, 4 and 1, respectively. The super cell was created (the lower two layers were constrained) with the maximum range parameters. The bond was monitored for all elements, with a length tolerance from 0.6 to 1.344, and the lattice style was left unchanged. It is noteworthy that the lattice lengths used were 16.5138 (A), 16.5311 (B) and 26.9627 Å (C). The bond angle was 90 °, for α and β, and 60.0566 ° for γ. The lattice type used was 3D triclinic. Absolute χ, η, μ, σ, ω and δ were calculated using the output generated from EHOMO and ELUMO, with IP and EA, according to Eqs. 7-11.
Results and discussion
Gravimetric (WL) results
Table 1 shows values obtained from WL data analysis. The results show that MS corrosion was strongly inhibited by ATK, of which higher IE(%) was 90.2%. MS corrosion was inhibited through ATK molecules adsorption onto its surface, which arose from their hetero-atoms and structural positioning, as earlier reported by 3,15. This was also attributed to Fe (a transition metal) higher percentage, which allowed for variable oxidation states and formation of a stronger metal-ligand complex 2,15-16. The bonding and ease of electrons transfer between MS and ATK molecules gave rise to their higher stability through adsorption onto the alloy surface. This optimized CI of MS by ATK 6,9,18. CR of MS was lower in the HCl solution with ATK (19.3 mg/cm2/h) than in that without it (197.6 mg/cm2/h), especially with higher inhibitor Ct. This indicates an initial disturbance of HCl at its interface with MS, in ATK absence. Thus, HCl removed loosely held atoms from the MS surface, and caused anodic tendency for oxidation and subsequent corrosion 18-20.
Tm analysis results
In response to ΔH effect on ATK viability, following its IE(%) in WL results for MS, Tm data were obtained for the inhibitor, as shown in Table 2. The results showed ATK physical nature of adsorption. ATK lower IE(%), with high T, as seen with CR of MS in Table 2, does not only indicate a physical adsorption process, but also explains the loosely bounded inhibitor molecules elimination, due to agitation by heat. Similar results have been reported by (15). The desorption process was not too significant since, even, at 333 K, IE(%) of ATK was 70.8%, as against 81.1%, at 298 K. This shows that, although ATK protected the MS surface better at higher T, it still acted at lower ones, which was due to the inhibitor molecules stronger adsorption onto the alloy surface 21-22. The results are in agreement with those of WL.
Electrochemical results (EIS and PDP)
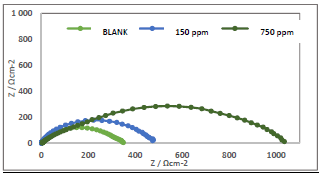
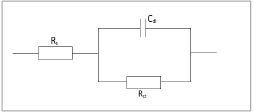
Nyquist plots and its corresponding equivalent circuit cell diagram are shown in Figs. 3 and 4, respectively.
High frequency loops with corresponding increased semicircles were obtained, which indicates stronger CI with higher Ct 4,18,23-24. Cdl and IE(%) of ATK were determined from Eqs. 12-14 20 (Table 3).
where Z” is impedance imaginary component and ω is angular frequency. Hence:
where fmax describe the semicircle max frequency and π is 22 7 .
where R ct 0 and R ct i are Rct values in HCL solutions without and with ATK, respectively. From Table 3, Rct data were found to increase with Ct, which confirmed the retardation of electrons transfer from the MS anodic sites trough ATK molecules adsorption onto the alloy surface. This also confirms MS decreased CR and ATK increased IE(%), as earlier reported by 3,15. Decreased Cdl values were observed, which indicated separation, by ATK, of the electronic and electrolytic charges at the MS-HCl interface. This, in turn, led to CI of MS by ATK 19,25-26.
Table 3: EIS parameters for MS in 1 M HCl without and with ATK, in varying C.
| Ct (ppm) | Rs (Ω cm2) | Rct (Ω /cm2) | Fmax (Hz) | Cdl (μF/cm2) | IE(%) |
|---|---|---|---|---|---|
| Blank | 1.14 | 346 | 11.93 | 0.39 | - |
| 150 | 2.03 | 577 | 7.52 | 0.42 | 40.0 |
| 750 | 3.95 | 1153 | 3.75 | 0.28 | 70.0 |
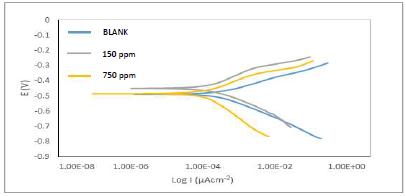
Fig. 5 depicts Tafel plots.
The plots show divergence towards both anode and cathode sites, implying a mixed type phenomenon, as demonstrated in the works of 20,26 (Table 4). However, icorr values decreased while IE(%) increased. This implies that the current produced in the electrochemical cell decreased, while corrosion was occurring. This process is explained by ATK molecules strong adsorption onto MS anodic sites, which slowed down electrons transfer from the anode to the cathode, with higher inhibitor Ct 27-30.
Table 4: Tafel plots theoretical analysis results for CI of MS by ATK, in 1 M HCl.
| Ct (ppm) | βa (V/decade) | βc (V/decade) | Icorr (μA) | Ecorr (mV) | CR (mpy) | θ | IE(PDP%) | Rp (Ω) |
|---|---|---|---|---|---|---|---|---|
| Blank | 0.0605 | 0.1030 | 312.2 | -533.5 | 142.7 | - | - | 52.74 |
| 150 | 0.0814 | 0.1158 | 156.1 | -450.4 | 48.7 | 0.50 | 50 | 132.88 |
| 750 | 0.0658 | 0.1831 | 62.4 | -485.7 | 26.0 | 0.80 | 80 | 336.49 |
Quantum chemical calculations
EHOMO and ELUMO were employed to calculate global quantum chemical indices using Eq. 15 31. In general, for a good CI with strong energy, EHOMO value should be high, while ELUMO and ∆E values should be low.
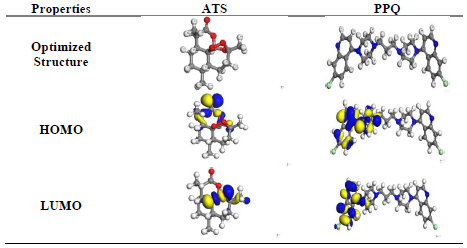
Fig. 6 shows FMO EDD of HOMO and LUMO, for ATS and PPQ.
Fig. 6 shows that EDD at HOMO was strongly located on the heteroatoms, and in the carbonyl group (C=O) present in ATS. However, EDD at LUMO was on the O stereogenic centers and, therefore, IE(%) of ATS can be explained by the π electrons and free doublet of O heteroatoms, which favored electrons sharing between the inhibitor and the MS surface 32-34. As for PPQ, it is symmetrical, and its location was on one part of the molecule. EDD, at HOMO, was deeply located on the double bonds of the aromatic benzene ring and N heteroatoms. LUMO location was on the individual C atoms on the aromatic ring, heteroatoms and Cl atom as substituent. PPQ high IE(%) was linked to the donating power of π-electrons and heteroatoms present in the aromatic ring, while the electron withdrawal properties were due to the halogen substituent (Cl) present in the compound 31,34-36.
Table 5 shows quantum chemical parameters for ATS and PPQ. IP values were obtained as EHOMO negative values, using Eq. 16 33. Similarly, organic compounds electrons accepting ability, corresponding to EA, which was represented as ELUMO negative value, was calculated from Eq. 17 36.
ΔN was also calculated from Eqs. 18 and 19.
where φm is the work function for the Fe (110) surface (4.82 eV), χi represents absolute χ, and ηm and ηi represent global η for MS and inhibitor, respectively. ∆Eb-d was investigated using Eq. 19.
When ( or ∆Eb-d < 0, the latter, from the inhibitor to the metal surface, is energetically favored. From Table 5, ∆Eb-d for PPQ and ATS is -0.149 and -0.455, respectively. ∆Eb-d of PPQ was more negative than that of ATS, which means that the first compound was energetically favored 30-35. The observed order for ∆Eb-d (PPQ > ATS) also suggests that PPQ is a better CI than ATS, for MS. It was also observed that EHOMO value of ATS was lower than that of PPQ, which means that the former was less prone to donate electrons to the MS surface. ELUMO higher value for PPQ means it is less prone to accept electrons from MS. Therefore, PPQ has more electrons donating ability to MS, and it is a better inhibitor 34-38. This can be verified from PPQ lower ΔE value (1.189 eV) than that of ATS (3.64 eV), which suggests that it has better polarization and CI properties 33-35.
Table 5: Quantum chemical parameters for ATS and PPQ.
| Inhibitor | EHOMO | ELUMO | ΔE (eV) | IP (eV) | EA (eV) | χ (eV) | ( (eV) | ( (eV) | ω (eV) | δ (eV) | ΔN | ∆Eb-d |
|---|---|---|---|---|---|---|---|---|---|---|---|---|
| ATS | -5.35 | -1.71 | 3.640 | 5.349 | 1.709 | 3.529 | 1.820 | 0.550 | 3.421 | 0.292 | -0.1 | -0.5 |
| PPQ | -5.61 | -4.42 | 1.189 | 5.605 | 4.416 | 5.011 | 0.595 | 1.681 | 21.10 | 0.047 | -1.5 | -0.2 |
Generally, particles with high ∆E are hard molecules, whereas those having low ∆E are referred to as soft ones 33-35. Hard molecules are less reactive than soft ones. Thus, from Table 1, ATS is less reactive than PPQ, which makes the latter a better inhibitor than the former. However, ΔN was found to be less than 0 for both CI. This implies that they were able to transfer their electrons to MS, and that their IE(%) increased with enhanced electron-donating ability to the alloy surface 30,32.
Local reactivity
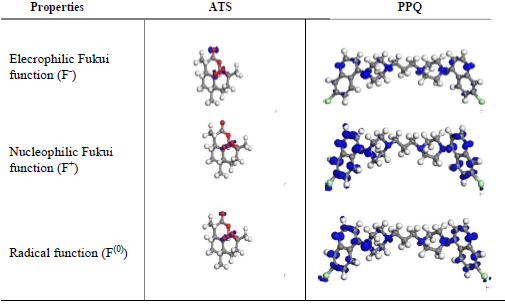
In order to examine the influence of the heteroatoms on IE(%), local reactivity was analyzed by evaluating Fukui indices (Fig. 7).
Three different types of Fukui functions, F(0), F- and F+, were examined. Condensed Fukui functions were calculated by using the finite difference scheme from atoms MPA in the inhibitor molecules. Results obtained for the Fukui functions of the molecules atoms are shown on Fig. 6.
Obtained data revealed that, for ATS, C (12), C (10) and C (13) were most prone to attack by an electrophilic site. Thus, they likely would donate electrons in the order of C (12) >C (10) >C (13). O (16), O (15) and O (19) were most prone to attack by a nucleophile site. Therefore, they would likely accept electrons in the order of O (16) > O (15) > O (19) 29-33.
It is noteworthy that O (16)-O (15) > O (19) = C (9) (i.e., O to O single bond had stronger inductive effect than O to C double bond), for the nucleophilic site, while O (11) -C (12)-O (15) > C (10)-C (9) = O (19) > C (14)-C (13)-C (12). This was due to O, which pulled electrons from the nearby C atom, thus depleting it for the electrophilic charge site 35. Fig. 6 also confirms that the surface was highly concentrated at O (16) and O (15) atoms, which acted as the most reactive site of ATS molecule for donor-acceptor interactions.
For PPQ, it was observed that Cl (7) had the highest positive atomic charge of 5.9, while C (23) had the highest negative charge of -1.2. Cl (7), Cl (37) and N (8) were most prone to attacks by the nucleophilic. Thus, they would likely accept electrons in the order of Cl (7) > Cl (37) > N (8), while C (23), C (13), C (25) and C (17) were most prone to attacks by the electrophilic site. Therefore, they would likely donate electrons in the order of C (23) > C (13) > C (25) ≡ C (17) 9,12,19-21.
From Fig. 6, it is clear that C (23)-N (24) ≥ C (13) -N (12) > C (25)-N (24) ≡ C (17)- N (12), majorly because of PPQ symmetry. The isosurfaces are highly concentrated on heteroatoms and C atoms in the phenyl ring. Thus, these were the most reactive sites of the molecule for donor-acceptor interactions 28-30,35.
Td consideration
Eq. 20, which is the Arrhenius Eq., was deployed in Ea calculation.
where k is the rate and A is the collision factor, while other constants remain the same, as conventionally known. From Table 6, Ea values in HCl with inhibitor were higher than in that without it, and also increased with higher Ct. This could be due to the CR slowing down, because of the inhibitor adsorption onto the MS surface 22-24, which agrees with WL results in Table 6, and shows ATK reliability as CI of MS 3-4,9.
Table 6: Td data for MS corrosion in 1 M HCl without and with ATK, in varying C.
| Ct (ppm) | Ea (kJ/mol-2) | R2* | ΔH (kJ/mol-2) | - ΔS (kJ/mol-2) | R2** |
|---|---|---|---|---|---|
| Blank | 7.77 | 0.9891 | 7.89 | 0.96 | 0.9971 |
| 150 | 8.87 | 0.9842 | 8.87 | 0.93 | 0.9982 |
| 250 | 9.47 | 0.9881 | 9.70 | 0.99 | 0.9995 |
| 500 | 9.29 | 0.9884 | 8.91 | 0.62 | 0.9988 |
| 600 | 12.94 | 0.9926 | 10.62 | 0.72 | 0.9912 |
| 750 | 16.88 | 0.9945 | 14.67 | 1.33 | 0.9960 |
*R2 for Ea; **R2 for entropy change
An increase in the collisions led to higher CR. From values in Table 6, it was found that the pre-exponential factor increased with higher inhibitor Ct, which suggested a stronger ATK-MS reaction, due to molecular collision 4-6,11. The transition state Eq. for ΔH and ΔSads determination is as follows:
where k is reaction rate, kB is Boltzman constant and h is Plank constant. Table 6 presents negative ΔS values, which imply an increased inhibition, due to the system reduced degree of randomness that allowed for ATK molecules stronger adsorption 3,9,15-17. ΔHads values less than 80 Kj/mol-1 and positive represent a physical adsorption mechanism and an endothermic reaction, indicating bond breaking around the corrosion sites 5,17. ΔGads values in Table 6 were negative and less than -20 kJ/mol-1, implying ATK physical adsorption, spontaneity of reaction and high stability 19-21. These results showed strong agreement with gravimetric analysis.
Adsorption
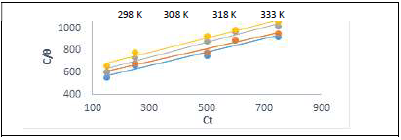
Metallic CI by organic compounds is attributed to: either the inhibitor molecules adsorption onto the metal surface; or to the formation of a layer of an insoluble complex, such as the oxide film, on the metallic surface, which acts as a barrier between the metal and the aggressive medium 9-15. The relationship between IE(%) and the bulk inhibitor C, at constant T, known as isotherm, gives an insight into the system adsorption process 2-5. In order to investigate the adsorption mechanism, Langmuir’s isotherm was employed and determined from Eq. 22-24, respectively.
Table 7 and Fig. 8 show that k values in the solution with ATK were lower than in that without it, which explains a physical adsorption phenomenon 12-17, confirming the results dependent from T, as already shown in Table 2. This result also indicates that stronger bonds between ATK and MS were possible, leading to CI 12,17,22. R2 values showed that Langmuir’s assumption was obeyed, which implies monolayer adsorption 1.
Table 7: Langmuir’s isotherm and its Td parameters for MS in 1 M HCl, at various T.
| T | 298 K | 308 K | 318 K | 333 K | ||||||||||||
| k | -ΔG | slope | R2 | k | -ΔG | slope | R2 | k | -ΔG | slope | R2 | k | -ΔG | slope | R2 | |
| Langmuir’s | 0.95 | 5.31 | 0.65 | 0.98 | 0.98 | 5.70 | 0.63 | 0.97 | 0.97 | 5.87 | 0.71 | 0.98 | 0.98 | 6.28 | 0.93 | 0.95 |
SEM
SEM micrographs of MS before and after immersion in 1 M HCl, without and with ATK, show that the inhibitor hindered corrosion. This was because the MS surface was less damaged (Fig. 9c) than of that before and after immersion in 1 M HCl (Figs. 9a and b).

Figure 9: Micrographs of MS corrosion: (a) before immersion; (b) after immersion in 1 M HCl; and (c) after immersion in 1 M HCl + 750 ppm ATK.
This implies that there was no anodic dissolution and no possible cathodic HER, hence, less corrosion attack 33-34. 750 ppm ATK in 1 M HCl formed a protective layer that filled up the corroded MS surface. It is clear that ATK inhibited MS corrosion, which agrees with results obtained from gravimetric and Tm studies.
Conclusions
It was concluded that ATK was a good alternative inhibitor (IE(%) = 90.2) against A36 MS corrosion caused by anodic dissolution and cathodic HER. PPQ presence in ATK improved its IE(%), which was due to the close ∆E and donating power of the π-electrons and heteroatoms present in the aromatic ring, and to the electron withdrawal properties related to the halogen substituent (Cl) present in the compound. Electrochemical results showed mixed type inhibition, with decreased Cdl, for effective adsorption. Simulation analyses showed ATK high IE(%),which confirms the experimental essay. SEM revealed a less damaged MS surface in ATK presence, which indicates the formation of an effective protective layer by the inhibitor on the metal surface.
Authors’ contributions
B.U. Ugi: designed the research work; performed the experimental work; carried out data analysis and interpretation. E. C. Omaliko: was involved in the material and sample collection and preparation; performed the experimental work; carried out data analysis and interpretation. M. E. Ikpi: performed the experimental work. All authors read and reviewed the manuscript.
Abbreviations
Å: pertinent distances
AC: alternating current
ATS: artemisinin
ATK: Artequik® (mainly composed by artemisinin and piperaquine)
ASTM: American Society for Testing Materials
Ct: concentration
Cdl: double layer capacitance
CE: counter electrode
CI: corrosion inhibitor/inhibition
Cl: chlorine
CR: corrosion rate
CS: carbon steel
DFT: density functional theory
DNP: double numeric plus polarization
Ea: activation energy
EA: electron affinity
EDD: electron density distribution
EHOMO: energy of the highest occupied molecular orbital
EIS: electrochemical impedance spectroscopy
ELUMO: energy of the lowest unoccupied molecular orbital
EMF: electromotive force
FMO: Frontier molecular orbitals
GGA: generalized gradient approximation
Ha: Hartree
HCl: hydrochloric acid
HER: hydrogen evolution reaction
Icorr: corrosion current density
IE(%): inhibition efficiency
IP: ionization potential
IT: immersion time
IUPAC: International Union of Pure and Applied Chemistry
k: equilibrium constant
mp: melting point
MPA: Mulliken population analysis
MS: mild steel
OCP: open circuit potential
PBE: Perdew-Burke-Ernzerhof
Pc: phytocompounds
PDP: potentiodynamic polarization
PPQ: piperaquine
R2: determination coefficient
Rct: charge transfer resistance
RE: reference electrode
Rp: polarization resistance
SCE: saturated calomel electrode
SCF: self-consistent field
SEM: scanning electron microscopy
SR: scan rate
T: temperature
Td: thermodynamic
Tm: thermometric
WE: working electrode
WL: weight loss
Symbols definition
(a: Tafel anodic slope
(c: Tafel cathodic slope
δ: neucleophilicity
ΔE: energy gap
∆Eb-d: back donation energy
ΔGads: adsorption free energy
ΔH: heat of adsorption
ΔHads: enthalpy of adsorption
ΔN: fraction of electrons transfer
ΔSads: entropy of adsorption
η: absolute hardness
(: surface coverage
μ: chemical potential
σ: softness index
χ: absolute electronegativity
ω: electrophilicity index


