


 Inglês (pdf)
 Artigo em XML
 Referências do artigo
 Enviar este artigo por email
 Citado por SciELO
  Similares em
SciELO
Similares em
SciELO 
 Permalink
Introduction
University dropout is considered polysemous and a highly complex concept. Consequently, the phrase ‘dropout rate’ does not fully define the phenomenon since it ignores a set of conditions beyond the number of students not enrolled in the faculty, thus limiting their analysis and restricting the concept of dropout to contextual interpretations (Acevedo 2021).
Varying points of view have addressed factors influencing university dropout rates. In a review of dropouts in Latin America and the Caribbean, Munizaga et al. (2018) found 111 different variables associated with the phenomenon. These variables were grouped into five factors related to individual, academic, economic, institutional, and cultural characteristics. The individual factors were the most predominant, which, according to the authors, highlighted the need to improve the mechanisms of vocational assignment. Alternatively, academic and institutional factors have suggested the need to introduce changes, e. g., in the study plan, to satisfy the requirements of the new students. Regarding the Chilean universities, Miranda and Guzmán (2017) pointed out that the most outstanding variables in terms of dropout are the socioeconomic variables. These include the university admission score (PSU, the Spanish acronym) and the high school mean grades (NEM, the Spanish acronym), showing a positive causal relationship between the scores obtained on the individual PSU math tests, the PSU language test, and university academic performance. These findings coincide with the results published by the National System and Information of Higher Education in Chile (SIES, 2016) and a Peruvian university (Yamao et al. 2018).
In Chile, a student’s academic record includes variables such as sex, place of origin, date of birth, NEM, PSU in mathematics, PSU in language, and mean PSU. This data set is unique for each student in the corresponding term; consequently, it is not efficient to refer such values for the same student during the different years. Therefore, the possible correlations can only be valid between new students per semester.
Iam-On and Boongoen (Iam-On and Boongoen 2017) suggest that student retention should be addressed from the first year of studies. Early detection of vulnerable students could lead to successful strategies to help avoid student dropout. However, studies addressing academic terms separately would provide isolated and inefficient information. Accordingly, the continuous study of dropouts is advisable if more relevant information is required.
Establishing a predictive model that incorporates the entire period under study (time of the professional career) through simple Decision Trees would lead to statistically biased patterns since limitations due to the sample size per year do not remain constant. Thus, to obtain more robust predictive models, a study of the entire period (in years) is proposed using Survival Analysis tools, which allows establishing a measure of the probability of permanence for each student based on their academic viability (called survival function) Survival function is considered the starting point (dependent variable) of the corresponding Decision Tree that allows for establishing more efficient behavior patterns and, finally, ajusted by using Random Forest to determine the most influential variables among those considered.
In accordance with this study, an intelligent prediction model is proposed based on a combination of robust statistical tools, allowing the early identification of students vulnerable to university dropout. Thus, this approach shows the most outstanding mathematical aspects of the metaheuristics used, followed by a description of the sequential procedure. Finally, a case from a Chilean university is illustrated using the method proposed herein.
Educational data mining as a basis for a dynamic predictive approach
Educational Data Mining (EDM) is a discipline applied to educational problems with the aim of extracting information in search of patterns and relationships between variables, supported by methods that include data mining (Data Mining), computational learning, psychometrics, statistics, information visualization, and computational modeling (Agrusti et al. 2019; Feng et al. 2022). Currently, various algorithms have been applied to solve academic problems, among which Decision Trees and Random Forest, frequently used in classification problems, stand out. Thus, Dekker et al. (2009) incorporated the Machine Learning philosophy in the construction of Decision Trees to model student success, obtaining results with an accuracy of 75 and 80%. More recently, Pérez-Gutiérrez (2020) mentioned Random Forest as the most efficient algorithm in his comparative studies using ROC curves, the study of the rate of true positives based on the rate of false positives.
In relation to survival analysis, this method applies in longitudinal designs that measure the "life or failure" time in which an event of interest takes place from a predetermined initial point. One of the benefits of this method is its adaptability to specific conditions of the sample under study. From an academic point of view, it allows establishing behavior patterns adjusted to the reality of each institution that leads to real solutions (Kleinbaum and Klein 2012). In addition, other possible lines of study are opened, such as the re-entry of students after abandonment or the difference between retention and persistence (Torrado Fonseca and Figuera Gazo 2019).
There are few studies where this type of design is used for dropout problems. Among these is the study by (González et al. 2014). The generalized beta distribution was adjusted as a survival model in the study of university dropouts at the specific time of completion or dropout of each subject. Thus, since this study considered academic dropout as a dynamic case, it was taken as the basis for our proposal, since it proposes a modeling scheme adjusted to the reality of each case study in terms of the variables considered. In this way, given the philosophy and power of the metaheuristics used, the proposed methodology can be perfectly extrapolated to any educational instance under the variables it considers pertinent in terms of its own academic reality.
Then, based on this dynamic approach, our methodological proposal begins with a Survival Analysis to provide the Decision Tree, as a modeling algorithm, with probability values for each subject considered in the sample. This will allow the algorithm to conduct a more robust search for classification patterns and, subsequently, achieve the efficient determination of the most important variables for both survival and dropout risk using the Gini index provided by the Random Forest methodology.
For all the above and for a better understanding, this session aims to briefly introduce the reader to the basic theoretical context of the methods used in our methodological proposal.
Survival analysis
Various statistical analysis methodologies are available, and their use depends on the specific objective outlined. However, the use of such methodologies could exhibit limitations mainly when the event to be studied only occurs in a part of the sample. such methods are not as direct since there is no common data distribution and, even more so, when the observations are extended over time (longitudinal designs). For this type of situation, survival analyses are the most recommended. The term survival refers to the time that elapses until an event of interest, for example, the time elapsed until recovery from a particular illness. In fact, this type of analysis is commonly used and known in the Health Sciences, where a starting condition is established for each patient, and follow-up is continued for a certain time until the occurrence of the required event (or not) (Hastie et al. 2009).
This type of analysis focuses on determining both the Survival Function and the Hazard Function, also known as the conditional failure rate (hazard rate). the objective of the former being to determine the probability that a subject survives a given determined time. At the same time, the second serves to determine the proportion of cases that present the event at a given time over the number of cases that arrive at that time (Kleinbaum and Klein 2012).
It is essential to define three fundamental concepts in survival analysis. First, are the start and end dates of the study, since not all subjects enter the study on the same date, while the observation time of each subject is the same in quantity: months, days, years, etc. In addition, other key information to determine is the date of the last observation, which may or may not coincide with the closing date of the study. As for the object of study considered in this proposal (dropout), an extreme example is considered. The observation of eight children in their initial school stage (five years) is made and that, for various reasons, all leave the institution before the fourth year. Note that in the example, the closing date is the fifth year, but the last observation is made in the fourth year. In the opposite case, suppose that the eight children finish the fifth year. They are considered censored data since none of them presented the event of interest "dropout". This, then, defines the survival function as the probability of non-dropout (survival) of the subjects under study, constituting the starting point of our methodological proposal. To delve into the more specific concepts of survival analysis, the reader would benefit from reviewing the contribution of Kleinbaum and Klein (2012).
Two models are mainly recognized in Survival Analysis: the parametric and the semi-parametric. The former makes assumptions about the risk of the event of interest occurring in the population to which the sample under study belongs, focusing on specific distributions such as Weibull, for example Kleinbaum and Klein (2012). Semi-parametric models are not based on initial assumptions but are estimated from the available data, making the estimation more precise, with the Cox and Kaplan-Meier models being the most frequently used. Specifically, the Kaplan-Meier estimator is commonly used for right-censored data under the expression:

Where are the number of individuals at risk and  the number of subjects who present the event of interest (dropout); both measurements over time?
Decision trees
In general, Decision Trees are methods that seek to determine a subject classification function under the variables considered (Bramer 2016). In the case of our study variable, dropout, the objective was to establish classification variables that allow each new student to be classified as a possible “dropout” or not, taking the most influential variables as criteria. Therefore, we introduce the reader to the methodology from its theoretical beginning based on the bibliographic review carried out by Villa-Murillo et al. (2012).
Suppose a categorical variable Y with values at a point  and another variable Χ defined as the set of all values of the vector X of predictor variables. Then, the objective will be to build a classification rule that assigns to each observation
  Χ one of the classes of C, where the optimal classification rule is the one that maximizes a posteriori probability:
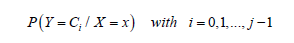
That is, each observation denoted as Χ is assigned the class that provides the highest posterior probability. This rule, based on decision theory, divides Χ into j disjoint regions.
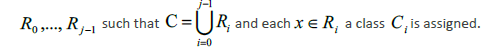
In general, the algorithm is based on the recursive partitioning of the vector of predictor variables Χ into disjoint regions called nodes and on the assignment of a class to each of the regions resulting from the segmentation process. Thus, the root node that represents the entire sample is divided into subgroups determined by the partition of a predictor variable, thus generating new nodes. The process is repeated iteratively until some stopping condition is met, where nodes that do not split are defined as terminal nodes. Figure 1 illustrates the process described for  , where the region
  represents the root node, which is divided by
 into the regions
  and the terminal node
  , and so on until the regions and are create (Breiman et al. 1984).
Then, this prediction process consists of 3 regions, giving rise to the prediction model, with the constant , as follows:

Since its inception, Decision Trees has had several applications, however, these have been questioned for their sensitivity to overfitting, especially when they are established under the Machine Learning philosophy since slight changes in the Training and test sets can cause disturbances in established patterns driving different classification rules. That is why Breiman (2001) combines resampling techniques with classification trees to stabilize the Random Forest process, described below.
Random Forest
Random Forest (RF) is based on the construction of prediction trees, which is combined with the Bootstrap and Baggin methods to reduce sensitivity. In general, with RF, a large number of trees are generated using Bootstrap samples with replacement to correct the prediction error that results from the selection of a specific sample, as well as to have an independent sample (out-of-bag) for each tree, which allows estimating the classification error caused by the exclusion of one-third of the original sample from each sample generated by Bootstrap (Breiman 2001).
For each split of a node, instead of selecting the best variable, a random selection is made from a set of variables of preset size, restricting the selection of the split variable to this set. In this way, a greater variability of trees is included, and the dependence of the result on the previous divisions is reduced.
The out-of-bag (OOB) process uses the training set T to create k Bootstrap training samples Tk. Trees h(x;Tk) are built, and the average of them will be the bagged predictor. Subsequently, for each (y; x) of T, the trees are built in each Tk that do not contain (y; x), that is, the samples that were left out of the Bootstrap samples, these being the OOB classifiers that will allow estimating the classification error on the set T. The OOB samples are also used in RF to calculate the prediction strength of each of the variables used, called the importance of the variables, which is conditioned to their interaction with the rest of the variables.
RF calculates two different measures of importance: MDA (Mean Decrease Accuracy) and MDG (Mean Decrease Gini). Our proposal focuses on MDG, calculated from the Gini index as a criterion to select the variable of each partition in the construction of the trees, given that categorical variables are used in the proposal. Thus, the measure of the importance of a variable will be measured as the sum of the decreases attributed to that variable and the MDG value will correspond to the mean in all the trees. Other theoretical advantages are attributed to this index, which constitutes a mathematical review that is not part of the scope of this article; however, the reader would benefit from consulting (Kubat 2017).
It is essential to highlight that this methodology does not provide a graphic representation of the prediction patterns but rather establishes a ranking of the importance of variables predicting the response variable (Bramer 2016). Therefore, in this proposal, the method allows us to generalize regarding the variables with the most significance on dropout. Thus, the proposed methodology goes through the determination of the prediction scheme ending with the establishment of the most essential variables among those considered.
Finally, the use of RF in our proposal is based on its virtues, among which the reduction of dependency between trees in the determination of nodes through the random selection of sets of predictors in each tree stands out (Hastie et al. 2009; Segal 2004; Siroky 2009). However, under the recommendations of Breiman (Breiman 2001), we have previously optimized the hyperparameters: entry (number of variables to choose in each node), node size (number of minimum observations to be considered in the terminal nodes), and tree (number of trees needed to assemble). The latter is for the purpose of saving computational resources.
2. Proposed methodology
A predictive model is proposed in three phases based on the combination of Survival Analysis, Decision Trees, and Random Forest, under the philosophy of Machine Learning. All analyses were programmed and performed using R language (R Core Team 2018). In the first phase, the Survival Function is established, using the Kaplan-Meier estimator, in which the response variable analyzed is the time until abandonment occurs (academic dropout). In the second phase, the estimated survival factor is incorporated as a segmentation variable for the Decision Tree (predictive model) under the Machine Learning approach, which will allow determining the patterns that characterize the risks of survival/dropout in terms of the variables considered in this stage. Finally, Random Forest was used to evaluate the importance of the variables intervening in the model.
Phase 1: Estimation of the survival function
The survival function is estimated to be incorporated as a segmentation variable in the predictive model based on Decision Trees. The methodology is described below.
Prepare the data set, establishing the start and end dates of the study, the date of the last observation, and the type of censorship.
Considering that the proposed methodology addresses the dropout problem, the Kaplan-Meier estimator is suggested since, among its properties, it allows working with right-censored data. The response variable to be analyzed corresponds to the time until abandonment occurs.
As an additional step, the study of survival curves is suggested, considering that the dropout problem may have a different dynamic depending on careers and/or faculties.
Phase 2: Predictive model using decision trees
The objective is to establish patterns (prediction models) regarding the variables that the variables that characterize the risk of academic dropout by adjusting decision trees. It is suggested to do the study under the Machine Learning philosophy to evaluate the model using the corresponding confusion matrix. The methodology is described below.
Coding of the Survival Function in intervals that allows the decision tree to establish patterns according to the dropout problem;
Determination of the training and test sets as part of the Machine Learning philosophy;
Establishment and evaluation of the predictive capacity of the model through confusion matrices. If necessary, the parameter Cp (tree complexity) must be evaluated for pruning or not.
Phase 3: Determination of the importance of the variables using Random Forest
In this phase, the aim is to extend the model established in the previous phase and provide it with the robustness provided by Random Forest to determine the variables that have the greatest influence (importance) on dropout. To do this, it is necessary to start the process by optimizing the mrty, nodesize and ntree hyperparameters defined in phase 2. Thus, the methodology in this phase consists of the following steps:
Optimization of the hyperparameters of the model
Random Forest setting
Determination of the Gini index for the importance of variables
The schema complete of our proposed predictive model is illustrated through of the following flowchart (Figure 2).

3. Case study
Descriptive phase:
The data set used is made up of 1769 records from a Chilean university that correspond to data on new students in 2013 who were followed up in the period 2013-2018. This record has the following variables:
PSU in Language, PSU in Mathematics, Mean PSU: correspond to the PSU grades in language, mathematics, and mean (average), respectively
Nem: Qualifications in secondary education
Sex
Career: Grouped by School
Day: Day (D) and Evening (F)
Previous data made it possible to verify the dynamics of each school and/or university career, in terms of admission conditions and the length of stay of the students because of the duration of the different careers.
Phase 1: Estimation of the survival function
Data processing:
The variable survival time (Table 1) is created, which denotes the survival time of each subject, expressed in periods (years). Time 0 corresponds to the start of the observation process. Therefore, it is the start time of the career by the student; thus, for example, a subject with survival time= 3 will denote 3 completed years of studies, that is, from 2013 to 2016.
Table 1 - Codification by survival time
The variable was created, where the permanence was considered as the censored data.
Using an initial sample consisting of eight faculties, the corresponding survival times were compared using the log-rank test. Significant differences were observed in the survival times per faculty (log-rank test, p=0.004). Thus, aiming establishment models that lead to more realistic conclusions, the faculty carried out the modeling process, while the proposal illustration was made considering results corresponding to the Faculty of Health Sciences.
Study of survival curves
The figure 3 shows the survival curves by career, of which the Occupational Therapy career (OccupTherapy) obtained the highest survival rates.

During this phase, discrepancies between careers were not made with the aim of establishing behavior patterns in the modeling phase. However, within the framework of our methodological proposal, it is suggested to pay attention to the average survival times (median) to apply the corresponding remedies by faculty. In this case, the Kinesiology course shows the lowest survival value (Table 2).
Table 2 Median survival times per faculty
| Career | n | Events | Median | 0.95 LCL | 0.95 UCL |
|---|---|---|---|---|---|
| Nursing | 160 | 98 | 4.5 | 4 | 5 |
| Speech Therapy | 85 | 59 | 4.0 | 3 | 5 |
| Kinesiology | 102 | 80 | 2.0 | 2 | 3 |
| Nutrition and diet | 58 | 43 | 3.5 | 2 | 5 |
| Odontology | 100 | 69 | 3.0 | 2 | 5 |
| Medical technology | 64 | 41 | 4.5 | 2 | 5 |
| Occupational therapy | 45 | 24 | 5.0 | 4 | 5 |
At the end of this phase, the variable  (Survival Function) was created using the Kaplan-Meier estimator for each subject under study, which will serve as the starting point for establishing the predictive model.
Phase 2: Adjustment of the Decision Tree
Model established in phase 1 provides an estimate of the survival time per student based on the variable  , so it was grouped and codified. In effect, was grouped into intervals and the midpoint was considered representative of each class defined as low, medium, and high survival probability level. Thus, the variable
  was defined as shown in Table 3.
Table 3 Survival time codification
| Interval | Mean point | Level |
|---|---|---|
| [0, 0.45) | 0.45 | Low |
| [0.45, 0.75) | 0.60 | Medium |
| [0.75, 1] | 0.88 | High |
Following the Machine Learning philosophy, the dataset was separated into two subsets: training, to adjust the model; and testing to evaluate the model through the confusion matrix.
The adjusted Decision Tree shows the PSU scores in language (PSU.Language) as the main segmentation variable, followed by the variable PSU.Math (Figure 4). Each rectangle represents a node, to which a color was assigned according to survival class. At each node, the proportion of pooled data and the proportions of data in the respective survival classes (high, medium, low) are summarized. For example, the second node is mostly characterized by a "high survival" (57%) with 10% of representativeness in all cases, i.e., 57% of correct predictions in students with a PSU grade. Language lower than 550 and PSU.Math less than 450 have a high probability of "survival" (not academic dropout), fulfilled by only 10% of the students in the data set. Conversely, sex, Nem, and Average. PSU variables are not shown as segmentation variables, which is consistent with the profile of the schools involved in this study.
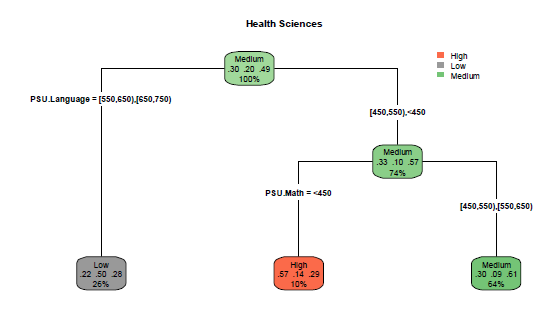
Model validation was made by constructing the confusion matrix and comparing the predictions of the model with the real values, which showed an accuracy rate (Accuracy) of 57.12% (Table 5). This rate is considered as an acceptable level as an illustrative example of the proposed methodology. In this sense, it is recommended to select the variables relevant to the study in order to produce the best representation of the dropout phenomenon according to the academic reality of each institution and/or country.
Phase 3: Adjustment of the Random Forest
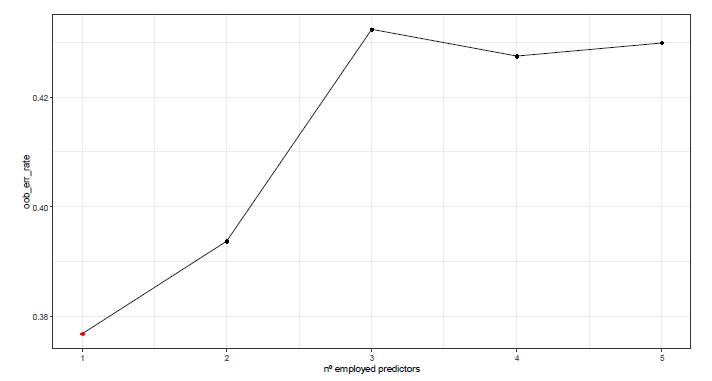
In the final phase, the importance of the variables under study was determined, with the PSU.Language being the variable with the highest incidence. However, for illustrative purposes, the complete process is presented. Before the adjustment of the Random Forest, the so-called hyperparameters (mtry, nodesize, and ntree) were optimized to reduce the model error rate. For this, a graphical study of each hyperparameter against the out-of-bag (OOB) error was considered, as defined in the Random Forest section.
Figure 5 shows the evolution of the OOB error against the number of predictors (variables) used in each entry division. Note that the error increases as this parameter increases. Thus, mtry=1 is defined as the optimal value in the adjustment of our model.
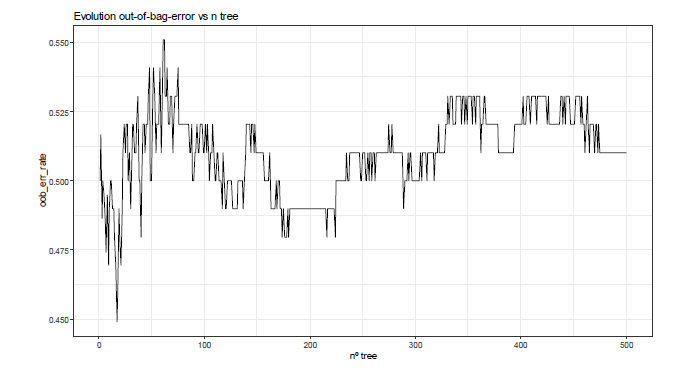
Finally, for computational resources optimization, the study of the number of trees to be assembled (tree) is recommended. Thus, Figure 6 shows that 400 trees are enough to stabilize the algorithm in terms of the OOB error.
After the main hyperparameters were optimized, the Random Forest was adjusted, and the most important variables in the proposed predictive model were studied. Thus, Figure 7 shows the Gini index according to the theoretical recommendations of Kubat (2017), where it is essential to highlight the presence of the variable Nem, which is not reflected in our Decision Tree but it is necessary to be considered. This is one of the strengths of our methodological proposal for predictive purposes since it allows the search for early solutions to avoid or diminish academic dropout.

Conclusion
This study shows a methodological proposal to develop an intelligent prediction model in the context of Educational Data Mining (EDM) to analyze the phenomenon of university academic dropout. This phenomenon was approached from a model under the Machine Learning philosophy that efficiently combines the qualities of Survival Analysis, Decision Trees, and Random Forests.
This methodology allowed differentiation between faculties within the University based on survival times. In addition, the adjusted Decision Tree allowed discrimination between the variables included as possible predictors (sex, high school grades (Nem), and the grades of the university selection tests (PSU) in language, mathematics, and mean). The Decision Tree also identified the PSU scores in language and mathematics (PSU.Lenguaje) as the main segmentation variable.
Even when the proposal was developed considering a particular case of a Chilean University, the efficient combination of metaheuristics allows the extrapolation of the methodology to any academic context. However, the conditions and needs of each institution must be considered. For this reason, it is crucial the study begins with a descriptive analysis of the variables to be considered, according to the academic context of each institution and its background related to the dropout problem.
Finally, the Survival Analysis established probability values for the academic dropout phenomenon as a dynamic issue that can be adapted to the characteristics of each institution. This is considered the starting point of the Decision Tree for establishing patterns and or profiles of the individuals under the variables considered. Ultimately, the proposed methodology suggests the study of the most critical variables by adjusting and optimizing the parameters of the Random Forest, conferring robustness to the algorithm, and minimizing the risk of overfitting typical of Decision Trees. This means that the proposed methodology is adjusted to the academic reality of each institution and thus allows early detection of or establishment of appropriate remedies to the problem of university dropout.

