


 Inglês (pdf)
 Artigo em XML
 Referências do artigo
 Enviar este artigo por email
 Citado por SciELO
  Similares em
SciELO
Similares em
SciELO 
 Permalink
I. Introduction
Until twenty years ago, Turkish society boasted about its young population structure and assumed that its age structure would remain this way. Although Türkiye still has one of the youngest populations in Europe (Kashnitsky & Schöley, 2018), it is now one of the fastest ageing countries in the world (Arun, 2013, p. 297). This is clearly demonstrated by the fact that while the total population of Türkiye increased by an average of 1.3% annually between 2010 and 2020, the country's olderly population increased three times faster than the total population with an annual growth rate of 4.0%. Thus, the olderly population in the country exceeded 8.7 million in 2023 and the national olderly population rate reached 10.2% (Turkish Statistical Institute-TurkStat, 2024). However, ageing in Türkiye appears to have reached advanced levels in many local units (more than 10% of the population of 71% of all districts in the country is olderly) and the structural ageing levels vary over a wide range (between 2.5% and 37.8%). Therefore, the patterns of ageing in Türkiye manifest considerable spatial (regional and local) variations (Yakar & Özgür, 2022).
While ageing has been given attention on a global and national levels for some time, the spatial patterns of ageing on a subnational scale within countries have been less studied (see Stockdale, 2011). In these studies, ageing patterns are generally examined together in a temporal-spatial perspective and analyzed using different methods at different spatial scales (Chen et al., 2019; Gregory & Patuelli, 2015; Han et al., 2018; Káčerová et al., 2014, 2022; Kurek, 2011; Li et al., 2019; Moore & Pacey, 2004). Spatial scale differences are important for interpreting research findings (Lobao, 2004), so examining social and demographic phenomena at small scales is generally suitable for developing and implementing accurate policies at the local level (Goodchild et al., 2000). Statistical or geographical regions have been mostly used in attempts to determine the changing spatial pattern of ageing within a country (e.g. Chen et al., 2019; Cheng et al., 2019; Gietel-Basten et al., 2020; Penev, 2014; Reynaud et al., 2018). While this approach reveals ageing patterns according to regions, it does not allow for the identification of unique ageing regions resulting from the configuration of factors that affect ageing.
Regionalization, as in other areas such as trade, investment, regional development, and policy-making and planning, can also be functional for demographic research. First and foremost, the spatial variations of ageing dynamics determine ageing patterns, exhibiting different regional trends. Although various studies have been carried out on age structure (Behar, 2006; Çavlin et al., 2016; Özgür, 1999), the spatial distribution of ageing in Türkiye (Özgür, 2013; Özgür & Yakar, 2021; Yakar & Özgür, 2022) and temporal change in the spatial pattern of ageing (Şenbil & Yetişkul, 2021), no attempt has been made so far to identify ageing regions by associating the spatial pattern of ageing with various demographic variables. Thus, while distinguishing the ageing regions of Türkiye, we have gone beyond presenting the spatial distribution of the olderly population by associating the olderly population rates with demographic variables such as fertility, migration, and longevity. This feature constitutes the first unique aspect of the article.
Ageing regions are formed by grouping neighboring units that are as proximal/similar as possible in space and placing them in the same cluster based on one or more criteria. This means grouping by distinguishing similarities and differences in patterns and establishing regions by drawing boundaries and determining the spatial distribution of groups. Grouping analysis is a very useful tool for this purpose, and when the spatial dimension is included, it is possible to identify the region and label its character. Although ageing has been mapped with a number of indicators, distinguishing ageing regions with some basic demographic variables that have an impact on the emergence of this manifestation has not been attempted so far. Ageing regions have been distinguished with a multivariate dataset in our study by using cluster analysis integrated with geographic information systems techniques. This is the second unique aspect of the study and makes a methodological contribution to research in ageing. The study aims to develop a regional/local insight into ageing research in social sciences through two unique aspects.
Instead of determining the distribution of ageing according to various types of regions (e.g. geographical or statistical regions) like in many studies (see Chen et al., 2019; Gietel-Basten et al., 2020; Kurek, 2003; Reynaud et al., 2018), this study focuses on establishing ageing regions (regionalization of ageing) by using variables directly related to the dynamics of ageing which adds originality to the study. As Agnew (2018, p. 23) points out, recognizing a particular geographic scale (in this study, the region as a sub-national scale) in relation to a given phenomenon (ageing in this case) that cannot be captured well solely by reference to the state, may allow us to better understand how it operates.
The remainder of the article first presents background information under the heading Key Concepts of Spatial Thinking, followed by the Methodology section including data sources, variables, and analysis technique. This section is followed by the Findings section presenting the Spatial Patterns of Variables Used to Distinguish Turkey's Ageing Regions and Ageing Regions of Turkey, and finally it finishes with the Conclusion and Discussion section.
II. Theoretical background: key concepts of spatial thinking
Theorists purport that social and spatial phenomena are interrelated in a socio-spatial dialectic and that without one, the other would be difficult to understand and the big picture would be lost (Gregory & Urry, 1985). Social processes take place in a space, necessarily have a spatial extension and sometimes a specific spatial configuration of their elements (Sayer, 1992). Space makes itself felt as an important determinant in the production and reproduction of the social. However, space also exhibits a dynamic structure that is shaped, changed and transformed depending on the social. Thus, social processes realize themselves in space and generate their own spatial forms. Various combinations of each of these processes in different spatial units lead to different spatial production and manifest different views of the same social phenomenon. These spatial manifestations also change and transform with the passage of time and are blended again. As a result, in the words of Soja (1989), a socio-spatial dialectic, that is, a reciprocal relationship between the social and the spatial emerges. This relationship allows us to trace the social in space. One of the items on the research agenda of geographical gerontology, which focuses on the relationship between ageing and space, is the manifestation of the geographical distribution of the olderly population and the spatial patterns of demographic ageing. (Andrews & Phillips, 2005; Skinner et al., 2018). Spatial patterns can be empirically demonstrated by mapping and analyzing demographic ageing according to different spatial units and the temporal change in these patterns and ageing transitions can be monitored using data from different years. Furthermore, the acquired spatial distribution patterns can be explained and regionalized by associating them with various variables.
A spatial pattern in the distribution of a phenomenon is defined by the arrangement of individual entities in space and the geographical relationships between them. In general, each pattern is a reflection of the underlying spatial process at a given point in time, which also influences the next stage of the process. In other words, spatial distributions and geographical differentiation are both outcomes of social processes and determinants of the working dynamics of these processes. Therefore, the spatial is not only an outcome but also a part of the explanation (Massey, 1984, p. 4). In this context, assessing any spatial pattern can provide us with a prerequisite for understanding the complex spatial processes underlying the distribution of a phenomenon (Chou, 1995, p. 365). In other words, mapping phenomena and analyzing the spatial patterns of a comprehensive range of social processes and problems can lead to a clearer understanding of them, reminding us once again that phenomena must be considered spatially.
The key concepts of spatial thinking are spatial association, regional differentiation, propagation, pattern detection and spatial interaction (Janelle & Goodchild, 2006, p. 456). Spatial attribution links clusters of knowledge, social processes and problems to geographical coordinates and regions. Thus, for example, maps of the distribution of the olderly population and fertility levels (or other characteristics of the olderly, such as poverty, education, gender, ethnicity, etc.) can be overlaid to see correlations that may suggest clues for further research. Regional differentiation characterizes the results of processes that separate regions and allocate space to different populations and activities. For example, the spatial distribution of the olderly population can play an important role in determining social change and social needs in a given area, and in the development and implementation of relevant local and national policies. Propagation underpins a range of problems at various spatial and temporal scales. For example, cartographic visualization of the ageing process through moving maps can provide us with a way of depicting temporal patterns in the geographical spread. The physical order and clustering of phenomena plays a key role in pattern detection. For example, it can enable us to distinguish whether these ageing patterns emerge randomly or through some underlying relationship between regions and the social and economic conditions around them. Spatial interactions refer to movements between places. For example, it may be possible to understand demographic changes, such as ageing, that alter the demand for social services by analyzing and modeling trends. Results on both spatial association and regional differentiation have been obtained in this study.
As symbols of spatial distribution, maps are the language of observation in geography and can be viewed as tools for expressing spatial thinking. While the locational characteristics of information are often hidden in traditional tables, maps allow the visualization of this information to reveal spatial patterns and temporal changes that are not easily visible in tables (Janelle & Goodchild, 2006, p. 455). The representation of phenomena through maps prepared according to different spatial units allows us to reach different conclusions. The map of ageing regions in Turkey produced in this study offers such an opportunity.
III. Methodology
1. Data Sources and Variables
The dataset of this research consists of the records of the total population, age and gender characteristics of the population, birth and migration at the district level obtained from the Address Based Population Registration System (ABPRS) of the Turkish Statistical Institute (TurkStat) for 2020. These data provided by TurkStat were used by the authors to calculate the structural ageing level (structural ageing-SA) and the proportion of very old population (aged 80 and over) in the old population (aged 65 and over) to represent longevity (very olderly population ratio-VOEPR) , variables consisting of the general fertility rate (GFR) , in-migration ratio (IMR) and out-migration ratio (OMR) were obtained. Demographic factors affecting ageing were analyzed to establish ageing zones with the help of these variables.
A high level of structural ageing in a given area can be considered as a sign of ageing in that area (Atkins & Tonts, 2016; Chen & Hao, 2014; Lutz et al., 2008; Zhang & Chen, 2014). Structural ageing is widely used in the identification, monitoring and comparison of spatial patterns, especially at varying scales (Kiniorska & Pytel, 2022; Kurek 2003; Walford & Kurek 2010; Wilson, 2015; Wu et al., 2019, 2021). The combination of declining fertility and increasing longevity (life expectancy at birth) has led to an increasing number and proportion of older people in many parts of the world (Kinsella & Velkoff, 2001). Thus, total fertility rate and life expectancy at birth are considered to be important indicators of a society's ageing level (Kinsella & Phillips, 2005; Kurek, 2007). Therefore, it is taken as a variable when distinguishing ageing regions. However, the lack of district level statistics on these two indicators in Turkey has made it necessary to produce a new variable referring to longevity (VEPR) and to use the general fertility rate (GFR).
Internal migration is one of the major factors affecting the age structure of the population in a locality. Internal migration has been found to affect ageing by offsetting or even reversing regional differences in birth and death rates (Chen et al., 2020; Moore & Pacey, 2004). As a result of age-selectivity, out-migration usually leads to the departure of young people from an area and leaves older people behind, while in-migration leads to an increase in the young population and a decrease in the proportion of older people in the target areas (see Ananta & Arifin, 2009; Arifin & Ananta, 2016; Wu et al., 2021; Zheng & Yang, 2016). Therefore, in-migration and out-migration variables affect the age structure and ageing process of the population in two ways. Since the effect of internal migration on ageing cannot be overlooked in a country like Turkey where a powerful migration from rural to urban areas has taken place in the last 50-60 years, the variables of internal migration rate (IMR) and external migration rate (OMR) have been included in the grouping analysis.
2. Analysis Technique: Grouping Analysis
Spatial grouping analysis was used in this study to establish ageing regions. According to this analysis, groups emerge when nearby or neighboring measures tend to be similar. The identification of spatial groups facilitates hypothesizing about the relationship between the patterns of a geographic phenomenon and the processes underlying the phenomenon. Group detection fulfills the dual task of examining whether the distribution is clustered, and revealing the location and extent of groups. Group detection is normally accomplished by assessing how the investigated patterns differ from a random pattern. If nearby values are more similar to each other than a random pattern, or if there are more observations within a neighborhood than for a random distribution, the distribution under study is claimed to cluster. A neighborhood with more similar values or more observations defines a group (Lu, 2009, p. 317).
Spatial grouping analysis has recently been added to traditional cluster analysis. Spatial grouping analysis differs from traditional clustering analysis to a certain extent. One of the most important differences is that spatial grouping analysis is mainly based on the spatial location of geographical phenomena and the attribute information of the relevant geographical phenomenon. Secondly, the spatial aggregation of objects in space according to their different subcomponents into groups and various subgroups occupying different spatial units are analyzed. This is because the formation of spatial subgroups is a product of the geographical environment (Jiang, 2021). The identification of groups from the spatial patterns of a multi-component phenomenon such as ageing is possible through spatial grouping analysis rather than traditional cluster analysis.
Objects with more than one attribute can be classified using spatial statistical analysis sets in the Geographical Information System - GIS environment (Kastreva & Patarchanova, 2021). The most important advantages of grouping analysis using GIS programs are the mapping of groups and the visualization of group locations and distribution areas. Thus, groups can be identified and mapped by analyzing different layers with location information and multiple attribute data together (Kastreva & Kastreva, 2020). Indeed, spatial grouping analysis is used in demographic research to serve such a purpose (Kastreva & Patarchanova, 2021).
Grouping analysis provides useful results in the establishment of ageing regions. Therefore, it is necessary to distinguish between areas that are similar and dissimilar in terms of the level of ageing and its determinants at a given spatial scale. Accordingly, it is expected that the similarities between all units within a group are maximized, which is the basic principle of region definition and distinction. On the other hand, similarities must be maximum within a region (group) and minimum between regions. Therefore, areas that are similar to each other remain within the region, while those that are dissimilar are excluded. This leads us to distinguish and define the region, in a way, by “drawing a border” (fig. 2). This process, which must be done separately for each variable to be included in the analysis, results in the separation of more than one region. It should be reduced to a single layer, since a separate layer of region boundaries established for all variables will not be useful. This can be possible by reanalyzing the region separations generated for each variable. However, more than one variable can be processed with grouping analysis, and a result can be reached directly.
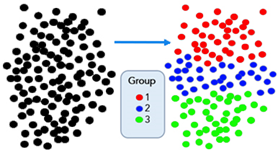
Fig. 2 Schematic representation of grouping analysis. Source: Environmental Systems Research Institute [ESRI]
This study professes that the data of five different layers (variables) related to ageing and its determinants according to the spatial units of districts can be analyzed in a statistically grouped way to determine the tendency to form regions. In this framework, the distribution of structural ageing and fertility, longevity and in-migration and out-migration, which are effective in this distribution, were considered together and Grouping Analysis, one of the Spatial Statistics techniques of ArcGIS 10.5 software, was used to determine which districts are spatially similar (or in the same group) and which districts are different (in different groups). This analysis makes a grouping based on the distribution of the data according to the predetermined number of groups from the processed different data, as the number of groups is left to the user's preference in version 10.5 of the ArcGIS. The aim was to ensure that the differences within the group are minimized and the differences between the groups are maximized.
Many algorithms are used in statistics to determine a specific clustering and the results are tested with various performance indicators (Karaoğlan, 2018). However, K-means clustering, one of the non-hierarchical multivariate statistical analysis techniques which is often preferred in social science research was also preferred in this study. In fact, K-means clustering is used in the background of the spatial grouping analysis of ArcGIS 10.5 software (ESRI, 2022). The number of groups in the analysis was determined using the Calinski-Harabasz pseudo F-statistic, which is a ratio reflecting the similarity within groups and the difference between groups, and this number was determined as four. Thus, 973 districts in Turkey were divided into four different groups in terms of ageing and its determinants.
If the spatial position of the groups obtained in the grouping analysis is to be taken into account (within the Spatial Constraints tab), the spatial weight matrix (neighborhood, distance, etc.) can be selected and included in the analysis as in other spatial statistical analyses. However, in this study, no spatial weight matrix was used in order to identify districts that exhibit ageing characteristics that are completely different from their surroundings. Another reason for not using a spatial weight matrix was the desire to maximize the similarity within the group. Thus, restrictions such as spatial proximity or neighborhood were overcome.
The output of the grouping analysis is a report containing the descriptive statistics of each group and variable and a map showing which group the spatial units are in (Kastreva & Paratachanova, 2021). The final report of the analysis in this study includes descriptive statistics of all the variables in the classification of four regions, descriptive statistics of each region separately, and a parallel boxplot graph generated from the statistical indicators of the groups.
IV. Results
1. The Spatial Patterns of Demographic Variables Used to Distinguish Ageing Regions in Turkey
This section summarizes the spatial patterns of variables used to distinguish the ageing regions in Turkey to demonstrate the background of the grouping analysis better.
Structural ageing (SA): As can be seen in figure 3, the country is roughly divided into two main areas in terms of structural ageing. The first area includes districts in the Northeast, Central East, and Southeast Anatolia regions of Turkey, the coastal areas of the East Marmara, Aegean and Mediterranean regions, West Anatolia, Istanbul and other metropolitan urban areas. These districts are often areas with structural ageing levels (i.e. young and mature age structure) of less than 10% and sometimes even less than 5%. On the other hand, the second area includes mostly districts located in the West Black Sea and East Black Sea, Central Anatolia, West Marmara and Aegean regions. These districts are rural areas with structural ageing levels (hence old or very old age structure), above 10%, sometimes 15% or even 20% (Yakar & Özgür, 2022).
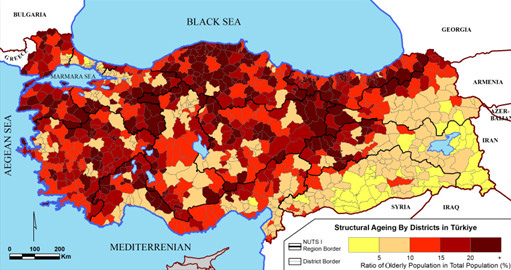
Fig. 3 Structural ageing (SA)(Ratio of olderly population in total population) by districts in Turkey (2020).
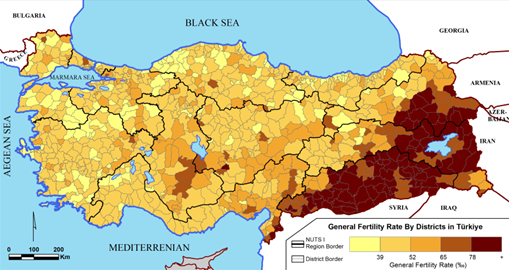
General fertility rate (GFR): The spatial pattern of the overall fertility rate in Turkey is shown in figure 4. According to this, the country is again divided into two main areas. The first area includes the districts in the eastern regions of the country. Accordingly, the GFR exceeds 52 per thousand (average for districts) and often exceeds 75 per thousand in the districts of the Southeast Anatolia Region and the neighboring provinces of Central East Anatolia, such as Van, Bitlis and Muş, and those in Northeast Anatolia, such as Ağrı and Erzurum (fig. 4). These districts have historically been high fertility areas in Turkey, and as such have been always being distinctly different from the rest of the country (Yüceşahin & Özgür, 2008). Secondly, there are districts where the GFR is below 52 per thousand and partly below 39 per thousand. The areas in this latter group, which have the lowest GFR values in the country, are mostly concentrated in the West Black Sea, Aegean, West Marmara and East Marmara regions (fig. 4).
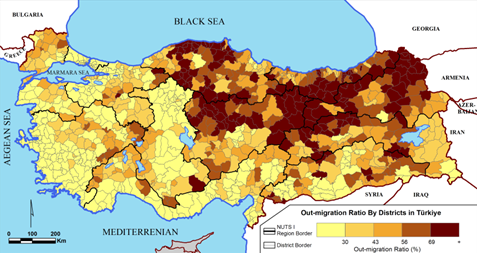
Out-migration ratio (OMR): the spatial differences in outward migration are clearly evident in figure 5. Accordingly, the cumulatively high out-migration ratios of northern and northeastern Turkey are immediately marked: In most districts of the West Black Sea, East Black Sea, Northeast Anatolia, Central Anatolia, the OMR exceeds 56% or even 69%. Since the mid-20th century, these have been the most out-migrating areas due to difficult natural conditions, insufficient economic resources and social opportunities (Filiz, 2008; Tümertekin, 1968). In contrast, districts in western and southern Turkey have relatively lower levels of OMR: In most districts in the Aegean, West Marmara, East Marmara, West Anatolia and Mediterranean regions, and partly in Southeast Anatolia, the OMR falls below 43%, and often below 30% (fig. 5), as they are the developed districts of Western Turkey with the lowest OMRs, reflecting development differences (Ministry of Industry and Technology, 2022).
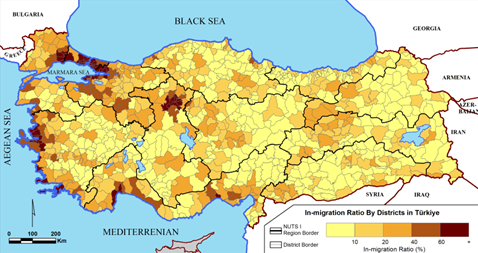
In-migration ratio (IMR): The cumulatively highest in-migration ratios in the country are observed in western and southern Turkey: Istanbul, Aegean, West Marmara, East Marmara, East Marmara, West Anatolia and Mediterranean regions (fig. 6). The metropolitan districts in these regions have long been the destination of migration in Turkey, thanks to urban job opportunities in industrial, touristic and various other sectors (Yakar, 2015). The IMR in these districts exceeds 40%, and even 60% in the developed metropolitan districts of Istanbul, Ankara, Izmir and Kocaeli. On the other hand, districts in the rest of the country have low levels of IMR, mostly below 10% (fig. 6 ). These areas correspond to districts in Turkey with low levels of socio-economic development and population loss through negative net migration rates (Yakar & Saraçlı, 2010).
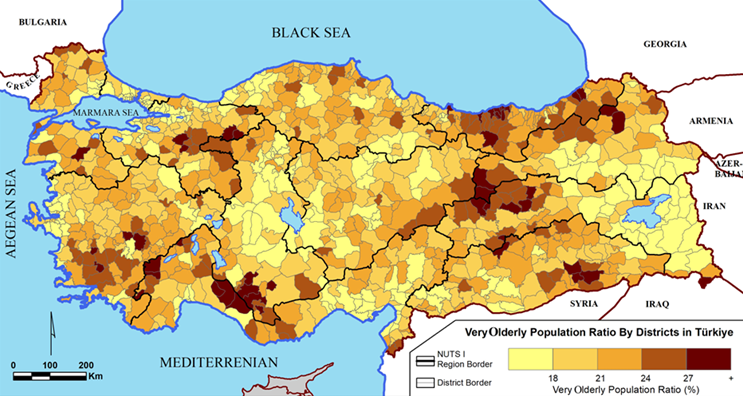
Very olderly population ratio (VEPR): The pattern of very old (olderly) population ratios in Türkiye does not display inter-regional differences that are as marked as the other variables. In each region of the country, there are districts with high VEPRs. In particular, some districts in the East Black Sea, East Marmara, Central East Anatolia, Aegean and Mediterranean regions have VEPRs above 24% and in some cases over 27%. The VEPR is below 18% in districts mostly located in the eastern and central parts of Türkiye (fig. 7).
2. Ageing Regions of Turkey
Descriptive statistics and R2 values of all variables included in the analysis are the most important statistical indicators resulting from the grouping analysis (table I). The calculated R2 values approaching 1 indicate that the distinguishing capacity of that variable in grouping analysis is high compared to other variables. When this value is close to zero, it indicates that the distinguishing capacity of that variable in the formation of groups has weakened (Kastreva & Patarchanova, 2021; Ruda, 2016). Accordingly, among the R2 values of ageing patterns and variables, the highest value corresponds to the in-migration ratio (R2 = 0.76). This is followed by the structural level of ageing, the general fertility rate, the out-migration ratio and the R2 value of the proportion of the very olderly population (table I). These R2 values of the variables also indicate that they can be used in grouping analysis to establish ageing regions.
Table I Descriptive statistics of the variables used in the grouping analysis.
| Variables | Average | Std. dev. | Min. | Max. | Range* | R2 |
|---|---|---|---|---|---|---|
| IMR | 20.36 | 21.76 | 0.88 | 97.13 | 96.25 | 0.76 |
| SA | 15.15 | 7.42 | 2.50 | 37.80 | 35.30 | 0.64 |
| GFR | 52.26 | 18.20 | 19.39 | 195.08 | 175.69 | 0.63 |
| OMR | 43.20 | 22.86 | 3.30 | 92.66 | 89.36 | 0.55 |
| VEPR | 20.76 | 3.56 | 11.80 | 34.30 | 22.50 | 0.36 |
| N= 973. Std. Distance = 37.35. SSD = 2003.05 | ||||||
* The Range value is not an indicator in the tabular output of the analysis, but has been added by the authors to explain how the share value in Table II is calculated and to help understand what it means. Abbreviations: IMR: In-migration ratio; SA: Structural ageing; GFR: General fertility rate; OMR: Out-migration ratio; VEPR: Very olderly population ratio. Source: TurkStat (2021)
The main output of the grouping analysis is the identification of groups with the variables included in the analysis. Two separate outputs consisting of a statistical table and a map are generated as a result of the analysis. The table contains the descriptive statistics of each variable in the groups resulting from the analysis according to the number of determined groups (table II). These statistics show how the variables are distributed within and between the groups.
The shared value of each variable in the groups is obtained by dividing the range value (a measure of central dispersion, calculated by subtracting the minimum from the maximum in the data set) of the relevant variable in the group in which it falls by the global (country-wide in table I) range value of the relevant variable. This tells us how much of the global range value is covered by the range value of any variable in the group. As a result, a high share value indicates high coverage and low distinctiveness in the formation of that group, since it will cover a large part of the global range value1. Therefore, when the share value of the variables within each group is ranked from low to high, a sequence emerges from the most important variable to the least important variable in the formation of that group. On the other hand, when the variables are ranked from the highest share value to the lowest one, a sequence casting a reflection/similarity for the overall country from high to low is obtained.
Table II Descriptive statistics of the variables of the regions established in the grouping analysis.
| Region (Group) | Variables | Mean | Std. Dev. | Min. | Max. | Range* | Share |
|---|---|---|---|---|---|---|---|
| 1st Region Youthful | IMR | 8.90 | 6.57 | 0.88 | 36.06 | 35.18 | 0.36 |
| SA | 6.70 | 2.47 | 2.70 | 14.90 | 12.20 | 0.34 | |
| GFR | 85.17 | 18.93 | 56.39 | 195.08 | 138.69 | 0.79 | |
| OMR | 45.37 | 19.10 | 7.62 | 83.24 | 75.62 | 0.85 | |
| VEPR | 19.43 | 3.06 | 13.00 | 28.90 | 15.90 | 0.71 | |
| N = 155 Std. Distance = 27.96 SSD = 422.04 | |||||||
| 2nd Region Mature | IMR | 70.00 | 18.66 | 22.15 | 97.13 | 74.98 | 0.78 |
| SA | 9.73 | 3.75 | 3.50 | 22.00 | 18.50 | 0.52 | |
| GFR | 44.62 | 9.43 | 23.56 | 74.87 | 51.31 | 0.29 | |
| OMR | 19.59 | 9.65 | 5.80 | 54.94 | 49.14 | 0.55 | |
| VEPR | 17.47 | 2.48 | 11.80 | 27.90 | 16.10 | 0.71 | |
| N = 173 Std. Distance = 23.47 SSD = 332.57 | |||||||
| 3rd Region Aged | IMR | 14.19 | 9.56 | 1.22 | 46.84 | 45.62 | 0.47 |
| SA | 15.04 | 4.29 | 2.50 | 29.50 | 27.00 | 0.76 | |
| GFR | 47.76 | 7.90 | 24.67 | 75.02 | 50.35 | 0.29 | |
| OMR | 34.68 | 15.02 | 3.30 | 82.03 | 78.73 | 0.88 | |
| VEPR | 20.65 | 2.65 | 15.00 | 34.30 | 19.30 | 0.86 | |
| N = 356. Std. Distance = 20.12. SSD = 606.47 | |||||||
| 4th Region Very Aged | IMR | 9.78 | 5.75 | 1.72 | 38.80 | 37.08 | 0.38 |
| SA | 23.07 | 5.68 | 10.30 | 37.80 | 27.50 | 0.78 | |
| GFR | 44.71 | 9.75 | 19.39 | 83.82 | 64.43 | 0.37 | |
| OMR | 66.65 | 15.97 | 9.88 | 92.66 | 82.78 | 0.93 | |
| VEPR | 23.56 | 3.16 | 15.80 | 33.50 | 17.70 | 0.79 | |
| N = 289. Std. Distance = 20.63. SSD = 641.96 | |||||||
* The Range value is not an indicator in the tabular output of the analysis, but has been added by the authors to explain how the share value in Table 2 is calculated and to help understand what it means. Abbreviations: IMR: In-migration ratio; SA: Structural ageing; GFR: General fertility rate; OMR: Out-migration ratio; VEPR: Very olderly population ratio. Source: TurkStat (2021)
Four different regions were established as a result of the grouping analysis. The districts that each of these regions covers are presented in figure 8, their descriptive statistics are presented in table II and the visualization of these statistics is presented in the boxplot in figure 9. All these outputs of the analysis give us the opportunity to define the characteristics of the ageing regions.
The First Region includes 155 districts in the east and southeast of Turkey (fig. 8 ). The average SA and IMR values for the region are well below the national average, while the VEPR is slightly below average. Furthermore, the OMR is slightly above average, while the GFR is well above average (tables I and II; fig. 9). The two variables that most distinguish the first region from the others are structural ageing and the in-migration ratio. The analysis shows that the other variables have low distinguishing capacity for the region. However, at this point, it should be noted that the region's high GFR rejuvenates the population, leading to a very low structural ageing in the total population (there is a negative correlation between the fertility rate and the proportion of olderly population). The first region has an OMR that is slightly above Turkey's average. However, although out-migration is known to increase ageing, the high fertility level reduces the negative impact of out-migration on ageing in this region, as the migrants are mostly young people. In conclusion, it can be established that Region 1 is characterized by high GFR and OMR values and low SA and IMR values (table II, fig. 9).
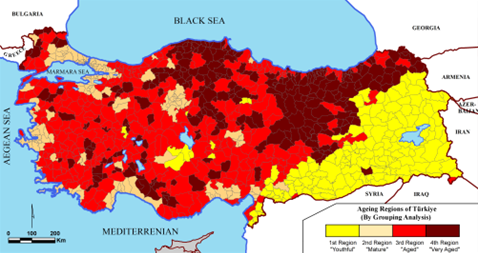
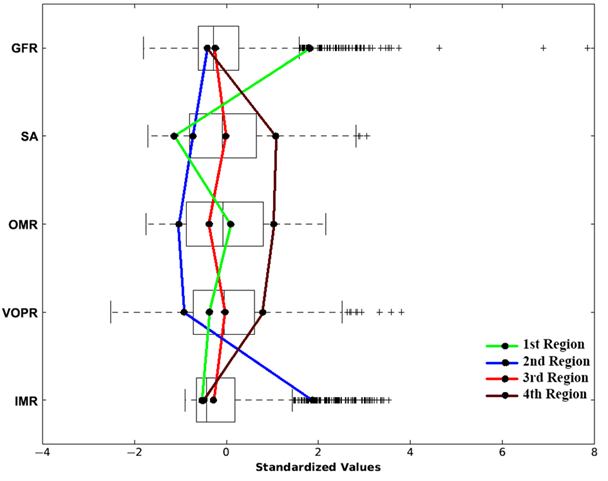
The Second Region mostly consists of the metropolitan and urban districts in Türkiye. There are 173 districts in this region, which consists of the central districts of metropolitan cities such as Istanbul, Ankara, Izmir, Bursa, Konya, Konya, Antalya, Adana, Gaziantep, Kayseri, Eskisehir, Denizli and Mersin, and districts that have an urban population density in some provinces such as Çanakkale, Edirne, Zonguldak, Osmaniye (table 2, fig. 8). Almost all districts in this region are concentrated in the western half of the country. This pattern is associated with urbanization dynamics due to internal migration. The IMR of the region is the highest among all regions. According to the analysis, the average in-migration ratio of the districts in the region is 70%. Therefore, the most important characteristic of the second region is the high in-migration ratio (fig. 9). The SA, VEPR, GFR and OMR values of the region are below the national averages. The share value of the second region, which largely constitutes the centers of attraction of urban migration in Türkiye, is as high as 0.78. Therefore, IMR is a variable with high coverage but a low distinguishing capacity for this region. On the other hand, considering that those migrating to urban areas in Türkiye are mostly young people (especially between the ages of 20-40), the proportion of the young population in the total population has naturally increased, which has curbed the increase in the proportion of the olderly population to some extent. Therefore, while urban areas were expected to have a higher proportion of olderly due to their fertility transition taking place earlier, the high levels of in-migration in the districts of the region have slowed down the ageing transition. In the second region, the district average of GFR with 44.6‰ is below the national level. The fact that GFR has the lowest share value of 0.29 among the other variables indicates the importance of fertility in distinguishing this region. The fact that fertility is lower than the national threshold in this predominantly urban region of Türkiye suggests that while it should accelerate ageing, the full impact has not occurred yet.
This is a sign of slow ageing from the bottom in the region and is related to in-migration slowing the pace of ageing. The average OMR in the second region is 19.6%, the lowest among all regions. The share value of OMR is 0.55 and this variable has a moderate effect in differentiating the region. The average structural ageing in the districts of the region corresponds to the national average of 9.7%. In addition, the proportion of very olderly population in this region is the lowest among all regions (17.5%) (table II).
The Third Region has the most coverage with 356 districts. This region, which is widely distributed in Turkey, includes districts mainly in the central, southern and western parts of the country, largely outside the urban areas of the second region (fig. 8). This region has the closest indicators to the national averages for all variables (fig. 9). The GFR, IMR and OMR values of this region are slightly below the national average, while the SA and VEPR values are almost commensurate with the average values (table II). The average GFR of the third region was 47.8‰. GFR is the most important distinguishing indicator of the region with a share value of 0.29. The low fertility rate has an increasing effect on ageing in the region. IMR (with a value of 14.19%) is the second most important determinant in the third region after GFR (with a share value of 0.47). These two variables characterize the region. In this region, the SA with a value of 15.04% and the VEPR with a value of 20.6% almost correspond to the national average. The fact that the third region is located close to the median value for each variable in the boxplot in terms of both the structural ageing and migration, moreover, fertility indicators shows that this region has the closest representation to national values (fig. 9).
The Fourth Region includes 289 districts, mostly located in the West and East Black Sea and Northeast Anatolia (in the north and northeast of the country), in the eastern parts of Central Anatolia and in mountainous areas. The first characteristic feature of the districts of this region is that they are represented by a low IMR. As shown in table II, the average in-migration ratio of the districts in this region is 9.8%. This value is even less than the average of half of districts in Turkey (table I and II). However, observations regarding retirees among those who migrated to the region suggest that in-migration (return migration of the olderly) may have had an increasing effect on ageing. Despite the low IMR, the region's out-migration ratio reaches the highest level among the regions with a value of 66.65%. The high OMR (especially the labor migration of youth) has accelerated ageing in this region. The GFR of the fourth region was below the national rate at 44.7%. High out-migration has contributed to a decline in fertility, especially as it leads to a loss of young population. The average SA of this region is 23.07% (table II), making the fourth region the oldest in Turkey. The average VEPR among the olderly population in the region is 23.59%, which is above the national threshold. As a result, the fourth region corresponds to the area with the highest SA and VEPR values in Turkey as a result of the ageing-enhancing effect of low fertility and high out-migration.
The ageing transition is relatively slow in this region where high fertility rates have an impact on the age structure, and the districts of the region correspond to areas that will experience population ageing last as a result of declining fertility levels. The second region which is comprised of districts with metropolitan areas and urban center characteristics (urban Turkey) represent a mature-older position in terms of the ageing level. This region, where the substantial effects of high in-migration have delayed ageing for the time being, can be labeled as having a "mature" population. The second region is the most populous region in Turkey in terms of total population and olderly population, but is not yet in the olderly population category. Therefore, this region is of critical importance for the future of national ageing and is expected to be the main determinant of changes in the level of national ageing in the future. The third region, which is notable by low fertility and in-migration ratios and contains the largest number of districts among the regions, can be characterized as "aged". Considering all the districts in Turkey, this region is composed of spatial units that represent the country as a whole in terms of ageing that are getting older as the proportion of the olderly population in the early stages of ageing increases rapidly. The fourth region is characterized by low fertility levels, marked by a loss of young population as a result of a long period of high out-migration. At the same time, the olderly population tends to live longer in the region. As an area undergoing the advanced stages of the ageing transition in Turkey, the fourth region can be labeled as "very aged".
V. Discussion and conclusions
Population ageing has long been on the research agenda in the social sciences, but has recently made progress with studies based on analyses using geographic information systems and spatial statistical techniques. These studies often focus on national-regional, urban-rural and intra-urban patterns and differences in ageing, or on the mobility/migration of the olderly population. Trends and changes in ageing on a global scale from past to present, as well as projections for the future have been considered (see Bloom et al., 2015; Phillips & Feng 2018; Rowland, 2009). Global ageing has been compared across countries and regions in some studies (see Káčerová et al., 2014; Kashnitsky & Schöley, 2018; Kashnitsky et al., 2021; Li et al., 2019). Some studies have explained variations in ageing patterns at the national scale in relation to demographic transitions and policy responses (e.g. Gregory & Patuelli, 2015; Krisjane et al., 2013; Káčerová et al., 2022). In addition, studies examining regional differences in ageing at the national level (Gietel-Basten et al., 2020; Heleniak, 2003), spatial ageing patterns and changes in these patterns (Cheng et al., 2018; Posada et al., 2018; Jackson et al., 2019; Reynaud et al., 2018; Rogerson, 1998) are available in the literature. Some studies have examined the spatial patterns of ageing within a state or province and the affecting factors together (Denny, 2018; Guan et al., 2020). In the literature, there are also studies focusing on the relationship between spatial patterns of ageing and internal migration, rural-urban differences (Shiode et al., 2014) or spatial patterns and temporal changes of ageing in metropolitan areas (Leyso & Umezaki, 2023; Li et al., 2023; Han & Corcoran, 2014). Some studies have examined ageing patterns and redistribution of the olderly population at the neighborhood level within cities (Han & Corcoran, 2014; Leyso & Umezaki, 2023; Neumann, 2013; Swiaczny, 2010; Yang, 2021; Xie et al., 2016). There are also some methodological differences in previous research. Different analysis techniques (e.g. Li et al., 2023; Posada, et al., 2018; Wu et al., 2019) or variables (e.g. Atkins & Tonts, 2016; Sarif et al., 2023; Shiode et al., 2014; Şenbil & Yetişkul, 2021) have been used in analyzing the spatial patterns of ageing.
Demographic variables related to fertility, longevity and internal migration have been associated with the proportions of the olderly population in this study and this multivariate data set has been integrated into the spatial analysis of geographical information systems and the ageing regions of Turkey were distinguished using the grouping analysis technique. It has been demonstrated in this study that the grouping analysis technique in the spatial statistical analysis set is functional in analyzing multivariate spatial data. Accordingly, variables representing the factors affecting population ageing were included in the grouping analysis and Turkey was divided into 4 ageing regions. In addition to this distinction, it was also revealed how the characteristics of each ageing region differ according to the variables. Thus, regional patterns and differences of ageing were determined by adding a spatial dimension to multivariate clustering analyses with the help of GIS.
As has been done in various studies (Kastreva & Paratachanova, 2021; Ruda, 2016), the 4 ageing regions identified as a result of the grouping analysis in this study have been labeled according to their characteristics. This labeling of ageing regions not only corresponds to the level of ageing ranging from young to very old, but also indirectly refers to the spatiality of the ageing transition. Accordingly, the first region can be defined as "young" in terms of the level of ageing. As Turkey is about to move into the category of a country with an "old" population, the fact that this region, which corresponds to underdeveloped eastern and southeastern Turkey is still young, distinguishes it from the rest of the country. The ageing transition is relatively slow in this region where high fertility rates have an impact on the age structure, and the districts of the region correspond to areas that will experience population ageing last as a result of declining fertility levels. The districts of Turkey with metropolitan area and urban center characteristics (urban Turkey) which constitute the second region, represent a mature-older position in terms of the ageing level. This region, where the strong impact of high inward migration has delayed ageing for the time being, can be labeled as having a "mature" population. Although the second region is the most populous region in Turkey in terms of total population and olderly population, it is not yet in the olderly population category. Therefore, this region is of critical importance for the future of national ageing and is expected to be the main determinant of changes in the level of national ageing in the future. The third region, which is marked by low fertility and inward migration rates and contains the largest number of districts among the regions, can be characterized as "old". Taking all districts of Turkey into account, this region is composed of spatial units that are representative of the country as a whole in terms of ageing, and which are getting older with rapidly increasing proportions of the olderly population in the early stages of ageing. The fourth region is characterized by low fertility rates, marked by a loss of young population as a result of prolonged and high out-migration. At the same time, the older population tends to live longer in the region. The fourth region is an area undergoing the advanced stages of the ageing transition in Turkey and can be labeled as "very old".
In summary, it can be argued that fertility rate, in and out migration rates affect the level of ageing and regional character differently in each region in Turkey. Accordingly, in the first region, a high fertility rate has ensured that ageing remained at a low level, while the high inward migration rate slowed ageing in the second region. While low inward migration and fertility were effective in the third region, high outward migration was the main determinant of ageing in the fourth region. On the other hand, VEPR, which has a moderate positive correlation with the proportion of the olderly population and has been included in the analysis to represent longevity, is not a sufficiently significant variable in region distinction.
Since the spatial perspective is as important as the temporal dimension in ageing research, it is a common emphasis of many studies to reveal differentiating patterns at different scales (Gietel-Basten et al., 2020; Reynaud et al., 2018). Focusing on the spatiality of ageing means not only identifying its changing patterns but also opening the path to questioning its emergence together with the dynamics that play a role in the background. The maps of ageing regions and the spatial patterns of the factors affecting the formation of these regions, which are the output of this study, not only make it possible to understand the phenomenon of ageing more easily, but also open up new channels of thinking for us.
The region is seen in a relational context as a meeting place of demographic, social, economic and political processes rather than a delimited space in this study, and its boundaries are recognized to change in a mobile world where many factors are changing. However, as Paasi (2020) points out, the practice of distinguishing regions by dividing or integrating spaces, i.e. regionalization, is always believed to be important both in the governance of the spatiality of social life as well as regional planning. Nowadays, it is thought that no two social processes develop exactly the same way in different localities, therefore the place where processes occur affects how they occur, and that causality and location are intertwined (Warf, 2006). Therefore, referencing spatial ways of thinking in the context of this dialectical relationship between ageing and space makes a unique contribution to geographies of ageing research.
Determining the regional/local distribution of ageing associated with demographic processes at a high-resolution district spatial scale is important for identifying changes in social structure and social needs. Furthermore, ageing regions are expected to contribute to the development of functional regional strategies for ageing policies and implementation programs. Thus, it will be possible to support national policies with regional/local policies to overcome the challenges posed by geographical differences in the health and well-being of the olderly. At this point, it would be functional to go beyond identifying spatial patterns at varying scales and attempt to distinguish homogeneous ageing regions from the spatial patterns of multivariate indicators that shape ageing. This is because identifying ageing regions will contribute to the spatial prioritization of needs and services by policy makers and practitioners, thereby increasing the level of achievement. Moreover, the attempt in this paper to create regions based on demographic variables influencing ageing can be seen as a tool of the new regional geography framework (Murphy & O'Loughlin, 2009) to understand the rapid and profound changes in the contemporary world and has the potential to be applied to other geographical phenomena.
Authors' contributions
Mustafa Yakar: Conceptualization; Methodology; Software; Validation; Formal Analysis; Research; Resources; Data Curation; Writing - Original Draft Preparation; Writing - Review and Editing; Visualization; Supervision. Ertuğrul Murat Özgür: Conceptualization; Methodology; Software; Validation; Formal Analysis; Research; Resources; Data Curation; Writing - Original Draft Preparation; Writing - Review and Editing; Visualization; Supervision.

