




 Inglês (pdf)
 Artigo em XML
 Referências do artigo
 Tradução automática
 Enviar este artigo por email
 Citado por SciELO
  Similares em
SciELO
Similares em
SciELO 
 Permalink

Highlights
Heat stress occurred mainly in summer, and cold stress predominated in winter in Bahía Blanca.
Extreme cold stress was common at night and in the early morning; heat stress occurred predominantly in the afternoon.
In the last decade, maximum PET values during heatwaves reached up to 48.7 °C.
Coastal areas experienced reduced thermal stress due to the moderating effect of the sea.
Suburban areas experienced more cold stress in winter and less heat stress in summer.
1. Introduction
Because of their high energy demand and greenhouse gas (GHG) emissions, cities contribute greatly to climate change (CC), while being particularly vulnerable to its impacts (Barros & Camilloni, 2016; United Nations Habitat, 2020). Urban geometry (dimensions and arrangement of buildings), construction materials (iron, concrete, cement, bricks, etc.), types of surface coverage (asphalt) and the waste generated by human activities affect climate at different scales (Oke et al., 2017). On a global scale, population growth and urban energy consumption modify the natural substrate and emit greenhouse gases (GHG) into the atmosphere, exacerbating CC (IPCC [Intergovernmental Panel on Climate Change], 2014, 2019). At the local and micro-local scale, cities modify the vertical and horizontal thermal distribution of temperatures, generating urban cold islands (UCI) and urban heat islands (UHI) (Oke, 1973, 1997, 2011; Oke et al., 2017).
The increase in urban temperature generates several risks to human health and has a great effect on life quality and comfort conditions. Extreme thermal episodes discourage the development of outdoor activities (Ho et al., 2023; Jemmett-Smith et al., 2018; Johansson, 2006; Kotharkar et al., 2024; Li & Ratti, 2018; Sambrook et al., 2023; Smith & Lancaster, 2020) and increase energy consumption for indoor cooling or heating (Alnuaimi & Natarajan, 2021; Añel et al., 2017;Doulos et al., 2004). Among the most severe extreme thermal events, heatwaves (HW) stand out, which can be defined as a “pervasive natural hazard that can take a heavy toll on human systems, affecting health, livelihoods and infrastructure” (WMO [World Meteorological Organization], 2015b, p. 17). Several studies verified the impact of HW on mortality (Chesini et al., 2019; D’Ippoliti et al., 2010; Dimitriadou & Zerefos, 2023; Dimitrova et al., 2021; Hassan et al., 2020; López-Bueno et al., 2020). Among the extreme cold episodes with the greatest impact, coldwaves (CW) stand out. These are more or less prolonged periods in which temperatures are lower than normal. The WMO defines CW as the persistence of cold air over an area (WMO, 2015a). Extreme cold is associated with respiratory, cardiovascular and infectious diseases (Chen et al., 2020; Hajat & Haines, 2002; Khanjani & Bahrampour, 2013; Mäkinen et al., 2009; Medina-Ramón et al., 2006; Monteiro et al., 2013; Urban et al., 2014) and negatively influences human comfort (Basarin et al., 2016; Roshan et al., 2018). With global CC it is expected that the frequency, duration and intensity of extreme weather events will increase (IPCC, 2019, 2023), so it is essential to assess the real impact of these events on the quality of life and comfort of citizens.
Thermal comfort defines the use and permanence of citizens in urban public spaces, which is why its inclusion in urban development plans is highly recommended (Shooshtarian et al., 2020). Indeed, one of the main objectives of urban design is to minimize human heat and cold stress (Oke et al., 2017). Thermal comfort is achieved under a set of atmospheric conditions in which self-regulation mechanisms are minimal and the body temperature is brought in line with that of the environment (Fernández García, 1996). According to the American National Standards Institute (ANSI) and the American Society of Heating, Refrigerating and Air-Conditioning Engineers (ASHRAE), Standard, thermal comfort is defined as “the mental condition which expresses satisfaction with the thermal environment and which is assessed by subjective evaluation” (ANSI/ASHRAE, 2010, n.p.). Acquiring information about human comfort in outdoor environments requires information about climatic elements (such as temperature, wind, humidity and radiation) and also about the biophysical and psychological response of the individual, which depends on activity levels, age and clothing, among others (Oke et al., 2017).
A universal index for the assessment of human thermal comfort is the Physiological Equivalent Temperature (PET) (Fröhlich et al., 2019; Matzarakis et al., 1999). PET is defined as the physiological equivalent temperature at any given place (outdoors or indoors) corresponding to the air temperature at which, in a typical indoor setting, the heat balance of the human body (work metabolism 80W of light activity, added to basic metabolism; heat resistance of clothing 0.9clo) is maintained with core and skin temperatures equal to those under the conditions being assessed (Höppe, 1999). The PET index has been used to describe biometeorological conditions in Europe (Ateş et al., 2023; Basarin et al., 2016; Fernández García et al., 2012; Fiorillo et al., 2023; Konstantinov et al., 2022; Milošević et al., 2016; Royé et al., 2012), North America (Provençal et al., 2016; Taleghani & Berardi, 2018), Asia (Hanafi & Dastjerdi, 2014; Kotharkar et al., 2024; Lin & Tsai, 2017; Yang et al., 2018), South America (Helbig et al., 2007; Mesa et al., 2009; Ribeiro et al., 2022; Ruiz & Correa, 2015b; Puliafito et al., 2009), among others. At local and micro-local scales, PET has been widely used to determine the intra-urban variability in comfort. Numerous authors (Kotharkar et al., 2019; Milošević et al., 2016; Ruiz & Correa, 2015a; Puliafito et al., 2013; Unger et al., 2017; Xiang & Ren, 2017) analyzed outdoor thermal comfort based on the Local Climate Zones (LCZ) classification system.
In 2015, the United Nations General Assembly adopted the 2030 Agenda for Sustainable Development which incorporates 17 Sustainable Development Goals (Dugarova & Gülasan, 2017; United Nations General Assembly, 2015), as SDG 11 “Make cities inclusive, safe, resilient and sustainable”. In this context, knowing the spatio-temporal variability of PET in cities is an important step in the definition of climate change adaptation measures and in the planning of thermally comfortable spaces. In Bahía Blanca (Argentina), several studies have documented the effect of the urban form and function on temperatures (Capelli de Steffens et al., 2005; Ferrelli, 2016; Gentili & Fernández, 2023), urban energy balance (Fernández et al., 2021) and atmospheric pollution (Campo et al., 2017, 2018; Colman Lerner et al., 2012; Fernández, Gentili, & Campo, 2021; Orte et al., 2013; E. Puliafito et al., 2009). In this context, it is of interest to know the impact these conditions exert on the comfort of the inhabitants of different areas of the city. In this line, the aim of the present work is to characterize the spatio-temporal variability of thermal comfort in Bahía Blanca during the period 1961-2020 and during extreme thermal episodes (heatwaves - coldwaves). Since PET has a widely known unit (°C), it is accessible for urban planning decision makers (Matzarakis et al., 1999; Tornero et al., 2006). The originality of this research is based on several factors: the study area, its scope and temporal resolution, the multiscale analysis, and the potential for extrapolation to intermediate Latin American cities. Several studies focus on the spatio-temporal variability of PET in the Northern Hemisphere, while in the Southern Hemisphere, this type of research is still in its early stages (Costa et al., 2024). In fact, there is a lack of understanding regarding the large-scale and long-term variability and trends of thermal stress on this continent (Miranda et al., 2024). In Argentina, long-term spatio-temporal variability of comfort situations using the PET index has not been developed (Costa et al., 2024). Preliminary work in this field focused primarily on the PET index in some Argentine locations, but in shorter periods and very few of these studies explore the intra-urban variability of comfort. However, studies conducted in urban environments of the Southern Hemisphere are of great importance for several reasons. First, a continuous rise in the frequency of extreme heat events has been observed in Bahía Blanca (Gentili & Fernández, 2024), Argentina (Camilloni, 2018; Ferrelli et al., 2021; Rusticucci et al., 2015; Santágata et al., 2017) and South America (Cueto et al., 2010; Feron et al., 2019; Piticar, 2018). By the end of the 21st century, numerous countries in South America are likely to face heightened levels of heat-related health stress due to escalating natural hazards and population growth (Hagen et al., 2022). In fact, according to Smit (2021) the Southern Hemisphere is rapidly urbanizing, having contributed 94% of global population growth between 2010 and 2015. The present study includes bioclimatological analysis at various scales, incorporating a local study spanning a ten-year period. In Bahía Blanca, this study stands out due to its extensive analysis period (60 years in total) and high temporal resolution (hourly analysis), making it a unique contribution. It also sets a precedent of interest, as its results could potentially be extrapolated to other intermediate cities in Latin America. Crawford et al. (2018) affirm that neighborhoods in the Global South often exhibit different building construction materials and development patterns than those of the Global North and, although the majority of rapidly growing cities occurs in the Global South, the urban climate research in such cities has been sparse. Therefore, the results of this research will be a useful input for improving the urban habitability of Bahía Blanca as well as a contribution to the knowledge for building and generating resilient cities in Latin America (Vecellio & Vanos, 2024).
2. Study area
Bahía Blanca (fig. 1a) is an intermediate city in Argentina located in the south of Buenos Aires province. It is the head city of the homonymous district and has a population of 335.190 inhabitants ( Instituto Nacional de Estadística y Censos [INDEC], 2023). Bahía Blanca has a transitional climate between the hot and humid of the eastern Buenos Aires province and the cold and dry climate of Patagonia. The regional atmospheric circulation is controlled by the large-scale systems influencing the South of the American continent (fig. 2): the semi-permanent anticyclones of the Atlantic ocean (South Atlantic Anticyclone, ASS) and Pacific ocean (South Pacific Anticyclone, APS) (Chiozza & Figueras, 1982; Grimm et al., 2000). Bahía Blanca has a mean annual temperature of 15.5°C with a marked thermal seasonality: 22.3°C summer mean and 9.5°C winter mean. Rainfall has an annual mean value of 644.6mm and summer is the rainiest season in the city, with an average value of 206.2mm (Ferrelli, 2016; Zapperi, 2012). Bahía Blanca has one of the highest average wind speed values in the region, mainly in summer. Its preponderant direction is north and northwest (Campo de Ferreras et al., 2004). The regional dynamics of solar radiation is largely determined by the passage of migratory anticyclones over the Argentinean territory and the associated synoptic conditions, as well as by the passage of cold fronts (Fernández, 2020; Fernández, Gentili, Casado, et al., 2021). At the local scale, the variable shows a marked seasonal variability and a strong dependence on cloud cover. In all thermal seasons, global solar radiation increases uniformly from sunrise throughout the day, reaching its maximum around 1:00p.m. (the fact that solar noon is at 1:00p.m. is due to the fact that the time zone in Argentina is -3 UTC, even when the country is located in the -4 UTC time zone) (Fernández, 2020; Fernández & Gentili, 2021b).
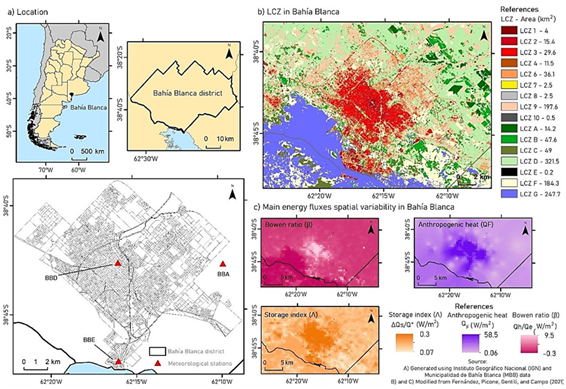
Fig. 1 Study area: a) Location, b) Local Climate Zones (LCZ), c) Spatial distribution of the main energy fluxes. Colour figure available online.
Bahía Blanca has shown significant expansion of the urbanized area. Between 2010 and 2016, the urban population increased by 0.5% annually compared to an increase in the urbanized area of 2.71% in the same period (Centro de Implementación de Políticas Públicas para la Equidad y el Crecimiento, 2017). High-rise building began to develop in the mid-20th century around the central square and in the following years it exceeded the microcenter and macrocenter boundaries (Fittipaldi et al., 2018; Formiga & Marenco, 2000). Figure 1b shows the Local Climate Zones (LCZ) classification (Stewart & Oke, 2012) made for Bahía Blanca (Fernández et al., 2021). Most of the LCZs built types correspond to LCZ 1, 2, 3, 6 and 9. In the microcenter most of pixels correspond to compact high-rise (LCZ 1) and compact mid-rise (LCZ 2), while in the macrocenter LCZ 3 (compact low rise) prevails. In the peri-urban area, where low-rise residential neighborhoods are common, LCZs 6 and 9 classifications are mainly observed. Regarding land cover types, LCZs B and F are the most observed, mainly in the rural area surrounding the city (Fernández et al., 2021).
Due to its constant growth, Bahía Blanca is not free from the most common urban problems. Recent studies observed that the city growth between 1985 and 2014 modified the spatial distribution of temperature and relative humidity while the intensity of the ICU increased in that period as well (Ferrelli, 2016; Ferrelli et al., 2016).
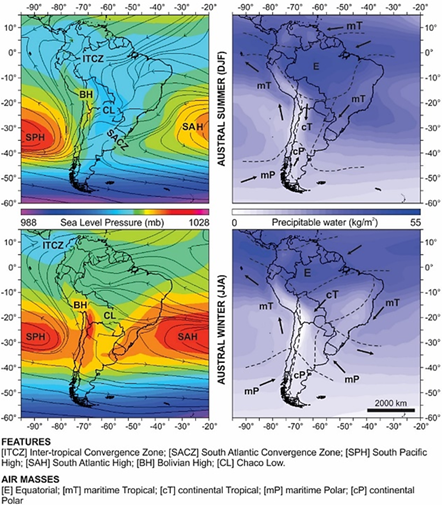
Fig. 2 Seasonal patterns of atmospheric circulation and rainfall over South America. Colour figure available online.
Figures 1b and 1c synthesize the main results of research related to the urban energy balance (UEB) in the city (Fernández, 2020; Fernández, Picone, et al., 2021), which studied the spatial variability of UEB components by calculating indices such as the storage index (Λ) and Bowen ratio (β), among others (Oke et al., 2017). It can be observed that in the central zones of Bahía Blanca (LCZ 1 and 2) sensible heat (QH), anthropogenic heat (QF) and storage heat (QS) fluxes prevail while in the peri-urban area (LCZ 6 and 9) and the coastal area (LCZ F and G) latent heat fluxes were more predominant. In relation to this, Gentili et al. (2020) documented the increase of car parks in the city micro-center (LCZ 1 and 2) and their influence on some urban environmental problems, such as ICU and air pollution. Regarding comfort, Fernández et al. (2018) showed that the city center registered a lower percentage of comfortable days than the rural area and a lower percentage of cold stress frequency.
3. Materials and methods
Meteorological records from three stations located in different points of the city were used (fig. 1a). First, the station “Bahía Blanca Airport” (BBA) which belongs to the National Meteorological Service (SMN, for its initials in Spanish) and has hourly records of temperature (°C), humidity (%), wind speed (m/s) and cloudiness in Bahía Blanca for the period 1961-2020. These data, being the most extensive in time, were used to made the general analysis of the bioclimatic profile of the city. For its specific location without horizon limitation (10km away from the city center with no buildings and no higher vegetation), it was considered representative of the geographical factors that define the regional climate. On the other hand, for the analysis of the comfort variability at the local scale, we worked with hourly records of temperature (°C), humidity (%), wind speed (m/s) and global solar radiation (W/m2) from two weather stations: “Bahía Blanca Downtown” (BBD) and “Bahía Blanca Estuary” (BBE) (fig. 1a). Although the period of registration of these stations is limited (2001-2010), their data are representative of different LCZs of the city (fig. 1b), and it is expected the results of their comparison will provide unprecedented information on the variability of comfort at an intra-urban scale.
For the calculations of the PET index, the RayMan Pro tool was used (Fröhlich et al., 2019; Matzarakis et al., 2007, 2010, 2021; Matzarakis & Fröhlich, 2018). Calculations were performed using standardized values for age, sex, height and weight (35 years, male, 1.75m and 75kg) and an activity of 80W with a thermal resistance garment of 0.9clo (Höppe, 1999) as reference. The processing results were analyzed with Excel software using techniques associated to descriptive statistics. Threshold values for PET were developed in the form of a graded index (Höppe, 1999; Matzarakis & Mayer, 1996). The analysis included such categorization following the methodology of Matzarakis and Mayer (1996) and Basarin et al. (2016) (table I). We performed a general bioclimate diagram, which includes 10-day frequencies of the daily PET values for the period 1961 to 2020 (Matzarakis et al., 2011).
Table I PET: thermal sensation and grade of physiological stress on humans.
| PET | Thermal sensation | Grade of physiological stress |
| < -10 | Very cold | Extreme cold stress |
| ≥-10 <0 | ||
| ≥0 <4 | ||
| ≥4 <8 | Cold | Strong cold stress |
| ≥8 <13 | Cool | Moderate cold stress |
| ≥ 13< 18 | Slightly cool | Slight cold stress |
| ≥ 18 <23 | Comfortable | No thermal stress |
| ≥ 23 < 29 | Slightly warm | Slight heat stress |
| ≥ 29 < 35 | Warm | Moderate heat stress |
| ≥ 35 < 41 | Hot | Strong heat stress |
| ≥ 41 | Very hot | Extreme heat stress |
Source: Basarin et al. (2016), Matzarakis and Mayer (1996)
Heat (cold) waves can be defined as more or less prolonged periods of higher (lower) than normal temperatures. In Argentina, the National Meteorological Service (SMN for its initials in Spanish) defines the HW as:
the period in which the maximum and minimum temperatures equal or exceed, for at least 3 consecutive days and simultaneously, the 90th percentile, calculated from daily data during the months of October to March (warm six-month period in the southern hemisphere) of the period 1961-2010. (Herrera et al., 2018, p. 4)
For its part, the same organization defines as CW:
the period in which the maximum and minimum temperatures equal or are lower, at least during 3 consecutive days and simultaneously, than the 90th percentile, calculated from daily data during the months of April to September (cold six-month period in the southern hemisphere) of the period 1961-2010. (Veiga et al., 2015, n.p.)
The identification of HW and CW was based on previous research conducted by the authors using daily maximum and minimum temperature records provided by the SMN for the period 1961-2020.
4. Results
4.1 Variability of comfort at different time scales
Considering the interannual and interdecadal variability in comfort conditions (fig. 3), we found a mean PET of 10.9°C throughout the year, 16.9°C in the warm semester and 5.2°C in the cold semester. During the cold semester, the PET values ranged between 15.5°C (2007) and 19.9°C (1984) and during the warm semester between 2.8°C (2007) and 8.3°C (1970). The interannual and interdecadal variability in comfort conditions showed a clear seasonal pattern. The first three decades had a major variability in PET conditions. The 10-year period mean values had a decrease between 1961-1970 and 1971-1980. In the cold semester this trend was maintained, while in the warm semester a subsequent increase in the decadal mean values (1981-1990) was observed. In the first three decades, the decadal mean values showed greater variability, with up to 1°C of difference with respect to the half-yearly and annual values for the period 1961-2020. In the last three decades, the variable became more stable (maximum differences of 0.4°C with respect to the half-yearly and annual value for the period 1961-2020), although comfort conditions had greater inter-decadal variability in the cold half-year.
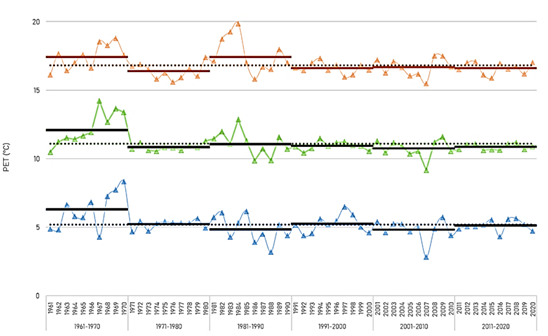
Figure 4 shows the human thermal bioclimatic conditions in Bahía Blanca expressed in percentages. 26.8% of the records for the period 1961-2020 corresponded to extreme cold stress and 2.5% to strong and extreme heat stress. Extreme thermal stress related to hot conditions (PET ≥ 35°C) was observed mainly during December, January and February. Extreme thermal stress linked to cold conditions (PET <4°C) had a higher percentage of occurrence throughout the year, mainly in June, July and August. Between late April and early September more than 50% of the records were associated with a cold and very cold thermal sensation (PET <8°C) and between June and August with a very cold sensation (PET <4°C). Comfortable thermal sensation (PET ≥ 18 <23°C) was minimal during winter months and was more frequent in the intermediate thermal seasons and during the summer.
The preponderance of cold thermal stress was observed in the city throughout the year with the highest frequency of occurrence during the second half of the year. During the first semester the slight physiological stress (PET ≥ 13 <18°C or ≥ 23 <29°C) was more frequent and the conditions of heat stress due to cold (PET <8°C) were comparatively less frequent than in the second semester.
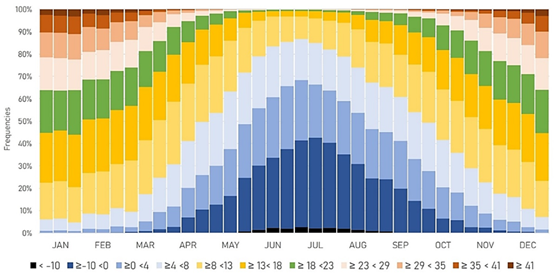
Fig. 4 Bioclimatic diagram for Bahía Blanca in ten-day intervals (1961-2020). Colour figure available online.
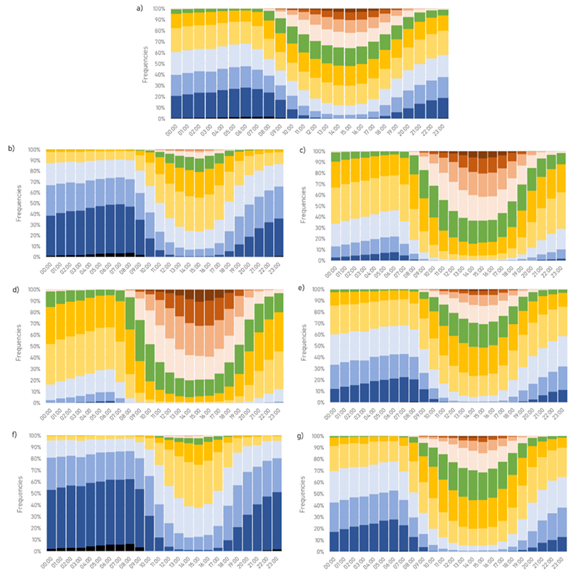
Analyzing the annual daily bioclimatic pattern for Bahía Blanca (fig. 5a), between 12:00a.m. and 07:00a.m. over 40% of PET values were < 4°C (extreme cold stress). PET ≥ 13 < 29°C (slight or no physiological stress) was more frequent between 10:00a.m. and 06:00p.m. (frequencies between 42.2% and 48.4%). PET ≥ 35°C (strong and extreme heat stress) was more frequent between 02:00p.m. and 03:00p.m.
The cold semester bioclimatic diagram (Fig. 5b) showed a higher frequency of extreme cold stress conditions (PET < 4°C), mainly during the night and early morning hours (between 10:00p.m. and 08:00a.m.), with percentages as high as 73.4% at 06:00a.m. The diagram also shows a lower frequency of PET ≥ 13 < 29°C. In fact, comfortable conditions (PET ≥ 18 < 23°C) only reached a 12.4% at 03:00p.m. and the slightly warm (PET ≥ 23 < 29°C) a 5.8%. The most abrupt changes in comfort conditions were recorded after sunrise and with increasing sun altitude between 08:00a.m. and 12:00p.m. During the night and the middle hours of the day, PET values remained more stable.
The diagram of the warm half-year (Fig. 5c) shows the highest frequencies of heat stress situations. PET ≥ 35°C reached the highest frequencies (up to 20.4%) between 01:00p.m. and 05:00p.m. The frequency of cold stress (PET < 8°C) was only visible after 06:00p.m. and up to 10:00a.m. PET ≥ 8 < 18°C (cool and slightly cool) were the most frequent conditions in that time slot (percentages above 50%). The warm half-year had the highest frequencies of comfortable conditions (PET ≥ 18 < 23°C), with percentages above 20% between 09:00a.m. and 08:00p.m.
Figures 5d to 5g show the quarterly variation of the daily bioclimatic diagram in Bahía Blanca. Extreme thermal stress was higher in summer (fig. 5d) and winter (fig. 5f), although the cold season had higher comparative percentages: extreme cold stress (PET < 4°C) reached up to 86.4% in winter, while in summer strong and extreme heat stress (PET ≥ 35°C) reached 31.8%. Autumn and spring (fig. 5e and fig. 5g) show some differences in comfort situations. Between 09:00p.m. and 08:00a.m., PET < 4°C had lower frequencies in autumn. In fact, up to 78% of the spring nocturnal records corresponded to PET < 8°C, while in autumn the percentages reached 67.5.
Thus, it is observed that cold stress conditions in Bahía Blanca were more frequent in spring than in autumn. During the middle hours of the day, cool and slightly cool (PET ≥ 8 <18°C) were the most frequent conditions both in autumn and spring, with percentages reaching 51.2% and 53.5%, respectively. PET ≥ 18 < 23°C (comfortable conditions) was more frequent in spring and both seasons had similar percentages of PET ≥ 23 < 29°C (slightly warm) and PET ≥ 29 < 35°C (warm).
4.2 Local bioclimatic conditions during extreme weather events
During most of the HW (fig. 6a) PET reached values above 41°C. In the last decade, all HW had a maximum PET above 43°C and up to 48.7°C. These conditions are unique to that period, which shows that discomfort conditions resulting from the occurrence of HW have increased in recent years. During the CW (fig. 6b) the minimum PET ranged between -8.3°C and -18.1°C. The first four 10-year periods had a greater variability in the minimums found, while, in the period 2001-2010, values were more stable. In the last decade no CW were recorded in Bahía Blanca. Between 1971-1980 and 1991-2000 were recorded the most extreme values of thermal discomfort due to cold.
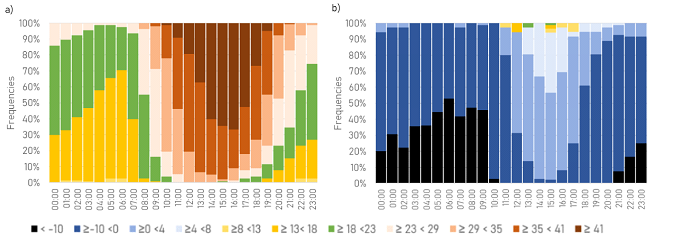
Figure 7 shows the daily bioclimatic diagram during extreme weather events in the period 1961-2020. Figure 7a shows that during HW extreme heat stress was highest during the central hours of the day. PET ≥ 41°C reached percentages higher than 60% between 2p.m. and 4p.m. and PET ≥ 35 < 41°C had percentages higher than 55% between 12a.m. and 1p.m.
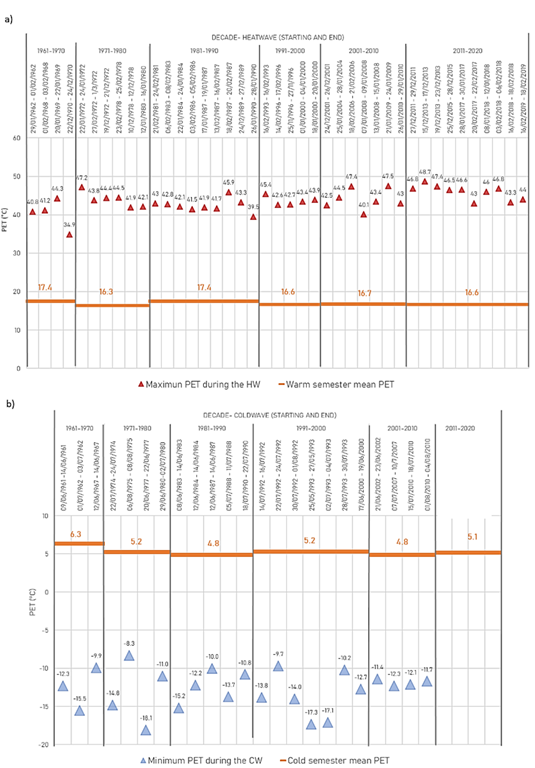
Figure 7b shows the daily variability of extreme cold stress situations during CW. Severe (PET ≥ 4 < 8°C) and extreme (PET < 4°C) cold stress situations prevailed throughout the day. From 10p.m. to 10a.m., PET < 4°C had a frequency of 100%. During the middle hours of the day (from 12a.m. to 5p.m.), PET ≥ 0 < 4°C reached a frequency of more than 60% and between 2p.m. and 4p.m., PET ≥ 4 < 8°C had frequencies of more than 25%.
4.3 Spatio-temporal variability of comfort at a local scale
Based on the mean inter annual variability in the comfort values (1961-2020) throughout the year, BBA, BBD and BBE have a maximum mean value of 23.4°C (January) and a minimum of 3.6°C and 5.4°C (June), respectively (fig. 8). BBA had lower PET values than BBE and BBD in the whole period and during winter the difference was the highest. During summer (DEF), BBD had similar PET values to BBE. From March to November, BBD showed a higher PET mean value than BBE. It is evident that the spatial variability in comfort conditions is greater during the cold season. In winter, a mean difference of up to 4°C was observed between BBA and BBE. During summer, this variation between BBE and BBD decreases. During winter months there is an intense process of heat absorption by the urban surface materials (Oke et al., 2017), which explains the lower PET levels in BBD.
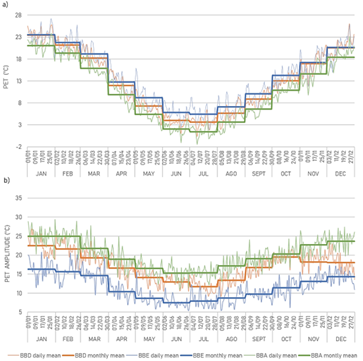
Fig. 8 BBD, BBE and BBA: a) monthly and daily mean PET, b) monthly and daily mean amplitude in PET values (2001-2010). Colour figure available online.
Figure 9 shows the mean daily distribution of PET values in BBA, BBD and BBE throughout the year, in the summer (DEF) and winter months (JJA). The daily pattern was determined by sunrise and sunset. During the night and early morning hours, BBE had higher PET values than BBD and BBA had the lowest. After sunrise, the pattern changed. The difference between the curves decreased and during central hours of the day BBD had higher PET values than BBE and BBA. In the twelve-month period and throughout the day, BBA had lower PET values than BBD and BBE. The maximum differences (up to 4.6°C) were between BBA and BBE during the night hours. BBD had lower PET values than BBE between 7p.m. and 9a.m., with a mean difference of 2.08°C.
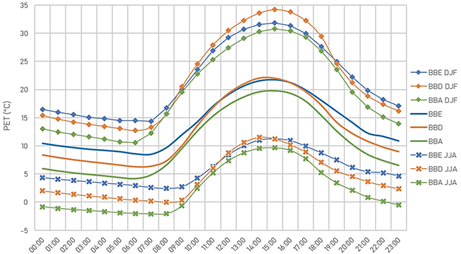
The seasonal analysis showed that during winter (JJA) the difference in comfort conditions was greater: between 5p.m. to 10a.m. BBD had lower PET values than BBE, with differences up to of 2.6°C and during the night (10p.m. to 6a.m.) the difference between BBE and BBA was higher and up to 5.2°C. On summer nights, the maximum difference in comfort conditions was found between BBE and BBA, amounting to more than 3°C. At midday and up to 5p.m., BBD had the highest PET values and BBA the lowest, with differences of up to 3.5°C. The central areas of the city had greater hourly variability in comfort conditions, with lower PET values at night (due to night cooling) and higher values during the day. In contrast, the coastal areas (BBE) showed less hourly variability in PET, with relatively higher values during the day.
5. Discussion
We analyzed the interannual and interdecadal variability in comfort conditions. The seasonal pattern observed in this variability aligns well with previous investigations. For instance, Pecelj et al. (2021) reported annual fluctuations of PET in Belgrade (Serbia), with maximum values in July and minimum values in January, characteristic of a moderate continental climate in the Northern Hemisphere. Other studies have also identified seasonality in comfort values (Cinar et al., 2023; Irmak et al., 2020; Toy et al., 2023). Despite its coastal location, Bahía Blanca exhibits a continental climate influenced by dry air masses from the N-NW (Campo de Ferreras et al., 2004; Capelli de Steffens et al., 2005). This results in high daily temperature amplitude, low relative humidity, and low cloudiness compared to other cities in the region (Campo de Ferreras et al., 2004; Fernández, Gentili, et al., 2018), all of which are factors influencing urban comfort.
The annual and seasonal daily bioclimatic pattern for Bahía Blanca showed extreme cold stress mainly during the night and early morning (between 00a.m. and 7a.m.). Slight or no physiological stress was found in the annual distribution during the central hours of the day (between 10a.m. and 6p.m.), and mainly during the warm semester between 9a.m. and 8p.m. The highest frequencies of heat stress situations were recorded in the warm semester between 1p.m. and 5p.m. This daily annual distribution is in good agreement with results found by Taleghani and Berardi (2018), who stated that the minimum PET for all scenarios in the city of Toronto occurred before sunrise and the maximum PET around 3p.m. Similarly, this pattern aligns with the summer daily pattern found by Helbig et al. (2007) in their PET analysis conducted in eight Argentinean locations. Our results are also consistent with those of Puliafito et al. (2013), who found acceptable thermal comfort values in the early mornings of summer days in downtown Mendoza (Argentina).
The analysis showed that HW and CW have extreme negative consequences on human comfort in Bahía Blanca, as corroborated by previous findings in the literature (Konstantinov et al., 2014; Kotharkar et al., 2019; Matzarakis & Mayer, 1996). The PET values observed during HW y CW are consistent with those reported by Basarin et al. (2016) for PET conditions during HW in Northern Serbia. The PET values found during CW in Bahía Blanca are barely distinguishable from those found by Basarin et al. (2016). Additionally, our analysis confirms previous findings regarding HW in Bahía Blanca, showing an increasing frequency and intensity between 1961 and 2020, with a peak between 2011 and 2020 (Fernández et al., 2022; Gentili & Fernández, 2024). This trend is consistent with other studies conducted in Argentina (Camilloni, 2018; Ferrelli et al., 2021; Rusticucci et al., 2015; Santágata et al., 2017) and Latin America (Cueto et al., 2010; Feron et al., 2019; Piticar, 2018). Regarding extreme heat events and thermal comfort in South America, Miranda et al. (2024) reported a significant increase in the annual number of hours under heat stress between 1979 and 2020, noting that the past 20 years (from 2000 onward) experienced not only more consecutive hours under heat stress than the previous two decades but also a higher persistence of such conditions.
The intra-urban variability of comfort aligns is in line with what was stated by Capelli de Steffens et al. (2005) in their previous analysis of comfort in Bahía Blanca. The moderating influence of the oceanic surface (associated with higher thermal inertia, higher evaporation and the land-sea breeze) (Royé et al. 2012) decreases the daily PET thermal amplitude in the estuary (Capelli de Steffens et al. 2005). The greater thermal comfort of coastal environments justifies their promotion as leisure spaces within the urban fabric, as previously stated by Fernández and Gentili (2021a). Several authors analyzing comfort variability in urban areas worldwide have reached similar conclusions, observing differential comfort values across rural areas, peri-urban zones, urban centers, green areas, and areas adjacent to water bodies (Azimi et al., 2024; Çağlak & Toy, 2023; Cinar et al., 2023; Irmak et al., 2020; Matzarakis et al., 1999; Metin et al., 2024; Pecelj et al., 2021; Puliafito et al., 2013; Toy et al., 2023; Unger et al., 2017). This is consistent with previous studies that have verified the cooling effects of trees, grass and water on urban climate (Arabi et al., 2015; Gill et al., 2007; Middel et al., 2015; Norton et al., 2015; Pfautsch et al., 2020; Pfautsch & Tjoelker, 2020; Shahidan et al., 2012; Vásquez, 2016; Zhen et al., 2022). As stated by Oke et al. (2017), urban morphology and construction materials favor heat absorption. Buildings in urban central areas (where BBD is located) can be two or three times higher than the natural substrate, which generates a greater uptake of short-wave radiation between urban canyons and reduces the loss of long-wave radiation. These urban configurations also increase wind shelter, reducing sensible heat loss from turbulent flows (Oke et al., 2017). Consequently, soils and buildings heat up during the day, increasing both the stored heat and temperature in the city. Eleasing the stored heat and causing temperatures to drop. This mechanism explains the variability of comfort found in the city.
The analysis of diurnal comfort distribution across different seasons revealed that central areas of the city exhibit greater hourly variability in comfort conditions, characterized by lower PET values at night (night cooling) and higher values during the day. The prolonged duration of insolation during the summer season accentuates this phenomenon exacerbating thermal discomfort due to heat in central areas. In winter, longer nighttime duration and consequent nocturnal heat loss, increase thermal discomfort due to cold in BBD. These findings are consistent with previous studies on the urban heat island and cold island effect in the city (Capelli de Steffens et al., 2005). Furthermore, they relate to the prevalence of anthropogenic and stored heat in these areas (Fig. 1c) and the urban heat island phenomenon, as previously discussed by Fernández et al. (2021b) in their analysis of the Bahía Blanca UEB and supported by various researchers globally (Alexander et al., 2016; Christen & Vogt, 2004; Grimmond & Oke, 1995; Moreno et al., 2012; Offerle et al., 2003; Spronken-Smith, 2002). On the other hand, the coastal areas (BBE) present a lower hourly PET variability of PET, with comparatively higher values during the day. This is in good agreement with Fernández et al. (2021b), who stated that the Bahía Blanca estuary had the lowest magnitude of anthropogenic heat and the highest magnitudes of latent flux and stored sensitive heat. Similarly, findings by Ferrelli (2016) and Ferrelli et al. (2016), indicate that more densely built-up areas in Bahía Blanca were warmer and drier than the peri-urban and coastal areas.
6. Conclusions
The spatio-temporal variation of thermal comfort in Bahía Blanca during the period 1961-2020 and during extreme thermal episodes (HW-CW) at different scales was analyzed. Extreme heat stress could be observed mainly during December, January and February and extreme cold stress mainly in June, July and August. Due to its specific location and climatology, cold stress was more common in Bahía Blanca than heat stress. The thermal comfort sensation was lowest during the winter months and highest in the intermediate thermal seasons as well as during the summer. The daily bioclimatic diagram of Bahía Blanca showed a direct relationship with sunrise and sunset. The cold semester had a higher frequency of extreme cold stress conditions during the night and the early morning hours (between 10p.m. and 8a.m.). The warm half-year diagram showed the highest frequencies of hot stress conditions between 1p.m. and 5p.m.
During most of the HW, PET reached values above 41°C (extreme heat stress). In the last decade, all HW had a maximum PET above 43°C and up to 48.7°C. These conditions are unique to that period, showing that discomfort conditions resulting from the occurrence of HW have increased in recent years. During CW the minimum PET ranged between -8.3°C and -18.1°C (extreme cold stress). Between 1971-1980 and 1991-2000 the most extreme values of CW-related thermal cold discomfort were recorded.
At the local level, the variability of comfort in the city was tested. In the suburban area (BBA), thermal stress due to cold in winter was more severe than in coastal areas and the central area of the city and during summer, the thermal stress due to heat was less pronounced. In BBD, heat stress was more severe than in BBE and BBA in the central hours of the day and during summer. Coastal areas (BBE) experienced less cold stress during the night and less heat stress during the day. In the central areas, a more pronounced daily variability in comfort conditions was evident: citizens experience more cold stress at night and more heat stress during the day, a factor generated by urban building materials. Coastal areas show less diurnal variability, a factor defined by the moderating effect of the sea surface.
These results are an interesting contribution to the planning of thermally comfortable spaces. Among the possible measures to be implemented are highlighted the importance of promoting the use of coastal public green spaces and of improving urban green infrastructure to reduce mainly the frequency of heat stress during the day in the central areas of the city.
Author contributions
María Eugenia Fernández: Conceptualization; Data curation; Methodology; Formal analysis and investigation; Visualization; Writing - original draft. Jorge Osvaldo Gentili: Conceptualization; Methodology; Formal analysis and investigation; Visualization; Writing - review and editing; Supervision; Project administration; Funding acquisition.
Acknowledgments
To the following research projects: “Climatología y planificación urbana: aportes para la construcción de ciudades sostenibles y resilientes [24/ZG33] and “Geografía Física Aplicada al estudio de la interacción sociedad-naturaleza. Problemáticas ambientales a diferentes escalas témporo-espaciales” research projects, [24/G092], both with the subsidy of the Secretaría General de Ciencia y Tecnología, Universidad Nacional del Sur. To the “Playas de estacionamiento y problemáticas ambientales urbanas: estudio para la definición y propuesta de medidas sustentables en ciudades medias” [PIP 11220200100032] research proyect, with the subsidy of the Consejo Nacional de Investigaciones Científicas y Técnicas (CONICET). To the Servicio Meteorológico Nacional (SMN) of Argentina for providing the official records to perform this work.

