




 Inglês (pdf)
 Artigo em XML
 Referências do artigo
 Tradução automática
 Enviar este artigo por email
 Citado por SciELO
  Similares em
SciELO
Similares em
SciELO 
 Permalink

Highlights
Determined spatial patterns of population ageing in Bosnia and Herzegovina.
Applied k-means clustering to identify spatial disparities in the level of population ageing in municipalities of Bosnia and Herzegovina.
Identified three distinct clusters with different levels of population ageing.
Determined that Bosnia and Herzegovina is facing adverse population ageing trends.
Results of the study can be used as a basis for future demographic research and suggest the necessity of creating regional strategies of demographic development in Bosnia and Herzegovina.
1. Introduction
Population ageing can be considered a global phenomenon characterized by an increasing proportion of the population older than 65 years of age in populations worldwide. In the past decades, the issue of population ageing has received attention from numerous authors. Studies of importance highlight that global population ageing is a consequence of declining fertility rates and increasing life expectancy (Kong, 2018), while Lo (2023) and Zlotnik (2016) highlight the influence of globalisation, or economic, political, and social changes caused by globalisation, on population ageing. Europe is among areas with high levels of ageing (Cristea et al., 2021; Kočanova et al., 2023), and recent studies of demographic ageing in Europe suggest a significant increase in population ageing indicators in the countries of Southeastern and Eastern Europe (Jakovljevic et al., 2021; Jakovljevic & Laaser, 2015). Therefore, a considerable number of studies explored the trends of population ageing in countries of the region. Gabor et al. (2022) and Jemna and David (2021) have researched the demographic ageing trends in Romania, Lillova (2021) in Bulgaria, Roszkowska (2018) in Poland, Gnjatovic and Devedzic (2016) in Serbia, etc. Several studies have been conducted on population ageing in Bosnia and Herzegovina that highlight the challenges caused by this demographic process. Gekić et al. (2020) and Gekić et al. (2019) reported a rapid increase in elderly population, which poses challenges to the economic and social system and causes serious issues for the demographic development of Bosnia and Herzegovina. Kadušić et al. (2016) researched the causes and consequences of population ageing in Bosnia and Herzegovina and noticed a rapid decline in population bio-dynamics and an increase in ageing coefficients and the average age of the population.
Recent studies have shown that population ageing is accelerating with spatial and temporal disparities in different world regions (Li et al., 2019; Wan et al., 2022;). Therefore, researchers have shown an increased interest in spatial disparities or regional differences in population ageing. Wan et al. (2022) investigated population ageing on a global scale, noticing significant regional disparities in ageing patterns, with developed countries ageing faster, while Li et al. (2019) have reported that differences in ageing rates in world countries have been increasing, suggesting that global population ageing is becoming more spatially differentiated. In Turkey, Yakar and Özgür (2024) analysed ageing patterns and identified regions with different levels of ageing. Basile et al. (2023) addressed the spatial-temporal aspect of population ageing in Italy and identified how ageing varies across different regions of the country. Zhang et al. (2022) reported that the spatial distribution of the population in Jiangsu Province in China is also showing significant spatial discrepancy, etc. In Bosnia and Herzegovina, Avdic and Avdic (2023) analysed spatial disparities in regional development and noted significant demographic challenges in peripheral regions of this country, while Avdić et al. (2022) noticed that population ageing has more adverse characteristics in border regions of Bosnia and Herzegovina. Kadušić et al. (2023a) analysed the spatial distribution of ageing coefficient and ageing index, and research results confirmed the concentration of these indicators, suggesting unequal ageing in different areas of Bosnia and Herzegovina. Pronounced polarization of demographic development and population ageing, at the national, regional, and local levels in Bosnia and Herzegovina, is also mentioned in the research study by Gekić et al. (2019) highlighting the necessity for adopting adequate population policy for future demographic development.
Therefore, population ageing is a demographic process with pronounced spatial differences, and peripheral areas are very often exposed to more adverse ageing trends (Krisjane et al., 2023). In recent years numerous conducted studies applied cluster analysis to identify spatial patterns of demographic processes and phenomena, including population ageing (Ahmadov, 2023; Jurun et al., 2017; Yakar & Özgür, 2024). According to Kastreva and Patarchanova (2021), clustering is a process of classifying data into clusters, while the clustering method can be defined as a technique used for grouping statistical data based on similarities in variables.
Various techniques were used to research or determine spatial disparities in population ageing, and in recent studies, k-means clustering is often recognized as a very useful technique for determining spatial differences in ageing (Abbas et al., 2020; Jurun et al., 2017; Yakar & Özgür, 2024). According to Rašić-Bakarić (2007) in social sciences cluster analysis is recognized as the most suitable method of classifying units of similar characteristics, while Ismail et al. (2016) indicate that k-means clustering can effectively identify spatial patterns in demographic ageing. In recent years, k-means clustering has been often applied in demographic analysis and in researching spatial disparities of population ageing. For example, Inoue and Inoue (2024) applied the k-means algorithm to analyse prospects of population ageing in Japan, Yakar and Özgür (2024) used this technique to identify distinct ageing regions in Turkey, while Ismail et al. (2016) utilized k-means to investigate the demographic change in Malaysia, etc. Together these studies provide important insights into the utilization of k-means clustering in identifying spatial patterns of ageing.
Previous research on population ageing in Bosnia and Herzegovina has primarily focused on descriptive analysis at the national level (Gekić et al., 2020; Kadušić et al., 2016). Only a few studies addressed spatial differences in this demographic process (Avdic & Avdic, 2023; Avdić et al., 2022; Gekić et al., 2019). While Kadušić et al. (2023a) used spatial autocorrelation to analyse the clustering of population ageing indicators, there is a lack of studies that used advanced spatial statistical techniques to identify spatial differences in demographic ageing in Bosnia and Herzegovina.
This study aims to address this research gap by applying k-means clustering to identify population ageing patterns on municipal level in Bosnia and Herzegovina. The Elbow method, Calinski-Harabasz pseudo F-statistic, and Tukey`s Honestly Significant Difference test will be used to validate the number of clusters and determine differences between ageing clusters. This approach offers a new perspective in demographic research in Bosnia and Herzegovina by applying a non-hierarchical multivariate statistical method to determine spatial disparities in ageing and the effect of spatial factors on the ageing process. Accordingly, the study addresses the following questions: Are there areas in Bosnia and Herzegovina particularly vulnerable to adverse population ageing? Which regions and municipalities are experiencing the highest levels and rates of ageing? Is there an evident clustering of the ageing process? What are the potential causes of the current spatial distribution of ageing? What are the next steps in spatial demographic development of the country? What implications do spatial disparities have for regional development in Bosnia and Herzegovina?
By addressing these questions, this study contributes to the understanding of a spatial aspect of population ageing in Bosnia and Herzegovina. The findings of the study can be useful for spatial and strategic planning of regional development in Bosnia and Herzegovina, supporting the development of measures to address economic and social issues caused by the ageing process, particularly in regions affected by adverse population ageing.
2. Theoretical background: spatial demography and clustering approaches to population ageing analysis
Population ageing research has experienced a theoretical expansion, moving beyond analyses at the national level. As a result, numerous studies explore spatial and regional differences in this demographic phenomenon (Yakar & Özgür, 2024; Zhang et al., 2022). Indicators of the ageing process, such as the ageing coefficient, ageing index, dependency ratio, average age, etc., provide insight into the intensity of population ageing (Harasty & Ostermeier, 2020; Nejašmić, 2005; Wu et al., 2021). Spatial-demographic research indicates that the geographic distribution of these ageing indicators is not uniform, and that the ageing process is a complex demographic process shaped by physical and social features of the geographic environment, natural population change, migration processes, socio-economic, and other factors (Káčerová et al., 2014; Li et al., 2019).
In Bosnia and Herzegovina, the level of population ageing is also influenced by geographic location and exhibits spatially uneven patterns. Research by Kadušić et al. (2023a) showed that certain municipalities in the western, northwestern, central, and northeastern regions of the country demonstrate clustering in terms of the value of the ageing index and the ageing coefficient, and suggests that geographical factors play a key role in the ageing process and adverse demographic trends. Similarly, the research of Gekić et al. (2019) identified a pronounced demographic polarization between urban and rural municipalities in Bosnia and Herzegovina. In addition, the peripheral and border areas of Bosnia and Herzegovina are faced with a more intensive ageing process, higher emigration rate, and less favourable socio-economic conditions (Avdic & Avdic, 2023; Avdic et al., 2022). Therefore, these findings indicate that the process of population ageing in Bosnia and Herzegovina is not random but spatially determined, with clear grouping patterns influenced by geographic and socio-economic factors.
The concept of spatially uneven population ageing is present and widely researched in numerous countries of the world. In Turkey, Yakar & Özgür (2024) used data on the total population, age and gender features of the population, birth rates, and migration to separate regions concerning the intensity of ageing. In Japan, Inoue & Inoue (2024) introduced the concept of "stages of population ageing" using the data of the elderly population proportion and the elderly population change index at the municipal level to determine ageing clusters. These studies have shown that advanced techniques of spatial analysis and spatial statistics can reveal hidden demographic structures and patterns, and indicate early signs of negative demographic trends in potentially threatened regions.
One of the more effective methods for identifying spatial patterns of demographic phenomena is cluster analysis, which groups spatial units based on the similarity of data of selected variables (Kastreva & Patarchanova, 2021), while in the social sciences, it is recognized as an effective method for classifying territorial units according to the values of demographic characteristics (Rašić-Bakarić, 2007). Among cluster analysis techniques, k-means clustering is a machine learning algorithm particularly popular due to its simplicity, efficiency, and interpretability of results (Ahmed et al., 2020). It is a non-hierarchical multivariate statistical method that groups data into a certain number of clusters so that values in each cluster are more similar than values in other clusters (Hassan et al., 2021).
The number of studies in which k-means clustering was used indicates the relevance of this technique in demographic research. Abbas et al. (2020) indicated the effectiveness of the k-means algorithm in identifying spatial patterns of fertility, which is indirectly related to the future dynamics of population ageing in Muzaffarabad (Kashmir). Ismail et al. (2016) applied the same technique to estimate the demographic transition in Malaysia, highlighting its simplicity and effectiveness in analyzing demographic data. In particular, the studies of Yakar and Özgür (2024) and Inoue and Inoue (2024) should be highlighted, which indicated the effectiveness of the method in determining different levels of ageing from a spatial aspect. The k-means clustering approach allows, not only mapping the proportion of the old population, but also the understanding of factors that cause spatial patterns of ageing.
However, the efficiency of k-means clustering largely depends on the initial selection of the centroid and the predetermined number of clusters, and the selection of the appropriate number of clusters is crucial for achieving optimal clustering results (Hassan et al., 2021; Matsuga & Sheremet, 2023). Elbow method, Calinski-Harabasz pseudo F-statistic and Tukey's Honestly Significant Difference test are techniques that can be used to determine the optimal number of clusters and their validation (Hassan et al., 2021; Wang & Xu, 2019). The mentioned techniques reduce the subjectivity of the analysis and improve the reliability of data grouping, but they can be sensitive to data distribution, number of clusters, outliers, and other factors.
Spatial-demographic research provides a framework for understanding the spatial dimension of demographic processes. The integration of the spatial aspect with the methods of spatial statistics and cluster analysis enables the determination of complex patterns of demographic development in the research area. Complex administrative arrangements, and complex political, economic, and social conditions in Bosnia and Herzegovina contribute to uneven regional development. Therefore, the results of spatial-demographic research can serve as a basis for creating evidence-based strategies for demographic development of Bosnia and Herzegovina.
3. Data and methods
According to Anselin (2005), k-means is a clustering algorithm used in data science and machine learning that classifies data into k-distinct clusters based on feature similarities. It is a multivariate non-hierarchical statistical method used for determining groups or clusters by minimizing within-cluster distance and maximizing between-cluster distance (Fahmiyah & Ningrum, 2023). An important step in k-means clustering is the identification of the optimal number of clusters. Different approaches can be used, e.g., the rule of thumb, elbow method, information criterion approach, information-theoretic approach, silhouette method, cross-validation, etc. (Kodinariya & Makwana, 2013).
To understand complex demographic patterns of population ageing in Bosnia and Herzegovina k-means clustering was applied. K-means clustering enables the identification of trends and characteristics that are not apparent when using analytical methods. As stated by Inoue and Inoue, (2024) cluster analysis helps define demographically homogenous groups of ageing by dividing larger areas into smaller and uniform clusters. This way it is easier to understand specific characteristics and trends of population ageing. Moreover, k-means clustering can be performed on multiple indicators or variables, which allows more comprehensive analysis considering various dimensions of the data.
Therefore, k-means clustering was specifically chosen for this study because multiple demographic indicators of ageing can be used in the analysis. It enables the identification of regions with varying levels of ageing allowing comparison between clusters to identify potential causes or factors of the uneven ageing process and complex spatial relationship between demographic processes. Furthermore, it is one of the more practical ways to identify municipalities with extreme ageing trends, while the results of the analysis can be useful to policymakers. However, Chong (2021) and Ahmed et al. (2020) noted that k-means clustering has certain limitations, including the necessity of the pre-defined number of clusters, sensitivity to initial positions of centroids, outliers can affect centroids and skew clusters, etc.
The quantitative and exploratory study of spatial disparities of population ageing in Bosnia and Herzegovina involves statistical data from publications and sources of statistical agencies in this country. Ageing coefficient, ageing index, dependency ratio, old-age dependency ratio, and average age were used as indicators of demographic ageing. The ageing coefficient is a share of the population aged 65 and over in the total population, and ageing index is the ratio of the population older than 65 years per 100 young people (0 to 14 years of age). Young-age dependency ratio can be defined as the number of young people (0-14 years) per 100 people of working age, the old-age dependency ratio as the number of people 65 years or older per 100 people of working age, while the sum of both indicators is defined as a total dependency ratio (Harasty & Ostermeier, 2020; Pekarek, 2018). The average age is the arithmetic mean of age within a specific population (Nejašmić, 2005). Data for mentioned indicators were analysed for the period 2013-2023 at the municipal level, and collected from the Agency for Statistics of Bosnia and Herzegovina (BHAS), Institute for Statistics of the Federation of Bosnia and Herzegovina (FZS), and the Republic of Srpska Institute of Statistics (RZSRS). Using official data ensured the reliability and validity of the analysis.
The first step of the analysis was cleaning and preparing data for cluster analysis by removing errors, inconsistencies in the data, and outliers (fig. 1). Bosnia and Herzegovina has several municipalities with a very small population, which affected ageing indicators indexes and the cluster analysis. Therefore, a winsorization of the data was performed after the initial clustering of the data. Winsorization is a statistical technique used to limit the influence of extreme values or outliers on the statistical analysis of the data (Hamadani et al., 2021).
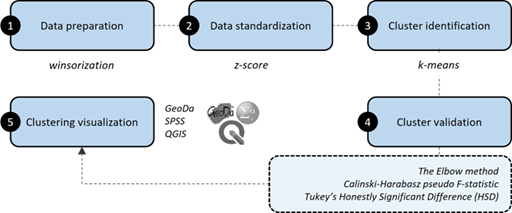
To enhance data accuracy, extreme values in the dataset were replaced with 1st and 99th percentile. Values below the 1st percentile were replaced with that percentile value, and values above the 99th percentile were set to that upper percentile value.
The second step of the analysis was standardization of the data which is necessary for effective cluster analysis and significantly affects the identification of clusters (Nogueira & Munita, 2020, 2021). Z-score standardization is a statistical technique used to transform the data into a standardized normal distribution (Al-Mekhlafi et al., 2024), and it is applied in this study to manage diverse scales of ageing indicators to ensure that indicators equally contribute to the distance calculations used in k-means clustering algorithm. Therefore, standardization equalizes the influence of variables with different units and scales, preserves the distance structure, and maintains the distribution of the data.
The next step in the analysis was cluster validation since k-means clustering requires a predefined number of clusters (fig. 1). The Elbow method, Calinski-Harabasz pseudo F-statistic, and Tukey`s Honestly Significant Difference (HSD) test were used as the statistical validation techniques to determine the optimal number of clusters. The analysis was performed in GeoDa and SPSS by testing various alternatives between 2 and 5 clusters. Although the Elbow method has certain limitations and can be subjective in determining the optimal number of clusters (Morissette & Chartier, 2013), it is a widely utilized technique for determining optimal number of clusters in k-means clustering by identifying the point where the sum of squared distances between points and cluster centroids shows no significant decrease (Marisa et al., 2023; Matsuga & Sheremet, 2023).
The Elbow method can be applied by plotting the sum of squared errors (SSE) against the number of clusters (k) and identifying the point where the SSE starts to decrease (Fahmiyah & Ningrum, 2023; Hassan et al., 2021). Calinski-Harabasz pseudo F-statistic or Calinski-Harabasz Index can be useful in identifying the optimal number of clusters, especially when combined with other techniques (Wang & Xu, 2019; Zhang & Li, 2013). It is a measure used in cluster analysis to identify the significance and quality of clusters by comparing the ratio of between-cluster dispersion (how separated identified clusters are) to within-cluster dispersion (how similar or close data points are within a cluster), and higher values of F-statistic indicate more distinct and well-separated clusters (Ashari et al., 2023; Hassan et al., 2021).
After the identification of the optimal number of clusters, a post-hoc analysis was conducted using Tukey's Honestly Significant Difference (HSD) test to validate the difference between cluster means (Wang, 2024). Tukey's HSD test is a post-hoc statistical test used to make pairwise comparisons between means of different clusters after the analysis of variance is performed, and the assumption of equal variances is met. According to Yakar and Özgür (2024), this test is used after the analysis of variance indicated that there are significant differences between clusters’ means. This test calculates the difference between each pair of means and compares it to a critical value that is based on the number of clusters, the total number of observations, and the desired confidence level. This test is useful in determining how identified clusters are significantly different from one another, and validating the relationship and findings in data by confirming that the results are statistically significant and not the result of random chance.
The presented methodological framework ensures the reliability of the research findings and provides a foundation for future research analysis of population ageing. The results of the clustering will be visualized in GeoDa, QGIS, and SPSS using maps, charts, and tables allowing for a clearer understanding of the ageing spatial patterns in Bosnia and Herzegovina and the application of k-means clustering in the analysis of population ageing.
4. Results
4.1 Demographic Characteristics of Bosnia and Herzegovina
Bosnia and Herzegovina is a Southeast European country with access to the Adriatic Sea along a 21.2 kilometres coastal stretch in the area of the Neum Bay. Its main administrative, educational, political and healthcare centre is the capital city of Sarajevo. Bosnia and Herzegovina represents a unique case within the European space, having undergone profound and multidimensional transformations over the past three decades.
The dissolution of Yugoslavia and the subsequent war from 1992 to 1995 acted as both direct and indirect catalysts for significant shifts in the country's demographic and socioeconomic development. This period was marked by an induced demographic transition, resulting in persistently low and, more recently, negative natural population change rates, as well as an intensive wave of emigration, particularly pronounced in the recent period. The transition from a planned to a market-based economy has brought numerous structural challenges. Bosnia and Herzegovina’s current development is further shaped by complex European integration processes, the limited functionality of its administrative-territorial organization and socioeconomic spatial disparities, all of which make it a compelling subject for demographic and socioeconomic analysis.
With a Gross Domestic Product (GDP) per capita of approximately 7500 USD in 2022 (Agency for Statistics of Bosnia and Herzegovina [BHAS], 2023), the country is categorized as upper middle income; however, ongoing issues such as high youth unemployment, depopulation and population ageing, as well as the pressing need for the reorganization of health and education infrastructure, pose the relevance of such research for much needed policymaking measures. Analysing spatial disparities in population ageing contributes not only to the national planning agenda but also offers significant insight for broader European strategies aimed at eliminating the asymmetric impacts of demographic ageing across regions with diverse historical, political and institutional legacies.
Bosnia and Herzegovina has been witnessing significant demographic changes in the first decades of the 21st century (Avdić et al., 2022; Gekic et al., 2020). Those changes are characterized by decreasing birth rates, increasing death rates, emigration of the young population, and intensive population ageing (Gekić et al., 2019; Kadušić et al., 2023b). A primary cause of population ageing in numerous world countries is a significant decline in fertility rates, which are below replacement levels, and the increase in life expectancy, caused by improvements in healthcare and living conditions (Li et al., 2019; Zhang et al., 2022). The analysis revealed similar demographic trends in Bosnia and Herzegovina in the period 2013-2023. In this period in Bosnia and Herzegovina, fertility rates continued decreasing from 37.5‰ to 34.9‰, mortality rates increased from 10.1‰ to 10.5‰, and average age increased from 39.6 to 42.5 years (table I).
Table I Basic demographic indicators in Bosnia and Herzegovina in 2013 and 2023.
| Demographic indicator | 2013 | 2023 |
| Birth rate (‰) | 8.7 | 7.7 |
| Mortality rate (‰) | 10.1 | 10.5 |
| Natural population change (‰) | -1.4 | -2.7 |
| Fertility rate (‰) | 37.5 | 34.9 |
| Total fertility rate (TFR) | 1.276 | 1.182 |
Source: Authors’ elaboration based on BHAS, FZS, RZSRS (2013-2024)
The data presented in table I indicate that the birth rate has been declining, while the mortality rate has been increasing in the period from 2013 to 2023. The negative rate of natural population change ranged from -1.4‰ to -2.7‰, the total fertility rate declined from 1.276 to 1.182, while the average age of mothers at the birth of their first child rose from 26.69 to 28.13 years.
According to Gekić et al. (2019), the demographic development of Bosnia and Herzegovina in the early 21st century is marked by depopulation and adverse population ageing, accompanied by pronounced spatial, regional, and urban-rural polarization. Population ageing is a demographic process with significant spatial disparities. As observed by Basile et al. (2023) population ageing varies across regions, while Yakar and Özgür (2024) noted that urban and rural areas very often exhibit different ageing patterns, and according to Wan et al. (2022) findings, spatiotemporal differences in population ageing are mostly caused by socio-economic and environmental factors.
Descriptive statistical analysis of ageing indicators pointed to adverse demographic ageing trends in Bosnia and Herzegovina during the study period. Table II presents the data on basic ageing indicators in Bosnia and Herzegovina in a period from 2013 to 2023.
A notable trend is that all ageing indicators show a consistent increase in this period. Ageing coefficient increased from 14.4% to 19.2%, ageing index from 93.5% to 141.8%, the dependency ratio from 42.5% to 48.5%, the old-age dependency ratio from 20.5% to 28.4%, and the average age increased from 39.6 to 42.5 years, indicating advanced demographic ageing at the national level, highlighting the increase in the share of the elderly in the total population of Bosnia and Herzegovina.
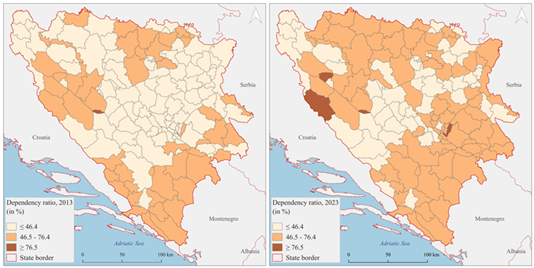
To visualize the changes in the ageing process in Bosnia and Herzegovina, data for three key ageing indicators (ageing coefficient, ageing index and dependency ratio) are classified in QGIS into three groups (fig. 2, fig. 3 and fig. 4).
Table II Ageing coefficient, ageing index, dependency ratio, old-age dependency ratio and average age in Bosnia and Herzegovina (2013-2023).
| Year | Ageing coefficient | Ageing index | Dependency ratio | Old-age dependency ratio | Average age |
| 2013 | 14.4 | 93.5 | 42.5 | 20.5 | 39.6 |
| 2014 | 14.8 | 97.7 | 42.7 | 21.1 | 39.9 |
| 2015 | 15.3 | 101.8 | 43.1 | 21.7 | 40.3 |
| 2016 | 15.3 | 105.9 | 43.4 | 22.3 | 40.6 |
| 2017 | 16.0 | 110.3 | 43.9 | 23.0 | 40.8 |
| 2018 | 16.6 | 115.5 | 44.9 | 24.1 | 41.1 |
| 2019 | 17.2 | 120.5 | 45.8 | 25.0 | 41.4 |
| 2020 | 17.8 | 126.5 | 46.8 | 26.1 | 41.7 |
| 2021 | 18.1 | 130.2 | 47.2 | 26.7 | 41.9 |
| 2022 | 18.6 | 135.1 | 47.8 | 27.5 | 42.2 |
| 2023 | 19.2 | 141.8 | 48.5 | 28.4 | 42.5 |
Source: Authors’ elaboration based on BHAS, FZS, RZSRS (2013-2024)
Classification of ageing coefficient, ageing index, and dependency ratio values suggest significant changes in ageing in period from 2013 to 2023 (figs. 2, 3 and 4). It is visible that ageing is present in a large part of Bosnia and Herzegovina, and significantly varies across time and space. Data visualized in figure 2 suggest that most of the municipalities of Bosnia and Herzegovina have reached the moderate and advanced stage of ageing by 2023, and only a few municipalities have an early-stage ageing coefficient, which varies between 7.3% and 14.6%. The value of ageing index also indicates highly adverse demographic trends in Bosnia and Herzegovina, as well as spatial disparities in demographic development.
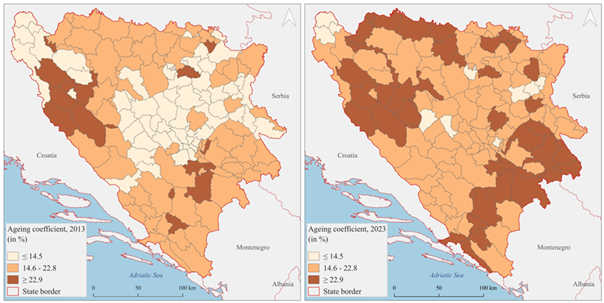
Fig. 2 Spatial distribution of ageing coefficient in Bosnia and Herzegovina, 2013 and 2023. Source: Authors’ elaboration
Figure 3 shows that the value of this index exceeds 100% in many municipalities across the country. Data presented in figure 4 indicate that the dependency ratio increased in a large number of municipalities of Bosnia and Herzegovina in the researched period. All mentioned ageing indicators reveal temporal and spatial changes in the ageing process across Bosnia and Herzegovina in the period from 2013 to 2023. Over researched period, numerous municipalities have transitioned to moderate or advanced stages of ageing, with notable spatial differences.
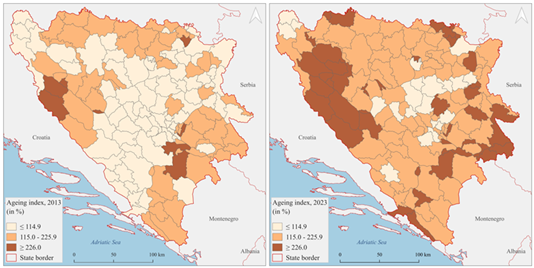
Fig. 3 Spatial distribution of ageing index in Bosnia and Herzegovina, 2013 and 2023. Source: Authors’ elaboration
4.2 Cluster Analysis of Population Ageing in Bosnia and Herzegovina
Performed cluster analysis, with the following statistical validation techniques, indicated several interesting observations and outcomes related to spatial patterns of population ageing during the study period in Bosnia and Herzegovina. To determine the optimal number of clusters with different levels of ageing in the Bosnia and Herzegovina Elbow method, the Calinski-Harabasz F-pseudo statistic, and Tukey`s Honestly Significant Difference (HSD) test were applied. To define the optimal number of ageing clusters in Bosnia and Herzegovina SSE was determined for 2k (324.28), 3k (215.18), 4k (164.71), and 5k (130.26). Therefore, the optimal ageing clusters in Bosnia and Herzegovina are three. However, according to Inoue and Inoue (2024) and Hassan et al. (2021) one of the challenges of the Elbow method is the difficulty in precisely identifying the elbow point. Therefore, additional statistical tests, Calinski-Harabasz pseudo F-statistic and Tukey`s HSD test were performed to validate identified three ageing clusters. Calinski-Harabasz pseudo F-statistic was determined for every variable or ageing indicator in the defined three clusters.
Calinski-Harabasz Index is used to assess the quality of clustering by measuring the ratio of the sum between-cluster dispersion to within-cluster dispersion (Wang, 2024). It assesses the quality of the clustering by evaluating how well identified clusters are separated, and how compact data within clusters are. Higher values of the Calinski-Harabasz pseudo F-statistic indicate better clustering with well-separated and compact clusters.
The F-values presented in table III are all relatively high and indicate significant between-cluster variance compared to within-cluster variance. This confirms that the identified ageing clusters are well separated. Variables with higher F-values (ageing coefficient, old-age dependency ratio, and average age) contribute more to the separation of clusters than those variables with lower F-statistic (ageing index and dependency ratio). Moreover, p-values for all ageing indicators are <0.05, which confirms that the differences in means between clusters for each ageing indicator are statistically significant.
Table III Calinski-Harabasz pseudo F-statistic for selected ageing indicators in Bosnia and Herzegovina, 2023.
| Variable | Cluster | Error | F | Sig. | ||
|---|---|---|---|---|---|---|
| Mean Square | df | Mean Square | df | |||
| Ageing coefficient | 57.160 | 2 | .198 | 140 | 289.108 | .000 |
| Ageing index | 41.773 | 2 | .418 | 140 | 100.049 | .000 |
| Dependency ratio | 41.479 | 2 | .422 | 140 | 98.355 | .000 |
| Old-age dependency ratio | 56.196 | 2 | .211 | 140 | 265.714 | .000 |
| Average age | 50.773 | 2 | .289 | 140 | 175.716 | .000 |
Source: Authors’ elaboration
After analysis of variance has been performed and F-statistic was determined, the post-hoc Tukey's Honestly Significant Difference (HSD) test was applied, given that the assumption of equal variances was met (table III). Post-hoc test results presented in table IV confirm that the absolute difference between clustersʼ means is greater than a critical value, and consequently, the difference between clusters can be considered statistically significant. Pairwise comparisons between clusters show statistically significant differences in population ageing indicators at the 0.01 level. These results confirm distinct clusters with significant differences in ageing variables between all pairs of clusters.
The results of k-means clustering and the results of performed cluster validation tests indicate that the clustering was effective in capturing ageing patterns, and identified clusters are valid and useful for further population ageing analysis in Bosnia and Herzegovina. Visualization of clusters performed in GeoDa and QGIS indicates three distinct clusters with different levels of population ageing in Bosnia and Herzegovina.
Figure 5 shows three ageing clusters in Bosnia and Herzegovina with different levels of ageing. Cluster 1 represents the highest values across all variables or advanced levels of ageing. Cluster 2 represents the lowest values across all ageing indicators or municipalities with a lower stage of ageing. Cluster 3 represents medium values across all ageing indicators or municipalities with a moderate level of ageing. The ratio between the cluster sum of squares (494.825) to the total sum of squares (710) is 0.6969, which indicates that about 69.69% of the variance in the data is explained by the performed clustering.
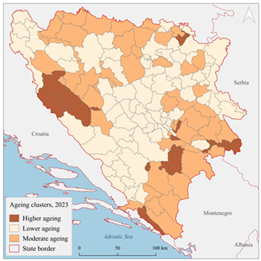
Table IV Tukey`s Honestly Significant Difference (HSD) test for ageing indicators in Bosnia and Herzegovina, 2023.
| Dependent Variable | (I) Cluster Number of Case | (J) Cluster Number of Case | Mean Difference (I-J) | Std. Error | Sig. | 99% Confidence Interval | |
|---|---|---|---|---|---|---|---|
| Lower Bound | Upper Bound | ||||||
| Ageing coefficient | 1 | 2 | 2.77167552* | .12893786 | .000 | 2.3898064 | 3.1535446 |
| 3 | 1.51414493* | .13444899 | .000 | 1.1159538 | 1.9123361 | ||
| 2 | 1 | -2.77167552* | .12893786 | .000 | -3.1535446 | -2.3898064 | |
| 3 | -1.25753060* | .08035499 | .000 | -1.4955141 | -1.0195470 | ||
| 3 | 1 | -1.51414493* | .13444899 | .000 | -1.9123361 | -1.1159538 | |
| 2 | 1.25753060* | .08035499 | .000 | 1.0195470 | 1.4955141 | ||
| Ageing index | 1 | 2 | 2.61735020* | .18737233 | .000 | 2.0624185 | 3.1722819 |
| 3 | 1.97062270* | .19538108 | .000 | 1.3919719 | 2.5492735 | ||
| 2 | 1 | -2.61735020* | .18737233 | .000 | -3.1722819 | -2.0624185 | |
| 3 | -.64672750* | .11677177 | .000 | -.9925649 | -.3008901 | ||
| 3 | 1 | -1.97062270* | .19538108 | .000 | -2.5492735 | -1.3919719 | |
| 2 | .64672750* | .11677177 | .000 | .3008901 | .9925649 | ||
| Dependency ratio | 1 | 2 | 2.28709437* | .18831284 | .000 | 1.7293772 | 2.8448115 |
| 3 | 1.14395877* | .19636180 | .000 | .5624034 | 1.7255141 | ||
| 2 | 1 | -2.28709437* | .18831284 | .000 | -2.8448115 | -1.7293772 | |
| 3 | -1.14313560* | .11735790 | .000 | -1.4907089 | -.7955623 | ||
| 3 | 1 | -1.14395877* | .19636180 | .000 | -1.7255141 | -.5624034 | |
| 2 | 1.14313560* | .11735790 | .000 | .7955623 | 1.4907089 | ||
| Old-age dependency ratio | 1 | 2 | 2.78878816* | .13335480 | .000 | 2.3938376 | 3.1837387 |
| 3 | 1.58668744* | .13905471 | .000 | 1.1748557 | 1.9985191 | ||
| 2 | 1 | -2.78878816* | .13335480 | .000 | -3.1837387 | -2.3938376 | |
| 3 | -1.20210072* | .08310766 | .000 | -1.4482367 | -.9559647 | ||
| 3 | 1 | -1.58668744* | .13905471 | .000 | -1.9985191 | -1.1748557 | |
| 2 | 1.20210072* | .08310766 | .000 | .9559647 | 1.4482367 | ||
| Average age | 1 | 2 | 2.69469286* | .15587505 | .000 | 2.2330452 | 3.1563406 |
| 3 | 1.60554375* | .16253753 | .000 | 1.1241641 | 2.0869234 | ||
| 2 | 1 | -2.69469286* | .15587505 | .000 | -3.1563406 | -2.2330452 | |
| 3 | -1.08914911* | .09714244 | .000 | -1.3768512 | -.8014470 | ||
| 3 | 1 | -1.60554375* | .16253753 | .000 | -2.0869234 | -1.1241641 | |
| 2 | 1.08914911* | .09714244 | .000 | .8014470 | 1.3768512 | ||
Source: Authors’ elaboration. *. The mean difference is significant at the 0.01 level
These results suggest moderate to good clustering results since almost 70% of the variability of the data can be explained by the differences between clusters, while the remaining 30% is the variability due to differences within the clusters. This indicates well-separated and effective clusters that capture a substantial portion of the total variance in the data.
It can be seen from the data in table V that the performed clustering reported significantly different ageing levels in identified clusters. In Cluster 1 ageing coefficient varies from 29.3 to 38.6%, the ageing index from 252.5 to 799.0%, the dependency ratio from 53.1 to 90.0%, the old-age dependency ratio from 44.9 to 72.9%, and the average age from 48.7 to 54.7 years. This cluster consists mostly of rural municipalities with small populations, which have the most adverse population ageing trends or advanced ageing. Cluster 1 comprises 14 cases, and is the least represented ageing cluster which includes municipalities Bosansko Grahovo, Donji Žabar, Drvar, Istočni Mostar, Istočni Stari Grad, Glamoč, Kalinovik, Kupres-RS, Novo Goražde, Pelagićevo, Petrovac, Ravno, Rudo and Trnovo-RS.
Table V Descriptive statistics of ageing indicators by identified ageing clusters in Bosnia and Herzegovina, 2023.
| Cluster Number of Case | Ageing coefficient | Ageing index | Dependency ratio | Old-age dependency ratio | Average age | |
|---|---|---|---|---|---|---|
| Cluster 1 Higher ageing | Mean | 33.1 | 517.6 | 69.7 | 56.3 | 51.2 |
| N | 14 | 14 | 14 | 14 | 14 | |
| Std. Deviation | 2.8262 | 185.0829 | 12.8918 | 8.6885 | 1.9544 | |
| Sum | 462.6 | 7246.5 | 975.1 | 787.7 | 716.5 | |
| Minimum | 29.3 | 252.5 | 53.1 | 44.9 | 48.7 | |
| Maximum | 38.6 | 799.0 | 90.0 | 72.9 | 54.7 | |
| Cluster 2 Lower ageing | Mean | 17.8 | 145.4 | 44.5 | 25.8 | 42.1 |
| N | 79 | 79 | 79 | 79 | 79 | |
| Std. Deviation | 2.4652 | 46.4090 | 5.2802 | 4.1064 | 1.8609 | |
| Sum | 1405.1 | 11484.2 | 3514.1 | 2035.9 | 3326.9 | |
| Minimum | 12.8 | 77.9 | 32.9 | 17.4 | 38.4 | |
| Maximum | 21.7 | 295.8 | 57.3 | 32.7 | 45.9 | |
| Cluster 3 Moderate ageing | Mean | 24.7 | 237.4 | 57.1 | 38.9 | 45.8 |
| N | 50 | 50 | 50 | 50 | 50 | |
| Std. Deviation | 2.3091 | 107.7602 | 7.5785 | 5.0382 | 1.6784 | |
| Sum | 1235.5 | 11867.4 | 2853.1 | 1945.8 | 2288.8 | |
| Minimum | 21.0 | 141.5 | 32.9 | 27.8 | 42.7 | |
| Maximum | 28.9 | 799.0 | 72.7 | 49.2 | 49.2 | |
Source: Authors’ elaboration
On the other side, Cluster 2 includes municipalities with the lowest values of ageing indicators or municipalities that are in the lower stadium of ageing. In Cluster 2 ageing coefficient varies from 12.8 to 21.7%, the ageing index from 77.9 to 295.8%, the dependency ratio from 32.9 to 57.3%, the old-age dependency ratio from 17.4 to 32.7%, and the average age from 38.4 to 45.9 years. This cluster consists large number of urban municipalities of Bosnia and Herzegovina, including Banja Luka, Bihać, Bijeljina, Doboj, Gračanica, Gradačac, Mostar, Sarajevo, Široki Brijeg, Zenica etc. However, it is also visible that the entire Bosnia and Herzegovina is facing adverse ageing trends, except for a very small number of municipalities that have trends that are more favourable.
In many cases population ageing is associated with declining fertility rates, increasing life expectancy, and emigration (Yakar & Özgür, 2024), and these have been important factors of population ageing in Bosnia and Herzegovina in the last decades (Kadušić & Smajić, 2019; Kadušić et al., 2015). As already stated, in Bosnia and Herzegovina fertility rates have decreased from 37.5‰ to 34.9‰ in researched period, and lowest fertility rates and highest average age correlate with the values of ageing indicators in municipalities of Cluster 1 (Bosansko Grahovo, Donji Žabar, Pelagićevo, Novo Goražde, Istočni Mostar itd.) (BHAS, 2024). Migration also plays a significant role in population ageing in Bosnia and Herzegovina. According to data of Ministry of security of Bosnia and Herzegovina in 2023 about 2777 persons emigrated from Bosnia and Herzegovina to foreign countries, out of which 85% of them emigrated to Croatia, Austria, Germany and Slovenia. Data of Institute for Statistics of the Federation of Bosnia and Herzegovina indicate that on average about 3731 people emigrated from Bosnia and Herzegovina every year in the period 2013 to 2023 (FZS [Federation of Bosnia and Herzegovina], 2024). According to the same source most of the emigrants from the Federation of Bosnia and Herzegovina, for example, are aged from 20 to 40 years (45.7%).
5. Discussion
There is an increased interest in researching the phenomenon of population ageing, the causes and consequences of this process at the global (Guerin et al., 2015; Li et al., 2019; Sabri et al., 2022) and national level (Cristea et al., 2021; Jemna & David, 2021; Milena, 2022). Studies such as that conducted by Li et al. (2019) and Bucher (2014) showed that ageing rates are growing consistently on all continents, with Europe experiencing the highest pace of ageing.
Wan et al. (2022) findings reveal that socioeconomic and environmental factors are the main cause of global ageing, with significant geographical disparities. Research have shown spatiotemporal variation in population ageing (Li et al., 2019; Wan et al., 2022; Zhang et al., 2022), and a considerable amount of literature has been published on spatial disparities of population ageing in many world countries (Jukic & Khan, 2015; Reynaud et al., 2018; Wu et al., 2021).
Inoue and Inoue (2024) provided a quantitative analysis of Japan’s ageing population and introduced a new concept of stages in the population ageing process, Kočanová et al. (2023) reported relationships and patterns of ageing in European Union countries, and Chen et al. (2019) determined spatial disparities in population ageing across various regions in China. All these studies provided insights into various aspects of population ageing, including causes, consequences, and spatial differences.
Various methods have been used to analyze spatial disparities in population ageing, each offering unique insights and application (Kočanová et al., 2023; Zhang et al., 2022), and in recent years k-means clustering has been applied in several studies on the demographic variables, including population ageing (Inoue & Inoue, 2024; Yakar & Özgür, 2024). For instance, Yakar and Özgür (2024) identified ageing regions in Turkey using k-means clustering.
The aforementioned studies indicate that population ageing is a demographic trend that affects many world countries, including Bosnia and Herzegovina. Conducted population ageing studies in Bosnia and Herzegovina by Gekić et al. (2019) and Kadušić et al. (2016) indicate a significant increase of elderly in the total population. According to Pijalović et al. (2018) and Bošnjak (2016) elderly population is expected to increase in the future which will put additional pressure on the pension system, affecting economic growth and public spending. Since population ageing is a process with pronounced spatial differences, this study aimed to determine spatial disparities in population ageing, determine whether there is a grouping of population ageing data, record the municipalities that are in the advanced stage of ageing, and identify factors of spatial differences in population ageing in Bosnia and Herzegovina.
Previous studies of demographic development in Bosnia and Herzegovina have focused on demographic trends in general, and only a few studies have treated the issue of population ageing (Gekić et al., 2019; Kadušić et al., 2016), while Kadušić et al. (2023a) performed spatial analysis of population ageing in Bosnia and Herzegovina using spatial autocorrelation method. Therefore, this study aimed to provide a more comprehensive analysis of multiple ageing indicators using k-means clustering. Since one of the shortcomings of the k-means clustering method is determining the optimal number of clusters (Matsuga & Sheremet, 2023), the Elbow method is used for the identification of clusters (Hassan et al., 2021), while Calinski-Harabasz pseudo F-statistic and Tukey`s Honestly Significant Difference test were used to validate identified clusters (Fahmiyah & Ningrum, 2023; Hassan et al., 2021).
The results of this study contradict the assumption that demographic ageing in Bosnia and Herzegovina is uniform across different regions (Kadušić et al., 2016), unlike neighbouring Croatia where the ageing process is more spatially consistent (Nejašmić & Toskić, 2013). This highlights the need for targeted interventions to address spatial disparities of ageing in Bosnia and Herzegovina. The clustering of data on ageing coefficient, the ageing index, dependency ratio, old-age dependency ratio, and average age, for the period from 2013 to 2023, has revealed clusters with different values of analyzed ageing indicators. The entire Bosnian population is facing significant ageing with different levels of ageing across different areas of this country. Three clusters were identified with lower, moderate, and advanced ageing. These clusters indicate areas where the population is ageing more rapidly and the necessity for targeted policy interventions. As stated by Litra (2014) increase of the elderly in the total population puts a growing demand on the healthcare and pension system, and pressure on the public finances and the social system of a country. Since similar trends are evident in Bosnia and Herzegovina, many studies indicate an urgent policy change to ensure adequate living standards for the elderly and the economic stability of the country (Bošnjak, 2016; Pijalović et al., 2018).
According to Avdic & Avdic (2023) and Kadušić et al. (2023b), spatial disparities in demographic and socio-economic trends in Bosnia and Herzegovina are mostly caused by social, economic, and political factors. The most significant factors of uneven demographic development of Bosnia and Herzegovina are socio-economic factors (unemployment rate, unemployment rate of highly educated population, net salary, number of inhabitants per doctor, migration, etc.), political-social factors (political instability, social injustice, lack of trust in institutions, general feeling of insecurity), psychological factors (attitude of younger generations towards marriage, family, personal and professional ambitions, feminization of migration), administrative division of Bosnia and Herzegovina, urban-rural polarization, etc. (Begović et al., 2020; Efendić, 2016; Jahić et al., 2024).
Adverse population ageing is particularly present in Cluster 1, or in rural municipalities that are founded after the Dayton Peace Agreement, and are situated along the administrative entity border within Bosnia and Herzegovina. However, this research identified an exception to this general rule. Municipalities such as Tešanj, Teslić, Doboj, Doboj Jug, Doboj Istok, etc., despite being situated along entity lines, have more favourable demographic ageing trends. This implies that socio-economic factors like population size, human resources, unemployment rate, the unemployment rate of the population with a university degree, net salary, number of inhabitants per medical doctor, etc., play a significant role in demographic development in Bosnia and Herzegovina. Socioeconomic factors affect the living standard of the population and cause the emigration of the younger population to highly developed European countries (Efendic, 2016; Efendic et al., 2023; Lukić-Tanović & Marinković, 2024). As stated by Kadušić et al. (2023b) and Gekic et al. (2020) emigration of young and educated individuals aggravates the population ageing by reducing the proportion of the younger population.
Unfortunately, one of the limitations of this study is the availability of official statistical data on the demographics of Bosnia and Herzegovina. The last population census in Bosnia and Herzegovina took place in 2013, and consequently, there are no available demographic data on a settlement level. To carry out the clustering of data on the ageing process in Bosnia and Herzegovina, data on the municipal level were used, which contributes to the generalization of the data and can affect the clustering results. Furthermore, it was not possible to perform a spatial analysis of emigration by municipalities because there is no systematic and continuous monitoring of this demographic phenomenon in all areas of Bosnia and Herzegovina. The Republic of Srpska Institute of Statistics does not record and publish data on emigration by municipalities. However, existing data and recent studies all point that emigration is a serious issue for the present and future demographic development of Bosnia and Herzegovina (Avdić et al., 2022; Gekic et al., 2020).
Although data on emigration could not have been included in the analysis, the results obtained by this study indicate significant spatial differences in demographic trends in Bosnia and Herzegovina, including population ageing. This study is a novelty in a spatial approach to analyze multiple ageing indicators and identify spatial disparities in demographic ageing in Bosnia and Herzegovina. Furthermore, a 70% ratio of the between-cluster sum of squares to the total sum of squares indicates that k-means clustering was effective in capturing the structure of the data on ageing indicators.
Although the applied methodology proved suitable for deriving clusters of demographic ageing, it is important to emphasize that clustering reveals spatial patterns but does not quantify underlying causes. Therefore, future research should, among other aspects, focus on identifying and analyzing the factors driving such spatial manifestations. The partially limited spatial resolution may affect the accuracy of classification, as municipal boundaries, used as the primary statistical units, constrain the ability to capture intra-local variations in demographic ageing. Additionally, temporal limitations must be acknowledged, arising from the absence of regular population censuses in Bosnia and Herzegovina and the lack of an up-to-date population register.
To enhance the analytical framework of future studies on population ageing in Bosnia and Herzegovina, several methodological refinements are proposed. One important direction involves the incorporation of spatial contiguity into the clustering process. While k-means clustering effectively groups units based on attribute similarity, it does not account for geographic proximity, which is an important dimension in spatial demography. Therefore, the application of spatially constrained hierarchical clustering (SCHC) methods, as proposed by Anselin (2020), could improve the identification of demographically coherent and spatially contiguous clusters. Such an approach would generate more policy-relevant regional delineations for spatial planning and targeted interventions. In addition, the application of geographically weighted clustering could prove particularly valuable in detecting local variations in ageing structures. Given the demographic complexity of Bosnia and Herzegovina, where adjacent municipalities often exhibit vastly different demographic profiles due to historical, socio-economic and administrative factors, this technique would allow for more localized and context-sensitive analysis of ageing patterns.
When it comes to data preprocessing, future research should continue to employ techniques such as winsorization or natural logarithm transformation to address the influence of outliers. These outliers frequently correspond to small municipalities established in the post-war period through the new administrative organization of the country. Due to their low population base and atypical demographic structures, these municipalities pose specific challenges in spatial statistical analysis and require detailed methodological approach. Ideally, such municipalities should be the focus of separated demographic case studies to better understand their actual conditions.
It would be beneficial to compare the results of quantitative clustering with existing official typologies or classifications, or to validate findings using qualitative methods. This would enhance the interpretability and credibility of the identified clusters. Furthermore, the inclusion of data at lower administrative levels, such as settlements, would greatly increase the resolution and analytical precision of spatial ageing studies. However, due to the absence of disaggregated demographic data after the 2013 census, such analyses remain limited. Additionally, the inclusion of migration data and the implementation of comparative studies with neighboring countries would provide a broader regional perspective, allowing for contextualization of demographic ageing trends within the wider post-socialist and post-conflict spatial development of this part of Balkans.
The findings of the study are significant for future planning of demographic development in Bosnia and Herzegovina since they point to the need to create and implement regional demographic development strategies. In the coming period, it is necessary to define and implement measures of population policy by applying various financial and social measures. This includes developing programs for the revitalization of rural areas through investments in infrastructure, agriculture, and other local economic activities that could reduce emigration. Improving working conditions and reducing unemployment among young population, should be addressed through the creation of new jobs and the implementation of programs supporting self-employment and entrepreneurship.
A strategy for return of Bosnian emigrants should be developed, incorporating tax incentives, subsidies for starting new business and recognition of qualifications acquired abroad. Furthermore, immigration should be promoted by creating policy that would attract immigrants to Bosnia and Herzegovina through temporary or permanent residence. Bosnia and Herzegovina needs balanced regional development strategies that consider the geographic and demographic specificities of each region and municipality.
Therefore, in the forthcoming period it is necessary to conduct case studies and research spatial demographic disparities through the systematic collection and analysis of data on demographic data at regional and municipal level. These insights will serve as a foundation for formulating effective and regionally responsive demographic development strategies.
6. Conclusions
This study emphasizes the use of k-means clustering in determining spatial disparities in population ageing in Bosnia and Herzegovina providing valuable insights into demographic challenges facing this country. The results of k-means clustering revealed three distinct clusters with different levels of ageing, which correlate with underlying demographic, socioeconomic, and political factors. Key socioeconomic factors, affecting this demographic process, include unemployment rate, the unemployment rate among highly educated population, net salaries, etc. These are accompanied by political and social factors such as political instability, social injustice, lack of trust in institutions, and general feeling of insecurity. Psychological factors also play a significant role, especially the attitudes of young generations towards marriage and family, personal and professional ambitions. These factors aggravate rural-urban polarization contributing significantly to the uneven demographic development of Bosnia and Herzegovina, causing disparities in population ageing. Uneven socio-economic development in Bosnia and Herzegovina causes emigration of young population from underdeveloped rural to developed urban areas, and the emigration of young people abroad.
Cluster analysis identified that municipalities in rural and less economically developed areas of Bosnia and Herzegovina experience higher levels of ageing. These regions are characterized by significant emigration and lower fertility rates, which aggravates the challenges of the pension and healthcare system, putting pressure on the economic stability of the country. On the other hand, municipalities with lower levels of ageing are mostly located in urban and economically more developed areas, with larger share of young population and higher fertility rates.
Therefore, the k-means clustering approach proved to be an effective tool for identifying spatial disparities in population ageing in Bosnia and Herzegovina. The classification of municipalities based on ageing indicators enabled a better understanding of spatial differences in the ageing process. Moreover, cluster analysis of ageing indicators provided a visualization of ageing disparities, facilitating data interpretation for future strategists and spatial planners. Future research could incorporate additional socioeconomic variables to gain a more comprehensive understanding of factors that contribute to spatial disparities in demographic development and population ageing. Future studies could also explore interdependencies between demographic and socioeconomic development using advanced spatial statistical methods, such as geographically weighted clustering. This approach would contribute to more precise and effective policy recommendations aimed at addressing the challenges of population ageing in Bosnia and Herzegovina.
Acknowledgements
Preliminary research results of the study are presented at the 6th Congress of Geographers of Bosnia and Herzegovina, Department of Geography, Faculty of Science, University of Sarajevo, Geographical Society of FBiH, Sarajevo, 19th to 21st September, 2024.
Author contributions
Alma Kadušić: Conceptualization, Methodology, Software, Validation, Formal analysis, Investigation, Resources, Data curation, Writing - original draft preparation, Writing - review and editing, Visualization, Supervision. Mariana Lukić Tanović: Conceptualization, Methodology, Validation, Resources, Writing - review and editing, Visualization, Supervision. Nedima Smajić: Resources, Writing - review and editing, Visualization, Supervision. Aida Avdić: Resources, Writing - review and editing, Visualization, Supervision.

