Serviços Personalizados
Journal
Artigo
Indicadores
-
 Citado por SciELO
 -
 Acessos
Links relacionados
-
 Similares em
SciELO
Compartilhar
Revista de Ciências Agrárias
versão impressa ISSN 0871-018X
Rev. de Ciências Agrárias v.33 n.1 Lisboa jan. 2010
Simulation of water dynamics in two irrigated soils
L. Barão1, P. Chambel Leitão1, F. Braunschweig1, R. J. Neves1, M. C. Gonçalves2, T. B. Ramos2, N. L. Castanheira3
1 Instituto Superior Técnico – MARETEC, Av. Rovisco Pais, 1049-101 Lisboa – Tel: 218 419 424 – Fax: 218 419 423, e-mail: lucia.barao@ist.utl.pt;
2Instituto Nacional dos Recursos Biológicos, LINIA, Estação Agronómica Nacional, Quinta do Marquês, 2784-505 OEIRAS;
3Universidade de Évora, Departamento de Engenharia Rural, Apart. 94, 7002-554 ÉVORA
ABSTRACT
Simulation results for water content distribution obtained with HYDRUS, RZWQM and MOHIDLAND models were compared with field data. These models differ mainly in calculating root water uptake and computing crop water requirements. Simulations were carried out in different horizons of an Hortic Anthrosol and an Eutric Fluviosol, located in the Alentejo region (Portugal). Soil water content was measured, with a TDR system at different depths. Soil hydraulic properties were determined in the laboratory, and described in HYDRUS and MOHIDLAND with the Mualem-van Genuchten, and in RZWQM with the modified Brooks and Corey equations. Reference evapotranspiration was calculated with the Penman-Monteith and the Shuttleworth-Wallace method using atmospheric data from the meteorological stations located near the field plots. Partition between transpiration and evaporation was calculated using the Leaf Area Index values, and the RZWQM crop module. Results show a good agreement between model simulations and field measurements for the three models.
Key-words: crop growth, hydraulic properties, model soil water content
Simulação da dinâmica da água em dois solos regados
RESUMO
Foram comparados os resultados da simulação do teor de água no solo obtidos com os modelos HYDRUS, RZWQM e MOHIDLAND com valores medidos. Estes modelos diferem principalmente nos cálculos da extracção de água pelas raízes e das necessidades de água das plantas. As simulações foram realizadas para diferentes profundidades de um Fluvissolo Êutrico e de um Antrosolo Hórtico localizados no Alentejo (Portugal). O teor de água foi medido com um sistema TDR. As propriedades hidráulicas, determinadas laboratorialmente, foram descritas com as equações de Mualem-van Genuchtene e Brooks and Corey modificadas. A evapotranspiração de referência foi calculada com os métodos de Penman-Monteith e de Shuttleworht-Wallace com dados atmosféricos medidos. A partição entre a transpiração das plantas e a evaporação do solo foi calculada através do Índice de Área Foliar medido e através do modelo RZWQM. Os resultados mostram boa concordância entre as simulações dos três modelos e os valores de campo.
Palavras-chave: Modelo, crescimento de plantas, propriedades hidráulicas, teor de água no solo
INTRODUCTION
In the Portuguese southern region of Alentejo where irrigated agriculture is the most relevant farm enterprise and water is the key factor limiting crop production, Mediterranean conditions prevail with hot summers and scarce rainfall, and mild and rainy winters. To overcome the problem and increase water use efficiency, in the last years hundreds of thousands of hectares have been converted to irrigation. The knowledge of soil water content and the quantification of infiltration and water dynamics in soils are important to optimize the use of water in agriculture and minimize environmental impacts resulting from irrigation practices.
The main objective of this study was to estimate water content with HYDRUS-1D (imůnek et al., 2005), RZWQM (Ahuja et al, 1999) and MOHIDLAND (Neves et al., 2000), and inter-compare the results also with field data obtained in two soils with different hydraulic behaviour.
MATERIAL AND METHODS
HYDRUS-1D
The HYDRUS-1D software package (imůnek et al., 2005) is a one-dimensional model to describe variably saturated water flow, solute and heat transport. The program numerically solves the Richards equation describing variably saturated water flow using Galerkin-type linear finite element schemes. Water and salinity stress response functions that reduce potential root water uptake were defined for this study according to the function proposed by Feddes et al. (1978).
We used van Genuchtens (1980) equations for the soil hydraulic properties. The soil water content, θ (L3 L-3) vs. soil water pressure head, h (L) relation is expressed by:

The hydraulic conductivity, K (L T-1), vs. soil water pressure head, h (L) relation is:

where Se is effective saturation (-), θr and θs denote the residual and saturated water contents, respectively (L3 L-3), Ks is the saturated hydraulic conductivity (L T-1) and α (L-1), η (-) and l (-) are empirical shape factors.
Atmospheric and free drainage boundary conditions were used at surface and bottom of the soil profiles, respectively. Crop evapotranspiration (ETc) was computed from the product of the reference evapotranspiration, according to Penman-Monteith method, and a crop coefficient (Allen et al., 1998). The Leaf Area Index (LAI) and the corresponding Soil Cover Factor (SCF) were used to account for different stages of the soil cover and to divide the ETc daily values into crop transpiration (T) and soil evaporation (E) rates as required by HYDRUS-1D, according to:
E=ETc–T (5)
T = ETc × SCF (6)
SCF = 1-exp(-αi × LAI) (7)
where αi is a constant (=0.5-0.75) representing the governing radiation extinction by the canopy, and depending on sun angle, distribution of plants, and arrangement of leaves (Ritchie, 1972).
Main inputs required for Hydrus are: a) incoming water (rain and irrigation) b) lost water (evaporation and transpiration) and c) soil properties (physics and hydraulics). Other necessary parameters may be consulted in Hydrus manual (Department of Environmental Sciences University of California Riverside, 2005).
Root Zone Water Quality Model
The Root Zone Water Quality Model (RZWQM) (Ahuja et al., 1999) is an integrated physical, biological, and chemical process model simulating plant growth and movement of water, nutrients, and pesticides over and through the root zone at a representative area of an agricultural cropping system (Cameira et al. 2005).
The water flow component includes a sub-module of macropore flow and transport (Ahuja et al., 1999). The Green-Ampt equation is used to calculate infiltration rates into an homogeneous soil profile. Between successive rainfall or irrigation events, the soil water is redistributed by a finite-difference numerical solution of the Richards equation (Equation 1). In this model, the sink term S to account for the root water uptake (L T-1) is given by Nimah & Hanks (1973) equation.
The matrix soil hydraulic properties are described in the model by the functional forms suggested by Brooks and Corey with slight modifications (Ahuja et al., 1999). The soil water content, θ (L3 L-3) vs. soil water pressure head, h (L) relation is:
θ(h)=θs − A|h| 0 ≤ |h| ≤ |hb1| (8)
θ(h)=θr + B|h| −λ |h| ≥ |hb1| (9)
where θs is the saturated water content (L3 L-3), θr is the residual content (L3 L-3), hb1 (L), A (L-1), B (L-λ)and λ (-) are parameters derived from best fitting of experimental data.
The hydraulic conductivity, K (L T-1), vs. soil water pressure head, h (L) relation is expressed by:
K(h)= Ks − |h| − N1 0 ≤ |h| ≤ |hb2| (10)
K (h)= C|h| − N2 |h| ≥ |hb 2| (11)
where Ks is the field saturated hydraulic conductivity (L T-1) and hb2 (L), N1 (-), N2 (-), and C (L T-1) are parameters derived from experimental data.
Atmospheric and free drainage boundary conditions were used at surface and bottom of the soil profiles, respectively. RZWQM calculates internally the reference evapotranspiration based on the Shuttleworth & Wallace (1985) dual surface version of the Penman–Monteith method (Allen et al., 1998).
Main inputs required for RZWQM are: a) atmospheric parameters b) incoming water (irrigation) c) soil properties (physics and hydraulics) and d) plant type. The LAI is calculated in the model indirectly. Some other parameters about the plants may be changed in calibration phase and consulted in Ahuja et al. (2000).
MOHID LAND
MOHIDLAND model has been developed by the researcher group Maretec at School of Engineering of the Technical University of Lisbon (Neves et al., 2000). This specific execuTable part of MOHID is responsible for simulating the processes in a watershed. It is able to simulate the water infiltration, runoff and the drainage network occurring in the hydrographical basin. However, MOHIDLAND has the ability to simulate the soil profile and the water transport in the vertical (1D) as HYDRUS and RZWQM.
MOHIDLAND uses a finite volume approach. A water balance is made for every small volume consider by the model in every time step. The water in every layer may be transferred by advection or may be removed by transpiration or evaporation. Equation 12 shows the balance solved explicitly in time, where θ is the water content, vol is the soil volume, Qk1/2 is the input water flow into the layer k and Qk+1/2 is the flow that leaves the same layer in the same time step, Evap is the water flux lost by evaporation and Transp is the flux of water lost by plants transpiration.

The flux of water (Q) or the velocity is calculated by the Bucking-Darcy equation (Jury et al, 1991). The hydraulic conductivity is calculated from the unsaturated hydraulic and water retention curve using the van Genuchten parameters.
The atmospheric boundary conditions used are the same used for HYDRUS. The bottom boundary condition used in MOHIDLAND is the constant null flux, since the free drainage is not an option yet.
Main inputs required for MohidLand are: a) atmospheric parameters b) incoming water (irrigation) c) soil properties (physics and hydraulics) and d) plant parameters such as root length, root growth profile in others. All of the input parameters may be found in the software itself (Maretec, 2008).
Field experimental data
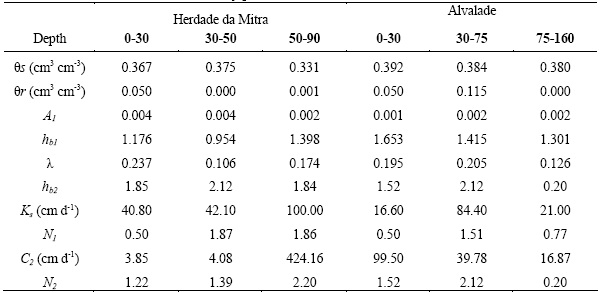
Soil water content was monitored in two different soils located at the Alvalade Experimental Station of INRB, and at the Campus of Mitra of the University of Évora, both in the Alentejo region of Portugal. In Alvalade Experimental Station the soil was classified as an Eutric Fluvisol with a medium texture. In the Campus of Mitra the soil was classified as an Hortic Anthrosol with a coarse texture. The main soil properties are described in Table 1.
Table 1 -Soil properties in Mitra and Alvalade experimental fields.

In Alvalade, soil water content data was obtained from two types of experiments:
(i) from 2001 to 2004 the measurements were taken from soil monoliths which were cover with natural vegetation; (ii) from 2004 to 2007 a field experiment was carried out, with an area of about 200 m2, irrigated from June to September. In both experiments, soil water content was measured at 20, 40, and 60 cm depth with a TDR-Trase system, on a weakly basis, from 2001 to 2007. The value measured at each depth was repeated twice.
In Mitra, soil water content was measured at the same depths, from 2004 to 2007.
Soil hydraulic properties were measured on undisturbed samples (100, 200 and 630 cm3). The soil water retention curve was determined using suction Tables with sand or kaolin for suctions below 500 cm and a pressure plate apparatus for suctions above 1000 cm. The hydraulic conductivity curve was obtained by combining measurements on the 630 and 200 cm3 samples. A constant head method was used to measure the saturated hydraulic conductivity. The evaporation method (Wind, 1968) was used to measure the unsaturated hydraulic conductivity on larger samples, while the hot air method (Arya et al., 1975) was used at greater suctions to measure unsaturated hydraulic conductivities on 200 cm3 samples. The soil hydraulic functions were described using: (i) the van Genuchten-Mualem equations (van Genuchten, 1980), with their parameters optimized using the RETC code (van Genuchten et al., 1991); (ii) modified Brooks and Corey parameters (Ahuja et al., 1999) calculated according to Cameira (1999), with a logarithmic linearization of the each part of the retention (12 and 13). Table 2 and 3 list the Mualem-van Genuchten and the modified Brooks and Corey parameters respectively.
Table 2 -Mualem–van Genuchten parameters for Alvalade and Mitra horizons

Table 3 – Modified Brooks and Corey parameters for Alvalade and Mitra horizons
Both Alvalade Experimental Station and the Campus of Mitra own a meteorological station, from where data where collected.
Leaf Area Index (LAI) was calculated with a regression line obtained by Universidade de Évora, in which leaf is correlated with LAI measured with LI-COR area meter instrument (Model LI-3100C, LI-COR Environmental and Biotechnology Research Systems, Lincoln, Nebraska). The instrument was not applied directly because that implicates the plant destruction.
To calculate the leaf area, three plants were chosen and flowed during the experiment. Each weak leaf width and length was measured.
RESULTS AND DISCUSSION
Hydraulic curves
Figure 1 and 2 show the retention curves for the different depths of the soils in Alvalade and Mitra, respectively. The retention curves generated with the vanGenuchten and modified Brooks and Corey are very close each other and are also well correlated with the laboratorial data.
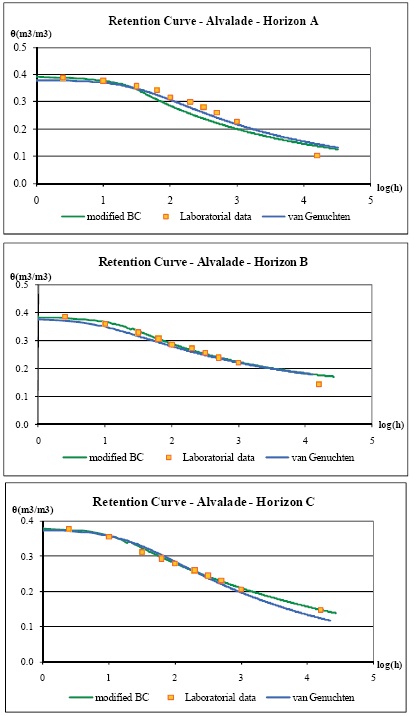
Figure 1 -Retention curves for the different depths of the Eutric Fluvisol in Alvalade.
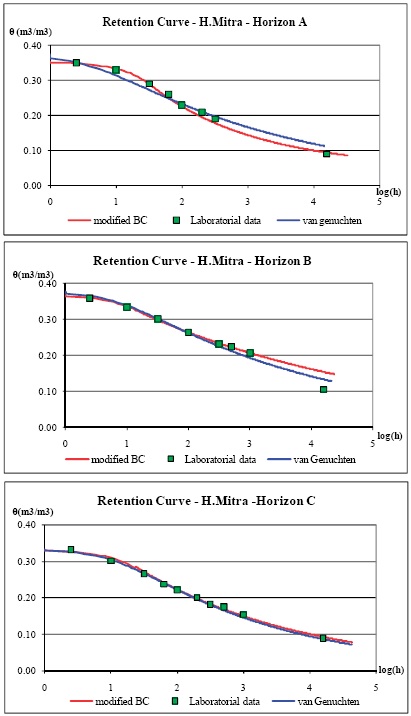
Figure 2 -Retention curves for the different depths of the Hortic Anthrosol in Mitra.
Figure 3 and Figure 4 show the hydraulic conductivity curves for the different depths of the soils in Alvalade and Mitra, respectively. Both methods used are well correlated with the laboratorial data available. However the curves have different values for pressures near the saturation. As no laboratorial data was available for these ranges of pressure values, it is not possible to tell which method was more correct.
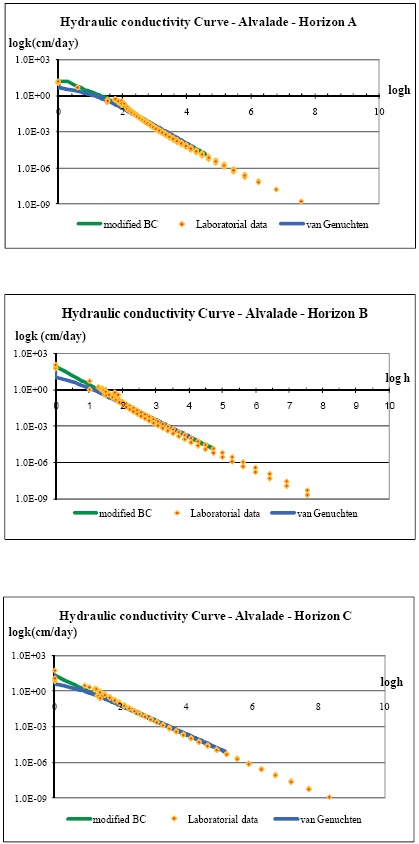
Figure 3 -Hydraulic conductivity for the different depths of the Hortic Anthrosol in Mitra.
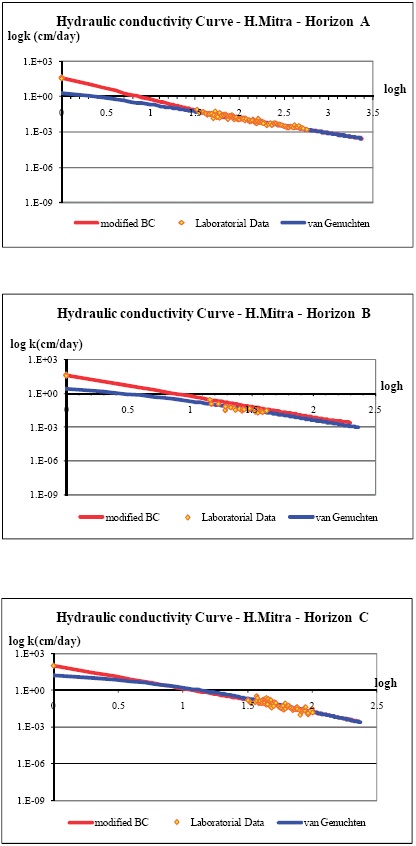
Figure 4 – Hydraulic conductivity for the different depths of the Eutric Fluvisol in Alvalade.
Water content in soil – HYDRUS, RZWQM and MOHIDLAND comparison
HYDRUS, RZWQM and MOHIDLAND model were used to simulate water content in the Alvalade soil, which is shown in Figure 5. All the three models are well correlated with the data field. Models are better correlated with the data field in the first 4 years (2001-2004) corresponding to the measurements in the soil monoliths, where the irrigation was manual and there was no runoff. In the next three years (2004-2007) water was applied with a trickle irrigation system with higher rates applied and with no restrictions over lateral fluxes and runoff.
Figure 5 -Water content at 20, 40 and 60 cm in the Eutric Fluvisol in Alvalade (I) - irrigation period; (R) - rain period
HYDRUS and MOHIDLAND have close results since they use the same approach for evapotranspiration and for root water uptake calculations. The retention and hydraulic conductivity curve used are also the same. At the opposite, RZWQM differs from the other two models because of the different evapotranspiration calculation and also the evaporation and root water uptake methods.
The models have different results in the irrigation period of 2004, 2005 and 2006. Since the irrigation rates were higher in these years, the soil could be more saturated and the differences in the water content might be explained by the different behaviour of the hydraulic conductivity curve near the saturation which was mentioned before in the analysis of the hydraulic curves.
Model results of RZWQM and HYDRUS were obtained for H.Mitra soil. This experimental field was only available from 2004 till 2007 and the measurements collected were not so controlled as for Alvalade in the period of 2001 till 2004. The irrigation rates were also very high as had happened in Alvalade leading to different results in the irrigation periods. The different results of the models for the rain periods are related to the evapotranspiration calculation and the evaporation flux. HYDRUS uses the crop coefficient and the LAI given by the user, while RZWQM calculates the reference evaporation.
Figure 6 -Water content at 20, 40 and 60 cm in the Hortic Anthrosol in Mitra (I) - irrigation period; (R) -rain period.
CONCLUSIONS
The retention curves obtained with the van Genuchten and the modifier Brooks and Corey methods were similar and well correlated to the laboratorial data. The same result was observed in the hydraulic conductivity curves, with differences between the models for pressures near the saturation, where there were no laboratorial data to make a comparison.
In the first 4 years, HYDRUS, RZWQM and MOHIDLAND simulate water content in Alvalade more accurately than in the last 3 years, due to more controlled conditions of the experiment (monoliths). However, visual inspection shows agreement between models and field data. HYDRUS and RZWQM, simulating the water content in H.Mitra, also show the same differences observed for the irrigation and rain periods.
MOHIDLAND, which has only recently been tested and evaluated, also had a good result turning it available for other simulations.
REFERENCES
Ahuja, L., Johnsen, K. & Rojas, K. 1999. Water and chemical transport in soil matrix and macropores. In L. Ahuja, J. Rojas, M. Hanson & L. Ma (eds.) RZWQM. Modeling Management Effects on Water Quality and Crop Production, pp. 13–50. Water Resources Publications, LLC, Colorado USA.
Ahuja, L., K. W. Rojas, J. D. Hanson, M. & J. Shaffer. 2000. Root Zone Quality Model: Modelling Management Effects on Water Quality & Crop Production & Computer Program.
Allen, R. G., Pereira, L. S, Raes, D. & Smith, M. 1998. Crop evapotranspiration: Guidelines for computing crop water requirements. Irrig. Drain. Pap. 56, FAO, Rome.
Arya, L. M., Farrel, D. A. & Blake, G. R. 1975. A field study of soil water depletion patterns in presence of growing soybean roots, I. Determination of hydraulic properties of the soil. Soil Sci. Soc. Am. J., 45: 1023– 1030.
Cameira, M. C., Fernando. R. M., Ahuja, L. & Pereira, L. S. 2005. Simulating the fate of water in field soil-crop environment. J. Hydrology, 315:1-24.
Department of Environmental Sciences University of California Riverside. 2005. The HYDRUS-1D Software Package for Simulating the One-Dimensional Movement of Water, Heat, and Multiple Solutes in Variably-Saturated Media
Feddes, R. A., Kowalik, P. J. & Zaradny, H. 1978. Simulation of Field Water Use and Crop Yield. John Wiley & Sons, Hoboken, N. J.
Jury, W. A., Gardner, W. R. & Gardner, W. H. 1991. Soil Physics (5 ed). John Wiley, New York,
Nimah, M. & Hanks, R. 1973. Model for estimating soil – water – plant – atmospheric interrelation: I. Description and sensitivity. Soil Sci. Soc. Am. Proc., 37:522–527.
Maretec, www.mohid.com, 2008
Neves, R., Chambel-Leitão, P., Leitão, P.C. 2000. Modelação Numérica Da Circulação Da água no solo -o modelo MOHID. Pedologia, 28: 46-55. [ Links ]
Ritchie, J.T. 1972. Model for predicting evaporation from a row crop with incomplete cover. Water Resources Research, 8(5): 1204-1213.
imůnek, J., van Genuchten, M. Th. & ejna, M. 2005. The HYDRUS-1D software package for simulating the one-dimensional movement of water, heat, and multiple solutes in variablysaturated media. version 3.0, HYDRUS Software Ser. 1, 270 pp., Dep. of Environ. Sci., Univ. of Calif., Riverside.
Shuttleworth, W.J. & Wallace, J.S. 1985. Evaporation from sparse cropsan energy combination approach. Q. J. R. Meterol. Soc., 111: 839–855.
van Genuchten, M. T. 1980. A closed form equation for predicting the hydraulic conductivity of unsaturated soils. Soil Sci. Soc. Am. J., 44:892– 898.
van Genuchten, M. T., Leij, F. J. & Yates, S. R. 1991. The RETC code for quantifying the hydraulic functions of unsaturated soils. Rep. EPA/600/2-91-065, U.S. Environ. Prot. Agency, Washington, D. C.
Wind, G.P. 1968. Capillary conductivity data estimated by a simple method. In: P.E. Rijtema & H. Wassink (ed.) Water in the unsaturated zone, p. 181–191. Vol. 1. Proc. Wageningen Symp., Wageningen, the Netherlands. June 1966. UNESCO, Paris.


