INTRODUCTION
The use of a permanent soil cover, with the maintenance of crop residues on soil surface is a fundamental practice for preserving the soil functions of agroecosystems (Dechen et al., 2015). As well as, the agricultural systems with a minimum soil disturbance are desirable to minimise soil erosion, nutrient losses, and negative impacts to water resources (Ekholm and Lehtoranta, 2012). As to the long-term soil management under the no-tillage, the vertical gradient of soil fertility increases in the uppermost soil layer with the increase of nutrients concentration (Dorneles et al., 2015; Nascente et al., 2015). Preservation of enriched soil layers is thus crucial for the resilience and sustainability of agricultural soils (Delgado-Baquerizo et al., 2017).
Cover crops can be utilized as intercrops with fruit trees in commercial orchards and decomposition of cover crop residues on the soil surface may contribute with organic matter and nutrients depending especially on crop species, soil practices and climatic conditions (Nascenteet al., 2015; Boittet al., 2017).
Information regarding rates of decomposition of cover crop residues in orchards, especially under the subtropical conditions as the southern Brazil is scarce. A few studies focused on quantifications of plants residues decomposition rates under agricultural systems (Oliveira et al., 2016, 2017) and vineyards (Brunetto et al., 2014). Data for pear orchards in the state of Santa Catarina - the first largest pear producer in Brazil with 6631 Mg year-1 (IBGE, 2016) - is missing. Given the importance of this sector for the local economy, more knowledge on the decomposition rate and nutrients release by different sown cover crops and the spontaneous vegetation is recommended. Therefore, the main objective of the present study was the evaluation of pattern of decomposition and nutrients release from four herbaceous vegetation type in the soil in a well-established (11 years old) commercial pear orchard, in Santa Catarina, (Brazil).
MATERIAL AND METHODS
The pear orchard, Santa Catarina, Brazil
The commercial pear (Pyrus communis L.) orchard was established in 2004 in the city of São Joaquim, located in the state of Santa Catarina, southern Brazil (latitude de 28° 17' 38" S, longitude de 49° 55' 54" W). The altitude of the area was 1353 m above sea level. Historic (1981-2017) local annual average temperature was 13 °C and the mean annual rainfall was 1480 mm, with an occurrence of 25 frosts throughout the year. The climate is humid subtropical (Cfa) according to Köppen classification (Peel et al., 2007). The soil is classified as Inceptisol (Soil Survey Staff, 2014). Mainphysical-chemical properties of the study soil at 0-20 cm depth were: 450 g clay soil, 400 g silt, and 150 g sand; soil organic matter 40 g kg-1; total N 3.0 g kg-1, available P (Mehlich-1) 4.5 mg kg-1, extractable K 59 mg kg-1; exchangeable (KCl 1 M-extractable) Ca 1.8 g kg-1 and Mg 0.5 g kg-1; and pH-H2O (1:1) of 6.3. The pear cultivar was Rocha, grafted on Pyrus caleriana L. rootstock and planted at a density of 1250 plants ha-1 (4 x 2 m spacing).
Assessment of cover crops decomposition rates and nutrients release with litter bags
The experiment had four treatments consisting of three planted cover crops: oat (Avena sativa L.), oilseed radish (Raphanus sativus L. var. oleiferus), and ryegrass (Lolium multiflorum L.) and an additional treatment consisting of spontaneous vegetation constituted by Rumex obtusifolius L., Paspalum notatum L.and Andropogon bicornis L.
The plant material necessary for this experiment was produced in an adjacent area in the same pear orchard. The cover crop species were sown in July 2015. Seeds were broadcasted in between the pear tree rows at rates of 70 kg ha-1 for oat, 15 kg ha-1 for oilseed radish, and 20 kg ha-1 for ryegrass, in accordance to the local recommendations. A separate plot was used for the spontaneous vegetation in the inter-row spacing.
In September 2015, the total dry matter produced by herbaceous vegetation after 60 days of growth was determined. This involved harvesting the four-vegetation type at ground-level in full bloom, using four randomly placed, 0.50 × 0.50 m quadrants in the inter row spacing. Harvested plant was oven dried at 65 °C to constant mass, ground, bulked and weighed. Aboveground plant biomass was expressed as kg dry weight (DW) ha-1. Biomass productivity of each plant species was determined mechanically using a brush cutter close to the soil surface in a 100 m2 area. The oat, oilseed radish, ryegrass and spontaneous vegetation productivity was about 4000, 4500, 4000, and 2650 kg DW ha-1, respectively. Subsample of each crop residue was reserved for chemical analysis (Table 1).
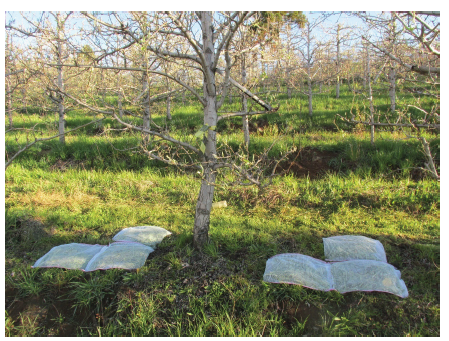
Extra fresh plant material (oat, oilseed radish, ryegrass and spontaneous vegetation) was collected, weighed and packed into 2-mm nylon mesh litter bags of 0.40 m × 0.40 m containing 320 g oat, 404 g oilseed radish, 376 g ryegrass, and 176 g spontaneous vegetation, equivalent to the productivity of each cover crop species (Figure 1).
Table 1 Chemical characterization of oat, oilseed radish, ryegrass and spontaneous vegetation residues used in the litter bag experiment
| Oat | Oilseed radish | Ryegrass | Spontaneous vegetation | |
| Total organic carbon (g kg-1dry weight) | 431±0.3 | 409±2.8 | 416±3.7 | 390±2.8 |
| Cellulose (g kg-1 dry weight) | 252±0.3 | 381±5.3 | 208±1.3 | 110±2.5 |
| Lignin (g kg- dry weight1) | 112±0.8 | 54.2±3.1 | 175±2.7 | 335±3.3 |
| Non-structural components (g kg-1 dry weight) | 504±4.9 | 565±3.6 | 532±6.8 | 543±0.3 |
| Total N (g kg- 1 dry weight) | 18.1±3.1 | 27.0±5.4 | 27.9±1.3 | 34.2±0.7 |
| Total P (g kg-1 dry weight) | 8.0±1.4 | 17.7±2.1 | 12.6±3.5 | 13.3±1.5 |
| Total K (g kg-1 dry weight) | 9.3±0.1 | 18.8±0.2 | 13.4±0.2 | 12.2±0.2 |
| Total Ca (g kg-1 dry weight) | 2.0±4.7 | 7.6±5.2 | 2.6±4.4 | 4.5±5.7 |
| Total Mg (g kg-1 dry weight | 1.4±3.0 | 3.7±2.0 | 3.0±4.7 | 2.6±0.6 |
| Cellulose/lignin ratio | 2.3 | 7.0 | 1.2 | 0.3 |
| Lignin/N ratio | 6.2 | 2.2 | 6.3 | 10.2 |
| C/N ratio | 23.8 | 15.2 | 14.9 | 11.4 |
n=4

Figure 1 Deposition of in litter bags containing cover residues deposited on surface soil in inter-row spacing of pear trees.
The litter bags were deposited on the soil surface of each pear planting row and were fixed to the ground with iron bars to prevent possible shift caused by wind or animals. The layout of this experiment was under completely randomized blocks with four treatments (total of 60 litter bags), where fifteen litter bags were deposited per treatment (crop residue) for five sampling dates, with three replicates.
Three litter bags per treatment (three replicates) were collected shortly after litter bags deposition (time 0) and other three replicates were taken at 21, 36, 56 and 136 days after deposition. The residues were removed from litter bags and immediately rinsed with distilled water. Subsequently, they were rinsed with a 0.1 mol L-1 HCl solution for two minutes and again with washed with distilled water to remove possible soil particle adhered to the residues. Plant residues were oven dried at 65 °C to constant weight prior to weighing for dry weight determination. Thereafter residues were ground in a Wiley mill and subjected to analysis of lignin, cellulose and non-structural components, which are substances of low or medium molecular weight (extractives or ash) (Aber and Martin, 1999). In addition, total organic carbon (TOC) and total N were analyzed in a FlashEA® 1112 Series NC Analyzer (Thermo Fisher Scientific); P concentrations were determined by spectrophotometer (Pro Analysis UV 51-00, Brazil), with 882 nanometers, according to Murphy and Riley (1962); total K was determined by flame emission spectroscopy (Digimed DL-62, Brazil); total Ca and Mg concentrations were measured by atomic absorption spectroscopy (Perkin Elmer Aanalyst 200, Italy) to be directed to sulfur digestion (Tedesco et al., 1995).
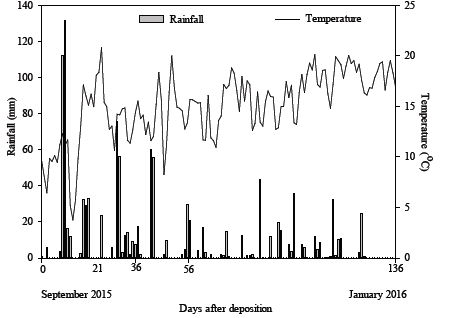
Meteorological data for daily rainfall (mm) and daily mean air temperature (ºC) at the experimental area were collected from a nearby weather station over the 136 days of residues decomposition, and data were presented in Figure 2.

Figure 2 Daily rainfall (mm) and daily average temperature (ºC) during the experimental period for crop residues decomposition in a pear orchard using the litter bags.
Fitting exponential decay model to decomposition data obtained over time
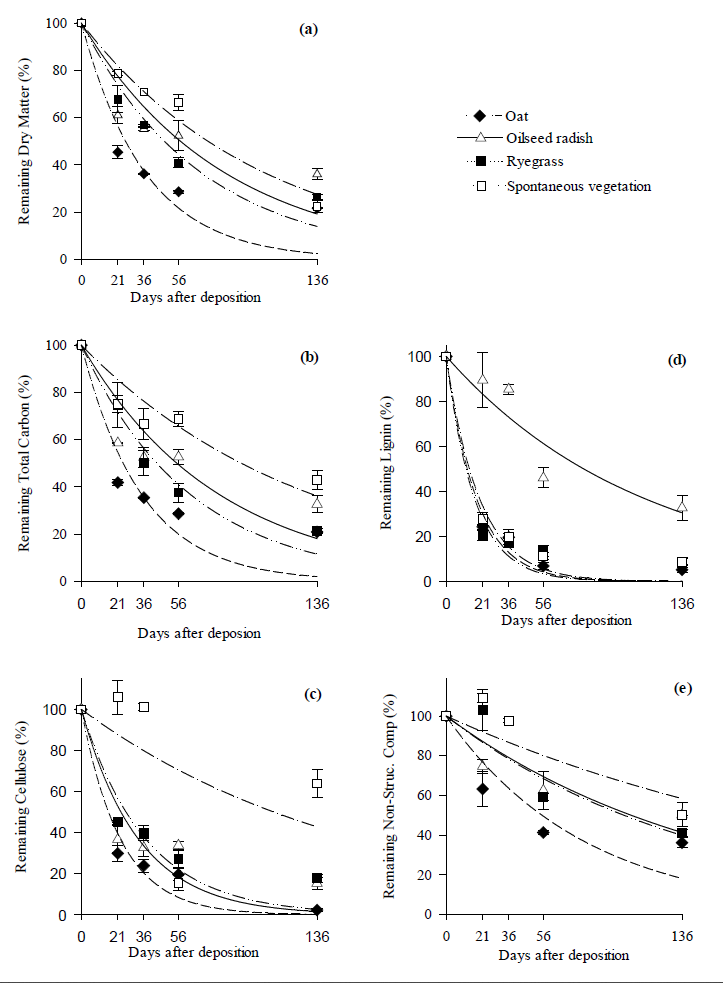
Results of final dry matter, cellulose, lignin, non-structural components, and concentrations of TOC, total N, P, K, Ca and Mg determined at each sampling date were represented as percentage of initial contents (Figure 3).

Figure 3 (a) Remaining percentage of dry matter, (b) total organic carbon, (c) cellulose, (d) lignin, and (e) non-structural components present in the residues of oat, oilseed radish, ryegrass, and spontaneous vegetation deposited on the plant row in the pear orchard. Vertical bars represent standard error of the mean.
The single exponential model (Eq. 1) was fitted to the decomposition data obtained here, according to Wider and Lang (1982). This single exponential decay model is suitable (biologically significant) and recommended for modeling residues decomposition over time. A single constant (k-constant) describes the decomposition rate of mass and nutrients. Details of the mathematical model and the constant rate obtained are briefly described below (Eq. 1):
where, X = the amount of residue or residual nutrient concentration after a period of time (t), in days; X 0 = the initial (t 0 ) amount of biomass or nutrient concentration; and k = decomposition constant rate. Additionally, the respective half-life was estimated as t 1 2 = 0.693 k , which expresses the time required to decompose half amount of the residue, or to release half amount of nutrient contained in the residue, and was calculated using the k-constant value estimated (Paul and Clark, 1996).
Statistical analysis
Comparison of means of the k-constants and the t 1 2 obtained from the mathematical model described above and across the four cover crop treatments (i.e. oat, oilseed radish, ryegrass, and spontaneous vegetation) were estimated using one-way ANOVA and comparison of means by Tukey test at p < 0.05 probability (SAS, 2011).
RESULTS AND DISCUSSION
The pattern of dry matter and nutrient losses from plant residues, including the lignin, cellulose, non-structural components, and TOC and totalN, P, K, Ca and Mg contents after 136 days of decomposition was described by the single exponential decay model (Table 2, Figures 3 and Figure 4). The percentage of remaining dry matter for all types of residues decreased over time (Table 2, Figure 3a). The fastest decomposition rate was observed for oat residue (Table 2, Figure 3a) with the shortest half-life ( t 1 2 = 25 days). Contrastingly, the slowest decomposition rate, with the longest half residence time ( t 1 2 = 74 days), was evident for spontaneous vegetation residue, while intermediate values were identified for oilseed radish and ryegrass residues, (48 and 58 days, respectively). Similar trends of decomposition, i.e., fastest for oat and slowest for spontaneous vegetation, were observed for TOC (Table 2, Figure 3a).
Table 2 Parameters of the model X= X 0 e (-kt) adjusted to the data of the measured variables dry matter, total organic carbon, lignin, cellulose, non-structural components, nitrogen, phosphorus, potassium, calcium, and magnesium; half-life (t½) and decomposition constant (k) of each compartment, fit coefficient values (r2), and remaining proportion at 136 days after deposition (%136) of oat, oilseed radish, ryegrass, and spontaneous vegetation residues in a pear orchard
| Treatment | Xo(a) | k | t½ | r² | %136 | Xo(a) | k | t½ | r² | %136 |
| % | g g-1 | days | % | % | g g-1 | days | % | |||
| Dry matter | Nitrogen | |||||||||
| Oat | 100 | 0.027 a | 25 c | 0.93 | 22 | 100 | 0.017 a | 41 a | 0.77 | 34 |
| Oilseed radish | 100 | 0.015 b | 48 bc | 0.96 | 36 | 100 | 0.018 a | 40 a | 0.90 | 29 |
| Ryegrass | 100 | 0.012 bc | 58 ab | 0.87 | 26 | 100 | 0.014 a | 49 a | 0.78 | 25 |
| Spontaneous veg. | 100 | 0.010 c | 74 a | 0.98 | 22 | 100 | 0.011 a | 68 a | 0.82 | 41 |
| Total organic carbon | Phosphorus | |||||||||
| Oat | 100 | 0.029 a | 24 c | 0.95 | 21 | 100 | 0.030 a | 24 b | 0.92 | 17 |
| Oilseed radish | 100 | 0.016 b | 44 bc | 0.95 | 33 | 100 | 0.020 b | 34 b | 0.91 | 19 |
| Ryegrass | 100 | 0.013 c | 56 b | 0.86 | 21 | 100 | 0.025 ab | 28 b | 0.94 | 25 |
| Spontaneous veg. | 100 | 0.008 d | 94 a | 0.90 | 43 | 100 | 0.009 c | 80 a | 0.81 | 46 |
| Cellulose | Potassium | |||||||||
| Oat | 100 | 0.045 a | 16 b | 0.98 | 3 | 100 | 0.064 a | 11 a | 0.99 | 3 |
| Oilseed radish | 100 | 0.027 b | 26 b | 0.94 | 15 | 100 | 0.080 a | 9 a | 0.99 | 3 |
| Ryegrass | 100 | 0.031 b | 23 b | 0.91 | 18 | 100 | 0.089 a | 8 a | 0.99 | 2 |
| Spontaneous veg. | 100 | 0.006 c | 113 a | 0.92 | 64 | 100 | 0.076 a | 9 a | 0.99 | 5 |
| Lignin | Calcium | |||||||||
| Oat | 100 | 0.057 a | 12 b | 0.99 | 5 | 100 | 0.016 a | 44 b | 0.83 | 33 |
| Oilseed radish | 100 | 0.009 b | 81 a | 0.97 | 33 | 100 | 0.007 b | 102 a | 0.86 | 22 |
| Ryegrass | 100 | 0.061 a | 11 b | 0.91 | 9 | 100 | 0.020 a | 35 b | 0.88 | 45 |
| Spontaneous veg. | 100 | 0.053 a | 13 b | 0.98 | 9 | 100 | 0.007 b | 99 a | 0.85 | 48 |
| Non-structural components | Magnesium | |||||||||
| Oat | 100 | 0.013 a | 55 b | 0.86 | 36 | 100 | 0.015 b | 48 b | 0.96 | 21 |
| Oilseed radish | 100 | 0.007 ab | 103 b | 0.92 | 50 | 100 | 0.009 c | 82 a | 0.93 | 30 |
| Ryegrass | 100 | 0.007 ab | 87 ab | 0.85 | 41 | 100 | 0.022 a | 32 b | 0.84 | 39 |
| Spontaneous veg. | 100 | 0.004 b | 136 a | 0.88 | 76 | 100 | 0.008 c | 91 a | 0.72 | 46 |
*a) Initial quantity; spontaneous veg. = spontaneous vegetation; in the same column, and for the same characteristic measured, means followed by the same letter do not differ by Tukey test at p> 0.05 probability.

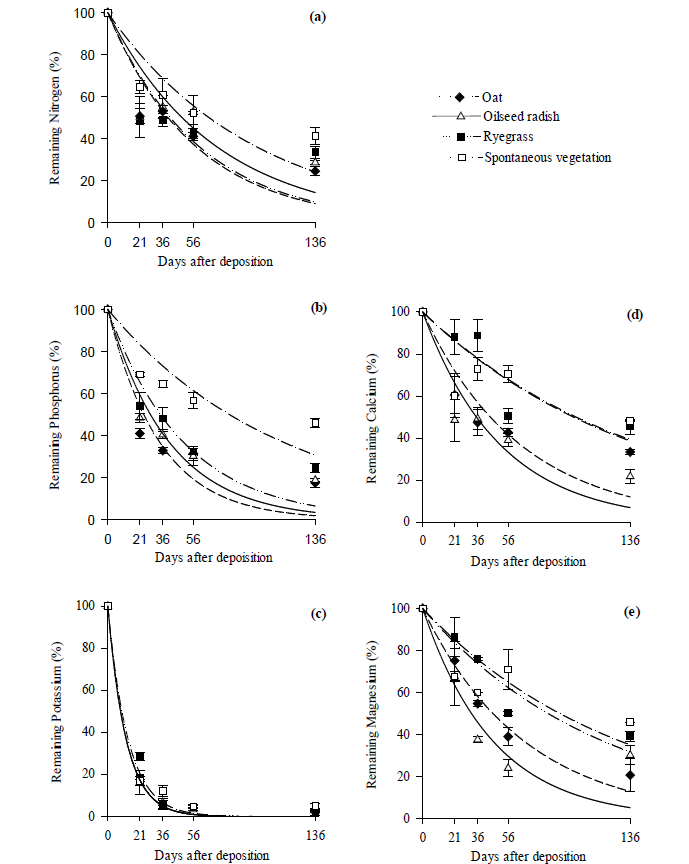
Figure 4 (a) Remaining percentage of nitrogen, (b) phosphorus, (c) potassium, (d) calcium, and (e) magnesium in the residues of oat, oilseed radish, ryegrass, and spontaneous vegetation deposited on the plant row in the pear orchard. Vertical bars represent standard error of the mean.
Decomposition of cellulose was the slowest for the spontaneous vegetation residues, following the same pattern of response as observed before for other plant residues (Table 2, Figure 3c).
Lignin in the oilseed radish residue showed the slowest decomposition rate and therefore the longest half residence time (81 days) comparing to other plant residues evaluated (11-13 days) (Table 2, Figure 3d). Oat, ryegrass and spontaneous vegetation residues presented similar decomposition rates of lignin (6-7-fold higher than the observed for oilseed radish residue), and had a rapid initial degradation (as evidenced by t 1 2 values): at 11-13 days after residues deposition about 50% of the initial lignin content was lost.
The dynamics of decomposition of non-structural components was more variable and unclear, although there was a tendency for a faster degradation rate by oat residue (2-3 times greater k-value, and shortest t 1 2 = 55 days) than other residues (Table 2).
Summarizing the highest proportions of remaining TOC, cellulose, and non-structural components after 136 days of residues decomposition were observed for the spontaneous vegetation whereas oilseed radish residues had the greatest lignin content in the remaining residue after the same decomposition period (Figure 3b to 2e).
After136 days of residues deposition, the remaining dry matter percentage was highest for oilseed radish (36%), followed by ryegrass dry matter residue (26%), and similar remaining dry matter of oat and spontaneous vegetation (22%). These, in turn, corresponded to the remaining amounts of dry matter, at the end of the experiment, of 1620 kg ha-1 of oilseed radish residue, 1040 kg ha-1 of ryegrass, 880 kg ha-1 of oat, and of 583 kg ha-1 of spontaneous vegetation residue (Table 3).
Table 3 Total amount of plant dry matter, organic carbon, and total nitrogen, phosphorus, potassium, calcium, and magnesium (kg ha-1 of added material), and the corresponding amount of remaining dry matter and released nutrients after 136 days of decomposition of oat, oilseed radish, ryegrass and spontaneous vegetation residues in a pear orchard
| Oat | Oilseed radish | Ryegrass | Spontaneous vegetation | ||
| Added amount (kg ha -1 ) | |||||
| Dry matter | 4000 | 4500 | 4000 | 2650 | |
| Total organic carbon | 1723 | 1844 | 1666 | 1033 | |
| Nitrogen | 72 | 121 | 112 | 91 | |
| Phosphorus | 32 | 71 | 50 | 32 | |
| Potassium | 37 | 84 | 55 | 76 | |
| Calcium | 7.6 | 34 | 10 | 12 | |
| Magnesium | 5.2 | 16 | 12 | 6.9 | |
| Amount released after 136 days (kg ha -1 ) | |||||
| Drymatter | 3120 | 2880 | 2960 | 2067 | |
| Total organic carbon | 1361 | 1235 | 1316 | 589 | |
| Nitrogen | 48 | 86 | 84 | 54 | |
| Phosphorus | 27 | 57 | 38 | 17 | |
| Potassium | 36 | 82 | 53 | 72 | |
| Calcium | 5.1 | 26 | 5.7 | 6.2 | |
| Magnesium | 4.1 | 11 | 7.3 | 3.7 | |
Pattern of N loss was similar across all residues evaluated (Figure 4a). Parameters of k-value were not statistically different, nor did the half residence time ( t 1 2 ), which varied from 41-68 days (Table 2). Remaining proportions of N after 136 days of decomposition ranged from 17 to 46% from oat and spontaneous vegetation, respectively (Table 2). Rate of P loss from spontaneous vegetation residues was significantly lower than losses from other residues (between 55-70% slower), and was reflected in longest half-life value ( t 1 2 = 80 days, compared to 24-34 days).
Not significant differences were observed for K release from the residues studied. The fastest decomposition rates, and therefore, the shortest residence times, were identified for this element. Values of t 1 2 for K ranged from 8-11 days (from ryegrass to oat, respectively), whereas the final K concentration in residues varied from 2-5% of the initial amount (from ryegrass to the spontaneous vegetation, respectively). It is well known that K is present in high water-soluble forms in plant tissues resulting in faster rates of K losses than the respective dry matter loss of plant residue. This rapid release can be attributed to its presence as a mobile cation in the cell fluid, which is released upon disintegration of cell membranes and prone to removal following the first rain events (Rodríguez-Lizana et al., 2010).
The pattern of Ca and Mg release followed similar tendencies (Figures 3d, 3e). For both elements, significantly faster decomposition rates were evident for oat and ryegrass residues (Table 2). Release of half of the Ca and Mg concentrations ( t 1 2 ) in oat and ryegrass residues occurred between 33-45 and 21-39 days, respectively, while for the residues of oilseed radish and spontaneous vegetation, released half of Ca and Mg contents within 22-48 and 30-46 days, respectively.
Over time, that is 0-136 days, the loss of dry matter was explained by the fragmentation of the residues by the soil fauna and the decomposition of organic compounds by microbial population (Cotrufo et al., 2015; Nguyen and Marschner, 2017).
The extended half residence time of dry matter of spontaneous vegetation residues (as evidenced by the significantly higher t 1 2 values than other residues) may be explained by the presence of different types of weeds species, such as Rumex obtusifolius L., Paspalum notatum L. and Andropogon diceros L. resulting in a spontaneous vegetation with a heterogeneous composition which contributed to the lowest cellulose/lignin and the highest lignin/N ratios, and the lowest initial amount of cellulose (110 g kg-1) and the highest lignin content (335 g kg-1) comparing to other residues (Table 1). On the other hand, oat residue presented consistently higher decomposition rate (more evident for dry matter, carbon content, cellulose and non-structural compounds) than other residues demonstrating that a highest C/N ratio (>20) was not an indicator of a lower decomposition rate. These findings were confirmed by Martins et al.(2014) and Oliveira et al. (2016).
Interestingly and unexpectedly was the fact that, despite the lowest initial concentration of lignin in oilseed radish residue, the remaining material collected after 136 days of decomposition presented the highest proportion of lignin (33%). The secondary cell wall and the middle lamella are formed by lignin, making up mainly residual fibers. Thus, lignin is a component resistant to microbial decomposition (Talbot et al., 2012; Nguyen and Marschner, 2017). It could be speculated that the lignin chemistry present in oilseed radish is more resistant to decomposition comparing to other residues as evidenced by the data presented here (Talbot et al., 2012). The presence of highest cellulose concentration and highest cellulose/lignin ratio (7.0) probably helped to reduce the decomposition rate.
Table 3 presents the total amount of plant biomass (dry matter) and nutrients released by the different crop residues tested. Large amounts of dry matter and total carbon were released from oat residue. Decomposition of oilseed radish and ryegrass residues showed the highest potential for nutrient release. On the contrary, spontaneous vegetation may contribute to increase the soil organic carbon pool in the long term.
CONCLUSIONS
Decomposition of spontaneous vegetation residues exhibited the longest half residence time ( t 1 2 value) compared to the sown cover crops, showing the slowest mineralization rate. Contrastingly, oat residues showed the highest decomposition rate and short residence time in the present environmental conditions under the pear orchard. Among the sown crops, oilseed radish presented the largest amount of nutrients in its composition, therefore released the highest concentrations of these macronutrients over the evaluation period. Overall, oilseed radish showed interesting agronomic characteristics such as enhanced capacity for nutrient recycling while maintaining the largest amounts of residual biomass after 136 days among the introduced crops, which can be interesting for preserving orchard soil quality. Research is still necessary to further investigate the potential contribution of different cover crops residues to the mineral nutrition of pear trees. Spontaneous vegetation could possibly contribute for protecting the soil against erosion and to increase the soil organic carbon pool in the long term.


