INTRODUCTION
It is estimated that the world’s population will increase approximately 20% by 2050 (UN, 2019). Therefore, there is a need to maximize the production of animal protein, of which the production of ruminants in pastures is the most economical way. Abiotic factors have an influence on animal grazing production, with water deficit being the main limiting environmental factor for the development of forages (Batista et al., 2010; Schippers et al., 2015).
It is important to know the development of forages under conditions of water deficit to understand its effects on forage production. This knowledge helps management practices to optimize the use of forage and increase animal production in pastures during this period (Araújo et al., 2010; Euclides et al., 2016). Thus, the search for new forage cultivars tolerant to water deficit, has become the most assertive option for diversifying pastures in production systems (Euclides et al., 2014).
In the search for new cultivars to diversify pastures, Embrapa Dairy Cattle started breeding Urochloa ruziziensis (syn. Brachiaria ruziziensis) in 2004. U. ruziziensis is characterized as a perennial and creeping plant, dense leaf cover that grows at 1-1.5 m in height, with a decumbent base, with spikelets of 1 or 2 lines on one rachis side. Spikelets are approximately 5 mm long, hairy at the apical part and bisected along the rachis. In addition, it has short and strong rhizomes, hairy stem, linear and lanceolate leaves and inflorescence formed by 3 to 6 racemes. This species was used in the breeding program because it is the only genus that is diploid and sexually reproductive thus, this allows for the exploration of the existing genetic variability within the genus, making it possible to identify and select genotypes with a better forage quality (Souza-Sobrinho et al., 2016).
Therefore, it is essential to evaluate the behavior of material breeding that shows possibilities to enter the forage seed market, under water deficit conditions. Thus, the aim was to evaluate the tolerance of Urochloa spp. under periods of water deficit.
MATERIALS AND METHODS
The experiment was conducted in a greenhouse, at Juiz de Fora, Minas Gerais, Brazil (21°46'56.4"S and 43°22'12.7"W; 882 m asl), between February and July 2018. A thermometer located in the center of the greenhouse monitored the conditions of the greenhouse daily. The average maximum and minimum temperatures during the experimental period were 27.8°C and 18.8°C.
A completely randomized block design was used in a 12x4 factorial arrangement with 12 forage materials being nine genotypes improved by the breeding program of U. ruziziensis at Embrapa Dairy Cattle (G1, G2, G3, G4, G6, G7 , G8, G10, G11 and BRS Integra) and two commercial cultivars U. brizantha cv. Marandu and U. ruziziensis cv. Kennedy, and three periods of stress due to water deficit, plus a control (T1 - 30 days under 100% of field capacity (FC); T2 - 10 days under 30% of FC; T3 - 20 days under 30% of FC and T4 - 30 days under 30% of FC), with three replicates, totaling 144 experimental units.
The experimental unit was one plant per cylindrical polyethylene pot of 20 centimeters (cm) in height, 10 cm in radius and with a capacity of 4 cubic decimeters (dm³). The pots were arranged on benches each containing four kilograms (kg) of soil collected from the arable layer (0 to 20 cm) at the José Henrique Bruschi Experimental field (CEJHB) of Embrapa Dairy Cattle. Subsequently, the soil was removed and sifted in a two millimeter (mm) mesh sieve and then air dried.
The soil of the experimental unit showed a clay-clay-sandy texture, with 29% clay, 13% silt and 58% sand (according to the soil analysis protocol, using the “pipette” method), in the 0-20 cm layer. The pots were filled with soil with the following chemical characteristics: pH(H2O) 5.4; organic matter 2.18 dag kg-1; Ca 1.5 cmolc dm-3; P 2.5 mg dm-3; K 51 mg dm-3; Mg 0.8 cmolc dm-3; H + Al 3.14 cmolc dm-3; Al 0.3 cmolc dm-3; effective cation exchange capacity 2.5 cmolc dm-3; total cation exchange capacity 5.6 cmolc dm-3; base saturation 44%; aluminum saturation 4%; sum of bases 2.4 cmolc dm-3. Based on the chemical analysis of the soil, 0.496 g kg-1 of lime, 0.333 g kg-1 of simple superphosphate and 0.014 g kg-1 of potassium chloride were added according to the recommendations for the use of correctives and fertilizers in Minas Gerais - 5th approach (Cantarutti et al., 1999). The sources of phosphorus and potassium were mixed with the soil one month after adding the limes.
Seedlings were planted on 21st February 2018. After plant establishment, maintenance fertilization was carried out with nitrogen (N) and potassium (K) applying 0.1125 g kg-1 of N and 0.0156 g kg-1 of K, supplied in diluted water. This fertilization was divided into three applications with an interval of 21 days. During the initial phase of establishment, the soil of the pots was kept close to the field capacity (according to the methodology described by Bernardo et al., 2019) to guarantee the development of the plants in this phase.
The conditioning cuts were carried out on 11th June 2018 at 15 cm from the ground. The plants were submitted to treatments on the tenth day of regrowth and the pots were weighed frequently, replenishing the water when necessary, in order to meet the imposed treatments.
The genotypes were submitted to treatments for 30 days. The variables analyzed after this period were: number of tillers, number of leaves, plant height, dry mass of leaves, dry mass of stems, leaf/ stem ratio, leaf area, leaf length, average leaf width, maximum leaf width and SPAD (Soil Plant Analysis Development) index.
The height of the plants (cm) was measured with the aid of a graduated ruler, from the soil to the top of the highest leaf when the plant was fully extended. To evaluate the dry mass of the aerial part, the plants were cut at 15 cm from the soil, separating them into leaf blades and stems. Then, the samples were weighed and placed in a forced ventilation oven at 65ºC ± 5 ° C for 72 hours and then weighed again.
The leaf area (cm²), leaf length (cm), average leaf width (cm) and maximum leaf width (cm) were determined using the Portable Area Meter (LI-COR model LI-3000C).
The SPAD index (relative chlorophyll index determined based on the intensity of the green color of the leaves) was measured on three leaves per experimental unit, of which the youngest leaves were fully expanded. The reading was performed with a portable chlorophyll meter based on absorbance (SPAD-502, Konica-Minolta, Osaka, Japan).
The following model was used for variance analysis (ANOVA):
Yijk = μ + bk + αi + βj + (α*β)ij + eijk
Where:
Yijk = observation in kth block, in ith genotype and in jth stress time per water deficit;
μ = general mean;
bk = block effect (k= 1, 2 and 3);
αi = fixed effect of the genotype (i = 1, 2, 3, 4...12);
βj = fixed effect of stress time due to water deficit (j =0, 10, 20 and 30 days);
(α*β)ij = interaction of the effects of genotype i on stress time due to water deficit j;
eijk = random error associated to Yijk [eijk ~ NID (0, σ²)].
The data was subjected to an analysis of variance (p ≤ 0.05), proceeded by the Scott-Knott method of grouping averages at the level of 5% probability for the qualitative factor (genotypes) and regression analysis for the quantitative factor (time of stress due to water deficit). Statistical analyzes were performed with the aid of the R Core Team (2019) software.
RESULTS AND DISCUSSION
There was no interaction effect between the genotype factors and stress time due to water deficit (p > 0.05) for the analyzed variables.
There was a difference in the genotype factor (p ≤ 0.05) for all response variables (Table 1). Among the evaluated genotypes, G11 stood out from the others because it had lower height, a greater number of tillers, high leaf mass, low stem mass, greater number of leaves, greater area, and leaf length. These characteristics suggest that this genotype has the potential to integrate animal production systems. The small size ensures the material is easy to handle (Valle et al., 2017). The largest number of tillers ensures forage greater mass production (Lima et al., 2019), however, it cannot be considered in itself as an indicator of greater plant persistency (Sbrissia et al., 2010). The greater amount of leaf allows animals greater selectivity, since they have better nutritional value, consequently, result in superior animal performance (Fonseca et al., 2012).
Table 1 Analysis by the Scott-Knott means grouping method for the qualitative factor (genotypes) in a greenhouse in Juiz de Fora-MG, in 2018, for the variables: plant height (PH), number of tillers (NT), dry mass of leaves (DML), dry mass of stems (DMS), leaf/stem ratio (DML/DMS), number of leaves (NL), leaf area (LA), leaf length (LL), average leaf width (ALW) and maximum leaf width (MLW) and SPAD (Soil Plant Analysis Development) index
| Genotypes | Variables | ||||||||||
| PH | NT | DML | DMS | DML/DMS | NL | LA | LL | ALW | MLW | SPAD | |
| G1 | 73.92 c | 17 c | 4.18 b | 1.83 b | 2.08 b | 54 c | 1702.6 c | 1590.1 c | 1.02 b | 1.50 b | 45.31 a |
| G2 | 75.00 c | 22 b | 4.39 b | 2.35 a | 1.82 c | 67 b | 1871.1 c | 2051.6 b | 0.86 c | 1.35 b | 35.07 c |
| G3 | 74.92 c | 9 c | 4.47 b | 1.26 b | 3.62 a | 59 c | 1995.0 b | 1974.8 b | 0.97 b | 1.51 b | 37.27 b |
| G4 | 86.00 b | 15 c | 4.46 b | 2.23 a | 1.95 c | 56 c | 1879.8 c | 1977.0 b | 0.90 c | 1.42 b | 38.67b |
| G6 | 89.46 b | 19 c | 5.25 a | 2.57 a | 1.95 c | 55 c | 2141.5 b | 2126.6 b | 0.96 b | 1.49 b | 37.94 b |
| G7 | 87.50 b | 14 c | 4.49 b | 1.95 b | 2.19 b | 44 c | 1679.4 c | 1566.0 c | 1.02 b | 1.53 b | 43.57 a |
| G8 | 86.42 b | 17 c | 3.30 c | 2.21 a | 1.41 c | 54 c | 1569.8 c | 1579.7 c | 0.93 c | 1.37 b | 36.19 c |
| G10 | 94.25 b | 14 c | 5.77 a | 3.21 a | 1.66 c | 56 c | 2657.5 a | 1949.8 b | 1.30 a | 1.83 a | 43.24 a |
| G11 | 76.50 c | 29 a | 5.54 a | 1.94 b | 2.61 b | 95 a | 2753.0 a | 3391.0 a | 0.76 c | 1.19 b | 34.76 c |
| BRS Integra | 71.33 c | 24 b | 5.95 a | 1.54 b | 3.18 a | 72 b | 2020.4 b | 1895.7 b | 0.92 c | 1.39 b | 35.06 c |
| Kennedy | 73.17 c | 23 b | 5.95 a | 2.10 a | 2.36 b | 79 b | 2261.1 b | 2227.8 b | 0.89 c | 1.37 b | 33.63 c |
| Marandu | 106.25 a | 14 c | 5.46 a | 2.38 a | 2.16 b | 46 c | 2099.4 b | 1933.2 b | 0.99 b | 1.48 b | 43.66 a |
| C.V.% | 10.88 | 30.10 | 19.81 | 44.60 | 28.18 | 24.18 | 25.36 | 28.20 | 18.14 | 16.78 | 8.49 |
*Means followed by the same letter in the column do not differ by the method of grouping Scott-Knott averages at 5% of probability.
C.V.%- coefficient of variation.
The time of water deficit did not influence the number of tillers and the number of leaves (p > 0.05). The period when the largest tiller emission occurs during the establishment of the forage (Santos et al., 2012; Oliveira et al., 2015), when water availability was being maintained in field capacity, before the period of stress. Beloni et al. (2017) observed similar results, but evaluating morphological and physiological behavior of accessions of Paspalum sp. and U. brizantha cv. Marandu.
According to Silva et al. (2008), the action of water stress on productivity varies according to the stage of plant development. For this reason, water stress was submitted only after the plant establishment phase. Santos et al. (2012) evaluating wheat cultivars submitted to water deficit at the beginning of flowering, found a reduction in the number of tillers per plant under water stress conditions. According to the authors, even if the tillering phase had already occurred before the application of water stress, the reduction was caused by the need for plants to reduce their leaf area through the death of tillers in search of their persistence.
The number of leaves showed a divergent response from the results found by Bonfim-Silva et al. (2011), where they observed a reduction in the number of leaves in corn and sorghum crops among water availability subjected to water stress.
When evaluating the morphogenic responses of forage grasses under different water conditions, Silva et al. (2005) observed a decrease in the number of leaves expanded per tiller, mainly in Angola grass and grass in more severe levels of water deficit. A similar situation was also observed in U. brizantha cv. Xaraés, U. ruziziensis, P. glaucum cv. ADR 7010, P. glaucum cv. ADR 300 and M. aterrima when subjected to water stress (Petter et al., 2013). It is believed that the water level at 30% of the field capacity used in this work and the characteristics of the climate during the experimental period were not sufficient to cause a reduction in the number of leaves regardless of the time of water deficit used in the study.
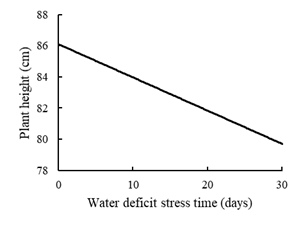
For the plant height, the 1st -degree regression model was adapted (p = 0.013) (Figure 1), where it was observed the occurrence of height reduction between the times when the plants were submitted to water deficit, leading to a reduction of approximately 8% between the conditions of field capacity and the situation of longer time in water deficit. Corroborating with the data found by Silva et al. (2020), who observed a 60% reduction in the height of cultivars of U. brizantha (Piatã, BRS Paiaguás, and MG13 Braúna) when subjected to water stress. However, Beloni et al. (2018), found no difference in plant height between the three cultivars of Urochloa spp. (U. brizantha cv. Marandu and Paiaguás and U. decumbens cv. Basilisk) and cultivar Medly (Dactylis glomerata L.) under water deficit conditions.
The decrease in the height of plants subjected to water deficit is due to the reduction of the turgidity pressure in the cells since for the occurrence of cell growth, minimum levels of this pressure are required (Kramer and Boyer, 1995).
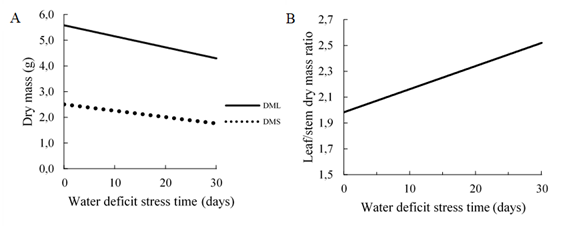
The biomass production of the aerial part is probably one of the most important particularities in relation to the potential yield of forage plants (Cezário et al., 2015). The production of leaves (p = 0.001) and stems (p = 0.008) dry mass, adapted to the 1st degree regression model (Figure 2A). It was observed a reduction in the accumulation of leaves and stems dry mass due to the increase in the period under stress due to water deficit of 23% and 30%, respectively. The decrease in the dry mass of forage leaves of the Urochloa genus when subjected to water deficit was observed by Kroth et al. (2015), Mattos et al. (2005), Pezzopane et al. (2015) and Beloni et al. (2017) for accessions of the genus Paspalum.

Figure 2 A) Production of dry mass of leaves (DML) (g) and stems (DMS) (g); B) Leaf/Stem ratio (DML/DMS) as a function of time of stress due to water deficit (0, 10, 20 and 30 days).
Regarding the dry mass of stem in the study by Kroth et al. (2015), Pezzopane et al. (2015) and Poustini et al. (2007) also was observed a decrease in water deficit conditions. However, Mattos et al. (2005) observed a reduction in the dry mass production of stems in U. decumbens and U. mutica, however, the same effect was not observed in U. brizantha and U. humidicula.
Roots play an important role in regulating water intake and maintaining the plant's water balance (Rouached et al., 2013; Santos et al. 2013; Cardoso et al., 2015; Beloni et al., 2017, 2018; Silva et al., 2020). It is believed that the negative effects of water deficit in the portion of leaves and stems, may primarily affect the root system, which results in a decline in water assimilation, reduces the water potential of the aerial part and photosynthesis presents a more severe reduction than breathing. (Pande and Singh, 1981). However, during this study, it was not possible to carry out this evaluation, which does not allow us to conclude that this occurred with the forages under study.
The leaf/stem ratio (L/S), adjusted to the 1st-degree regression model (p = 0.043) (Figure 2B), where a linear increase was observed as a function of the imposed water deficit period. This variable is essential to determine the supply of nutrients and to establish management strategies for forage grasses (Wilson, 1982), the high L/S ratio gives the forage plant a higher nutritional quality in addition to greater acceptability by animals (Mezzalira et al., 2017).
Regardless of the experimental conditions imposed, the observed L/S ratio was higher than the critical one (1), described by Pinto et al. (1994). Kroth et al. (2015) also found the highest L/S ratio under water deficit conditions in cultivars of U. brizantha. The period of development of the plant affects these results since a larger portion of leaves was observed in the early stages of development (Rodrigues et al., 2008).
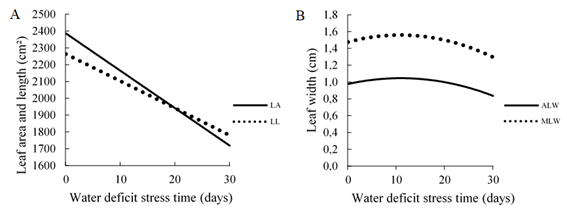
The measures of leaf area (p = 0.001) and leaf length (p = 0.001) adjusted to the linear regression model (Figure 3A). It was found that when subjected to the longest time of water deficit, the measures were negatively influenced. Water stress reduced the leaf area variable by 28%, between treatment in field capacity and 30 days under stress. For the leaf length variable, this reduction was 21%.

Figure 3 A) Leaf area (LA) (cm²) and leaf length (LL) (cm); B) average leaf width (ALW) (cm) and maximum leaf width (MLW) (cm) as a function of water deficit stress time (0, 10, 20 and 30 days).
The reduction in leaf area and length was observed in a study with several forage species (Barreto et al., 2001; Guenni et al., 2002; Santos et al., 2013; Cardoso et al., 2015; Beloni et al., 2017; Silva et al., 2020). The authors refer to this decline to an increase in the proportion of dead tissue, a reduction in the number and size of cells, and an increase in the allocation of resources for root development.
The quadratic regression model (Figure 3B) was applied for the variables average leaf width (p = 0.001) and maximum leaf width (p = 0.001). The maximum point of the regression curve for both the average leaf width and maximum leaf width variable occurred at 11 days of stress due to water deficit with an average width of 1.04 cm and a maximum width of 1.55 cm. Water stress promoted a reduction of approximately 20% in the average leaf width and 17% in the maximum leaf width of the maximum points of the curves until the conditions of greater stress time due to water deficit.
The stress, submitted to genotypes, increased the width of the leaves in the early stages. According to Bonfim-Silva et al. (2014), when submitted to water deficit, forages tend to have their maximum leaf development, due to their compensatory growth (Páez and González, 1995). There was a reduction in leaf width with increasing time in water deficit, a strategy used by the plant, where the leaves are curled in an attempt to reduce water loss to the environment (Taiz and Zeiger, 2013). Cardoso et al. (2015) when evaluating Pennisetum purpureum cv. Napier and U. hybrid cv. Mulatto II in situations of water deficit also observed leaf curling.
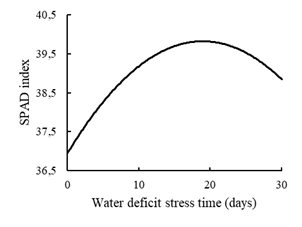
The SPAD reading (p = 0.002) adjusted to the quadratic regression model (Figure 4). The maximum point of the regression curve occurred at 19 days of stress due to water deficit with an index of approximately 40 SPAD units. It is possible to verify lower rates when the plants were subjected to shorter water deficit conditions, confirming the effect of diluting the chlorophyll content (Ashraf and Chishti, 1993).
The effect of diluting the chlorophyll content in conditions of greater water availability was also reported in the work by Bonfim-Silva et al. (2014), where they evaluated the production and development of grass convert HD364. The reduction in the SPAD index in a long time of water deficit is mainly due to the process of premature leaf senescence in an attempt to guarantee the survival of the plants with the reduction of water loss by the leaves. This effect was also observed in the study by Beloni et al. (2017), which evaluated accessions of Paspalum sp. under water deficit.


