INTRODUCTION
The use of rainfall simulators (RS) in the investigation of soil erosion dates to 1930. Since then, the evolution of this equipment has made it increasingly accessible, practical, and precise (Alves Sobrinho et al., 2008; Carvalho et al., 2022). Its applications include assessing the impacts of soil erosion as a function of land use and land cover (Almeida et al., 2016) and soil water infiltration rate (Almeida et al., 2018; Moraes et al., 2020), as well as assisting in the calibration of hydrological models for erosion estimation.
Studies with RS have numerous advantages, such as the reduction of time and costs required to obtain the results and the repeatability of precipitation, the elimination of the erratic and unpredictable variability of natural precipitation, which allows a better evaluation of the factors influencing the process (Alves Sobrinho et al., 2008; Iserloh et al., 2013).
The InfiAsper simulator, developed by Alves Sobrinho et al. (2008) is composed of five independent modules, which facilitate transport and operation in the field. It has two fixed spray nozzles (Veejet 80.150 model), which must be positioned 2.30 m above the ground during operation. The nozzles are located above the overlapping shutter disks, whose rotation is set by the input frequency of the shutter motor, using the frequency inverter installed on the panel of the precipitation simulator.
Most RS works with constant rainfall intensity (RI), which does not represent the characteristics of natural precipitation and can lead to differences in soil and water loss studies. However, Macedo et al. (2021) developed an automatic RI control system for InfiAsper by adjusting the rotation of the shutter disk to allow for RI variation. The authors created an electronic control system that changes the frequency of the motor power inverter, allowing the user to enter the desired precipitation pattern via a text file, stored on a micro-SD memory card.
Here, we present the innovations of InfiAsper in the last 14 years and some results obtained from using it to assess soil erosion and soil water infiltration under different conditions of land use, land management, and land cover, in the field, in Brazil.
MATERIAL AND METHODS
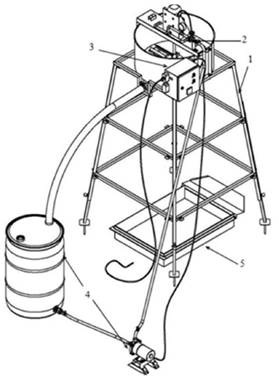
The InfiAsper simulator (Figure 1) operates with two Veejet 80.150 nozzles parallel to each other, installed at a height of 2.3 m above the ground and with a service pressure of 35.6 kPa. The micro-plots have an area of 0.7m2 and are delimited by galvanized steel plates, with a funnel at the end, which allows collecting the volume of surface runoff (Alves Sobrinho et al., 2008; Almeida et al., 2018; Macedo et al., 2021).

Figure 1 Scheme of the components of the InfiAsper rainfall simulator (Legend: metallic structure (1); water application unit (2); control panel (3); reservoir and water pump (4); and runoff collector (5). Source: Macedo et al. (2021).
To demonstrate the use of InfiAsper in soil erosion assessment, we will present results from two studies done with the equipment in the field. In the first, Almeida et al. (2018) evaluated the effect of soil tillage and soil cover on soil water infiltration by measuring this parameter in areas under bare soil, soybean (conventional tillage and no-till), and pasture. The experimental design was completely randomized, arranged in subdivided plots (in time - 6 evaluation periods), with four repetitions for treatment. The predominant soil in the area is an Argissolo Vermelho Distrófico típico (Santos et al., 2018) (Dystric Acrisol with a sand loam texture, 0.0-0.24 m) (IUSS Working Group WRB, 2015). The depth of water infiltration (DWI) was estimated by the difference between the artificial rain and the surface runoff (SR). The SR was calculated each minute through the relation between the volume of water and the experimental plot area. The infiltration rate was calculated by the relation between the DWI and the considered sampling time. The stable infiltration rate (SIR) of water in the soil was obtained when the SR remained constant (Almeida et al., 2018).
In the study by Carvalho et al. (2022), the authors evaluated the InfiAsper operating with a new control panel to program rainfalls with different RI. Infiltration rates and soil and water losses were evaluated in a Argissolo Vermelho-Amarelo Distrófico típico (Santos et al., 2018) (Dystric Acrisol with a clay loam texture) (IUSS Working Group WRB, 2015) with simulated rainfalls of 30 mm and duration of 40 min, considering advanced (AD), intermediate (IN), delayed (DE), and inverted intermediate (II) patterns, all with PI peaks of 110 mm h-1, and a constant (CT) pattern. The experimental design was in randomized blocks with five treatments and five repetition each.
In both studies, we verified the normality and homogeneity of the residuals using the Shapiro-Wilk (Shapiro & Wilk, 1965) and Bartlett's (Bartlett, 1937) tests, respectively. When a significant difference was confirmed in the analysis of variance, we compared the means of the treatments using the Scott-Knott (Scott & Knott, 1974) grouping test, considering a significance level of p < 0.05. We use R language (R Core Team, 2021) to do all the analysis and data plotting.
RESULTS AND DISCUSSION
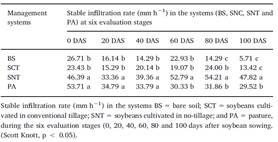
The stable infiltration rate (SIR) in the soybean no-tillage system is higher than in the other systems at 40 days after planting. In addition, SIR values in bare soil and soybean under conventional tillage systems were iqual (Table 1).
Table 1 Stable infiltration rate (mm h-1) in the systems (BS, SCT, SNT and PA) at six evaluation stages

According to Almeida et al. (2018), the SIR in the SNT and PA systems did not differ among the stages 0, 20 and 40 days after sowing (DAS). In these two treatments, the SIR is greater than in the other treatments. From 60 DAS on, the no-tillage SIR is significantly greater than in the other treatments. On the other hand, between the two conventional tillage systems, with disturbed soil, (BS and SCT), the SIR differed at 80 DAS when the soybean proportionated greater vegetal cover in the SCT, therefore, favoring water infiltration in the soil. At this stage, the highest percentage of soybean cover in the SCT tend to promote a high soil water infiltration in this system, such as reported by Almeida et al. (2016).
Carvalho et al. (2022) did not verify surface runoff associated with the simulated rainfall under the CT and II patterns. For the other patterns, the time to start runoff (TSR), the runoff ending time (RET), and the maximum runoff rate (MRR) varied with the PI peak, and their values were significantly different from each other (Table 2).
Table 2 Mean values and respective standard deviations of the time to start runoff (TSR), the runoff ending time (RET), and the maximum runoff rate (MRR)

Differences regarding TSR and RET are associated with the PI peaks that characterize the precipitation patterns. On the other hand, MRR values vary according to surface conditions and soil moisture in the superficial layers. The MRR in DE pattern was 2.28 times higher than in the AD pattern.
For Macedo et al. (2021) and Carvalho et al. (2022), the new modified simulator panel, built with a friendly interface, allows the selection of the desired rainfall pattern and operating mode (manual or automatic). After modification of InfiAsper, the simulated precipitation had an application uniformity higher than 75%, used as a prerequisite in field-generated soil erosion, infiltration, and runoff studies.
CONCLUSIONS
Regardless of the soil tillage, soil ground cover, or rainfall intensity used (considering the efficiency range that the equipment works properly), InfiAsper performs very well in assessing soil water infiltration and soil erosion.
With the modification made by Macedo et al. (2021), InfiAsper can be used in various applications to fill many old gaps in the comparison of simulated rainfall with natural rainfall through the instantaneous variation of rainfall intensity and the reproduction of natural rainfall.


