INTRODUCTION
Sugarcane plays an important role in sugar and biofuel production worldwide, and Brazil is the world largest sugarcane producer (CONAB, 2020). In the 2019/2020 biennium, the total production was 642,717.8 thousand tons. However, average productivity in Brazil, 77 t ha-1 (CONAB, 2020) is lower than the potential of this crop, approximately 200 t ha-1 when proper management is practiced (Oliveira et al., 2011b).
Sugarcane is cultivated in different soil types (fertility levels) and climatic conditions (water supply) in Brazil (Uchôa et al., 2009, Simões Neto et al., 2015) whose reduction reduces the average productivity. Besides that, when sugarcane is irrigated it can produce approximately 180% more stalks than rainfed sugarcane (Oliveira et al., 2011b). Moreover, the adequate fertilization recommendation also influences sugarcane production.
It is estimated that 15% of all NPK fertilizer consumed in Brazil is used in sugarcane crops (Cella & Rosi, 2010). This data demonstrates the importance that fertilization has for this crop and, in particular, potassium (K) fertilization, as it is the nutrient required in the greatest quantity for sugarcane.
Potassium fertilization in Brazilian sugarcane fields and in other countries has shown positive effects on productivity (Uchôa et al., 2009; Rhodes et al., 2018). Despite that, Brazilian soils are, in general, poor in this nutrient. This fact makes K fertilization indispensable for maintaining a high sugarcane productivity (Cavalcante et al., 2016). Additionally, sugarcane varieties have different capacities for nutrient absorption and accumulation (Oliveira et al., 2011a), but fertilizer recommendations have been generalist for all soil types and sugarcane varieties.
Despite the positives effects on productivity, negative effects have also been reported when high K rates are applied to the soil (Uchôa et al., 2009; McCray et al., 2017). Furthermore, negative effects on leaf Ca and Mg levels (Li et al., 2018; Xie et al., 2020) and on chlorophyll content (K2O doses above 187 to 203 kg ha-1, according to the variety utilized) were also observed (Ariyanto and Hartatik, 2021). Uchôa et al. (2009) and Otto et al. (2010) observed a maximum sugarcane productivity using K2O doses varying from 150 to 250 kg ha-1, and observed a decrease of productivity at higher rates than those.
Although the amount of K2O for sugarcane is well-known, the physiological aspects that promotes a decrease in sugarcane productivity under higher rates of K is not clear enough.
Potassium is essential to promote cell turgor and stomatal opening and closing and it is responsible for several enzymatic complexes activation and cell osmotic control (Rao et al., 2014; Taiz et al., 2017). Adequate K nutrition allows plants to have appropriate physiological and biochemical homeostasis. Characteristics such as stomatal conductance, net photosynthesis, transpiration, osmotic control, carbohydrates and proteins metabolism (Wang et al., 2012, Cavalcante et al., 2015) are optimized when plants are under this condition.
We hypothesized that decline in sugarcane productivity is due to impairment on photosynthetic pigments and decrease in leaf Mg levels caused by the salinity increase by K fertilization with K2O high doses. In this way, this study was set to evaluate the application of K rates, as KCl, on sugarcane productivity and to investigate the physiological (photosynthetic pigments) and nutritional (leaf K, Mg and S concentrations) reasons that promotes sugarcane production loss.
MATERIAL AND METHODS
The experiment was carried out in 2016 during the months of January to December (plant cane). The experiment was conducted in the city of Caaporã, Paraíba, Brazil, with geographical coordinates 7º 30' 30.194324’ of South Latitude and 34º 52 '33.169375’ of West Longitude. The municipality is 37 m above sea level and has an Am climate, according to climatic classification of Köppen.
In the experiment area, five soil samples were collected up to 0.20 m deep to compose a composite sample, and chemical analysis were carried out to assess soil fertility [pHwater: 4.7; the total organic carbon (TOC: 3 g kg-1); P (Mehlich 1): 8 mg dm-3; Na+: 0.02 cmolc dm-3; K+: 0.12 cmolc dm-3; Ca2++Mg2+: 2.1 cmolc dm-3; Al3+: 0.2 cmolc dm-3 and H + Al: 2.3 cmolc dm-3]. The concentration of Zn: 1.3 mg dm-3; Cu: 4.43 mg dm-3, Mn: 5.1 mg dm-3, Fe: 88.3 mg dm-3. With these results, the potential the cation exchange capacity (CEC) potential (Na++K++Ca2++Mg2++H+Al): 4.54 cmolc dm-3 and CEC effective (Na++K++Ca2++Mg2++Al3+): 2.44 cmolc dm-3, base saturation (V [Na++K++Ca2++Mg2+/CEC potential)x100]: 49.33%) and aluminum saturation (Alsat [(Al3+/CEC effective)x100]: 8.19%) were calculated.
The soil was physically characterized for soil particle distribution (sand: 845; silt: 35 and clay: 120 g kg-1), particle density (2.82 Mg m-3), 20 g of soil were dried in an oven at 105ºC, transferred to a 50 mL volumetric flask, the volume was made up with alcohol. Particle density was calculated by the ratio between dry soil and the volume occupied by the soil obtained by the difference (50 mL - volume of spent alcohol), soil density (1.32 Mg m-3), soil density was determined by collecting 50 cm3 soil sample with stainless-steel ring, the soil collected was dried at 105ºC and soil density was calculated by dividing the soil mass by the soil volume, total porosity [(1-soil density/particle density)x100] (53%), and electrical conductivity. For determination of soil electrical conductivity (EC), soil samples (0-0.25 cm) were collected in all treatments one month after fertilizer K application (Donagema et al., 2011).
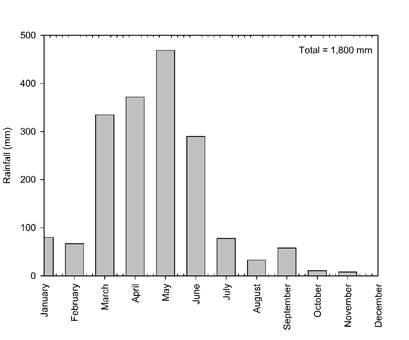
During the experiment, the amount of rainfall was 1,800 mm (Figure 2).
The experiment was carried out in randomized blocks design, with six doses of K2O (0; 25; 50; 100; 200; and 250 kg ha-1) and four replications, totaling 24 experimental units. One variety of sugarcane (RB 992506) was used, which is one of the most recently released varieties.
The experimental plots comprised six planting lines in double rows spacing (1.5 x 0.9 m) with 10.0 m in length, corresponding to a total area of 72 m2. The evaluations were made in the four central lines excluding 1.0 m on each side of the plot, totaling 37.6 m2 (net-plot).
Prior to sugarcane planting, soil chemical control of spontaneous plants, subsoiling, plowing and harrowing and, later, furrowing was performed in accordance with the farmer practices. Sugarcane was planted by distributing stalks in the furrow in order to coincide the end of one with the base of the other. Approximately 18 Mg ha-1 of stalks were distributed, with subsequent sectioning in order to obtain, on average, 24 buds per meter.
The soil was amended using 1.1 Mg ha-1 of dolomitic limestone, with 85% relative neutralizing power. The liming requirement was calculated using the base saturation method, increasing the base saturation up to 70%. In the experimental area, 1.0 Mg ha-1 of mineral gypsum was applied based on the Ca export by sugarcane in four successive crops (Oliveira et al., 2010). The correctives were broadcasted in the field without incorporation due to the physical quality of the soil (845 g kg-1 of sand) and to improve the uniformity of application.
Basal fertilization was carried out in the planting row with 60 kg ha-1 of N as urea + 200 g ha-1 of Mo (Oliveira, 2012) and 180 kg ha-1 of P2O5 as a triple superphosphate (Simões Neto et al., 2015). Potassium was applied according to the treatment rates, using potassium chloride as fertilizer. The fertilization was completed with the application of 2.6 kg ha-1 of Cu, 4 kg ha-1 of Zn, 5.2 kg ha-1 of Mn in the form of sulfate (IPA, 2008) and 2.0 L ha-1 of B, according to fertilization management used by the farmer. Fungicide (0.5 L ha-1), nematicide (5 L ha-1) and terminicide (0.2 kg ha-1) were applied on the stalks, before closing the planting furrows.
Four months after planting, the middle third of 15 diagnostic leaves (leaf +1) per plot were collected to determine the nutrients: K, Mg and S. The period of leaf sampling coincided with the beginning of the maximum tillering period of sugarcane and beginning of the highest pluviometric indexes. The nutrients determinations were performed according to EMBRAPA (2009).
The middle third of 15 index leaves (leaf +1) were also collected per plot at nine months after planting, sugarcane maturation phase, to determine proline and leaf pigments. The leaves were sampled, wrapped in aluminum foil and submerged in liquid N for 10 to 20 seconds. After collecting each block, the samples were transferred and stored in a thermal box containing ice.
Proline, an osmoregulatory amino acid accumulated by plant cells under stress conditions such as osmotic stress caused by an increase in soil electrical conductivity, was determined as described by Bates et al. (1973) and chlorophyll a, chlorophyll b, total chlorophyll (a+b) and carotenoids concentrations were determined according to Hendry & Grime (1993).
The increase in plant productivity was evaluated by harvesting (December 2016) all plants in each net plot. After harvesting, the plants were weighed on a dynamometer and their values estimated per hectare (10,000 m2). The difference in productivity between the K2O rates and the control treatment corresponded to the increase in productivity (Mg ha-1).
The data obtained were submitted to regression analysis (p<0.05). The coefficients of the regression parameters were tested using the t test (p<0.05). These analyzes were performed using the SISVAR software version 5.8 (Ferreira, 2011). The significance (p) and determination coefficient (R2) are presented in the figures.
RESULTS AND DISCUSSION
Sugarcane leaf concentrations of K, Mg, S and the increase on plant productivity were influenced by K fertilization and the regression analysis showed significant effects (p<0.05) for these variables (Figure 3).
Leaf K concentration increased linearly with the increase of K2O application (Figure 3A). The highest dose (250 kg ha-1 K2O) promoted 20% increase in leaf K concentration compared with the control treatment. Sulphur also had a linear increase with the K application (Figure 3C). The highest K2O dose (250 kg ha-1) promoted 40% increase in S leaf concentration in comparison with the treatment without K fertilization. Magnesium, nevertheless, had linear decrease in foliar concentration along with the increase in K2O fertilization. The decrease in Mg foliar concentration promoted by the highest K2O dose applied (250 kg ha-1) was 25% less than the control treatment (Figure 3B).
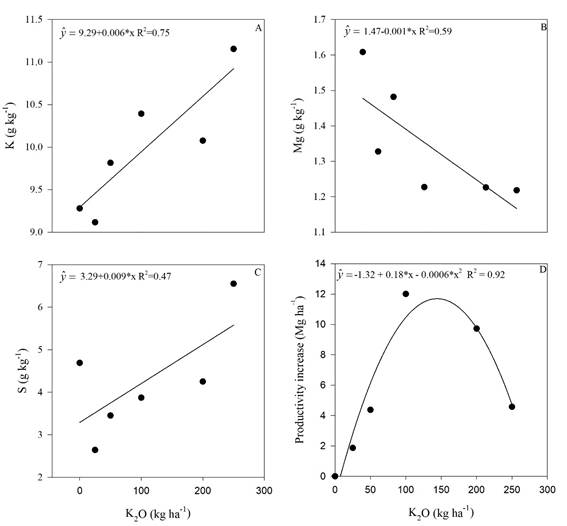
Figure 3 Potassium (A), magnesium (B) and sulfur (C) levels in sugarcane leaves, and plant productivity (D) in the sugar cane RB 992506 variety as a function of potassium rate. * Significant (p<0.05), R2 determination coefficient. Means of 4 replications.
Increase of leaf K concentrations due to K fertilization (Figure 3A) is reported in the literature (Uchôa et al., 2009; McCray et al., 2017), and it is an expected result. However, the increase of leaf K concentration in sugarcane was accompanied by a reduction in Mg concentration (Figure 3B) and by an increase in S concentration (Figure 3C).
Decrease in Mg concentration due to leaf K increase in response to K fertilization was observed in sugarcane by Rhodes et al. (2018) and in tomatoes by Li et al. (2018). Potassium and Mg are cationic nutrients that compete for soil adsorption sites and for plant absorption. The excess of one can affect the absorption of the other one due to reduction of the element activity that has the lowest concentration in the soil solution (Alleoni et al., 2009) or due to its leaching to deeper soil layers. These findings were observed for exchangeable Mg in a K fertilized soil (Ernani et al., 2007) and, consequently, there was a reduction on Mg2+ absorption by plants.
Another important issue between K+ and Mg2+ absorption antagonism is due to the greater absorption efficiency that plants have for K+ in relation to Mg2+ and their competition for similar cell transporters (Li et al., 2018).
Furthermore, it is recognized that K+ and Mg2+ absorption by plants roots is non-specific. The ion channels and membrane transporters have low, or even, no selectivity for these cations. The inhibition of Mg2+ absorption by K+ is due to its competition for the absorption sites in plants plasma membrane (Xie et al., 2020).
The increase in S concentration in the sugarcane leaves (Figure 3C) due to the increasing K rates may be due to the greater enzyme activity involved in proteins metabolism and better use efficiency of the gypsum used to amended the soil. In one experiment with soybean with two K rates (0 and 60 kg ha-1 of K2O, as KCl) and with S rates (0 to 120 kg ha-1, as gypsum), Moda et al. (2013) observed that K fertilization promoted increase in leaf S higher than without K fertilization, and this was attributed to the better use efficiency of the sulphur applied as gypsum.
Potassium is an activating nutrient for several enzyme complexes, including protein and amino acid metabolism enzymes (Meurer, 2006). Sulphur is an amino acid precursor element, it is needed for composition of the essential amino acids cystine, cysteine and methionine (Dechen et al., 2007). In this way, increase in leaf K+ levels may be positively affected amino acid synthesis and promoted higher leaf sulphur levels.
The sugar cane productivity increased as a quadratic response after K application (Figure 3D). This is well reported in the literature (Uchôa et al., 2009, Caione et al., 2011).
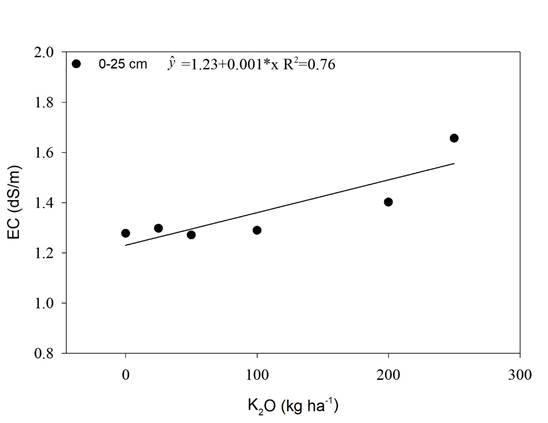
Maximum agronomic efficiency was obtained with a dose of 150 kg ha-1 of K2O, and a sharp decrease thereafter (Figure 3D). The decrease in productivity might be due to an increase of soil electrical conductivity (EC) (Figure 1). Dias & Blanco (2010) reported that sugarcane threshold for salinity is 1.7 dS m-1.
In this study the soil EC reached 1.38 dS m-1 due to K fertilization when the maximum agronomic efficiency dose of K2O, 150 kg ha-1, was calculated with the equation present in Figure 1, which may be the cause of productivity reduction. This value is lower than the threshold of soil EC reported by Dias & Blanco (2010), 1.7 dS m-1, and might be due to a lower tolerance to salinity in the RB 992506 than the sugarcane variety studied by the above-mentioned authors.
Soil electrical conductivity is related to the amount of salts and, thus, related to soil salinity (Ribeiro et al., 2016). Soil salinity is one important cause of yield reduction in agriculture (Medeiros et al., 2016). Soil salinity reduces the plant capacity to absorb water, nutrients and causes ion toxicity, especially due to high sodium concentrations (Dias et al., 2016).
Biochemical alterations due to the increase in soil salinity is related to the increase in reactive oxygen species (ROS), that are harmful to several cell components (nucleic acids, proteins, lipids, membranes), and they are produced in the chloroplasts and mitochondria. So those structures are the first to be damaged by ROS under stressful conditions (Prisco et al., 2016).
To avoid decrease in chlorophyll concentration, one way plants developed to counter act this problem is to increase the osmoregulatory compounds in plants cells, as proline concentration (Taiz et al., 2017). In a study with sugarcane, Cruz (2015) observed reduction in chlorophyll concentration caused by salt stress and, along with this reduction, the author observed increase in proline concentration.
As chlorophylls are the pigments responsible to produce energy that drives the process of carbon (CO2) reduction and assimilation into organic compounds (Taiz et al., 2017), the degradation of chlorophylls (Figure 5) by increase in salinity promoted by K fertilization (Figure 1) might be de cause of productivity reduction (Figure 3 D) even when there is increase in osmoregulatory compounds such as proline (Figure 4).
The regression analyses performed for proline (Figure 4), chlorophyll a, b, total and carotenoids (Figure 5) showed significant effects of K fertilization (p<0.05).
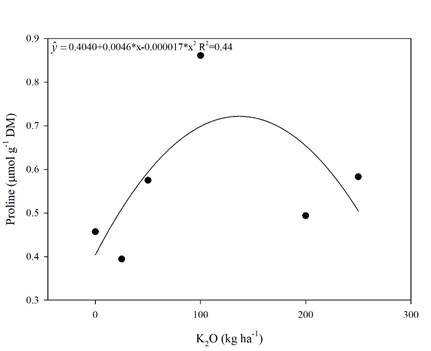
Figure 4 Proline concentration in sugarcane leaves in the RB 992506 variety as a function of potassium rates. * Significant (p<0.05), R2 determination coefficient. Means of 4 replications.
Proline had a significant (p<0.05) quadratic response. By performing the first derivative of the equation (Figure 4), the dose that promoted the maximum proline accumulation was 135 kg ha-1 of K2O. But, from this K rate on, a decrease in proline concentration was observed.
Proline is one of the solutes accumulated by plants in stressful situations, such as water, salt and oxidative stresses in order to maintain cellular hydration and not compromising the enzymatic metabolism. The osmotic adjustment has the purpose of reducing the cellular water potential without cell turgor loss (Ahmad & Maathuis, 2014; Gupta & Huang, 2014).
A study with salt stress in rice (Zain & Ismail, 2016) observed proline concentration increase by K fertilization up to 160 kg ha-1 of K2O. This increase was attributed to the salinity promoted by the K fertilizer. As observed in the present experiment, K fertilization with KCl increased the soil electrical conductivity (Figure 1) and, thus, proline increase was also observed (Figure 4).
In our study, K2O rates linearly increased the soil EC and this increase was 1.38 dSm-1 (Figure 1) by using the dose of maximum efficiency for productivity, 150 kg ha-1 of K2O (Figure 3 D). 1.7 dSm-1 is the threshold of salinity tolerance for sugarcane reported by Dias et al. (2010). Although, the value found in the present study, 1.38 dSm-1, was similar to the one reported by Dias et al. (2010), 1,7 dSm-1, the lower soil EC value found in the present study that caused productivity loss might be due to the lower tolerance to salinity in the sugarcane variety used in the experiment (RB 992506).
One of the plant’s strategies to overcome the salt stress and, consequently, maintain the plant productivity, consists in leaf proline accumulation in the cell vacuole (Carvalho, 2015). However, K2O rates above 135 kg ha-1 promoted a decrease in proline concentration (Figure 4), meaning that rates above 135 kg ha-1 promote a decrease in sugarcane productivity (Figure 3D). This K2O rate may represent the limit to which the proline osmoprotection starts to be inhibited.
Chlorophyll a, b, total and carotenoids had also quadratic responses to K fertilization (Figure 5). By performing the first derivative of the equations (Figure 5), the maximum efficiency doses were 125; 125; 147 and 128 kg ha-1 of K2O for chlorophyll a, b, total and carotenoids, respectively. These results clearly indicate a threshold value of K fertilizer that can be used without causing foliar pigment impairment in sugarcane. This amount ranges between 125 to 147 kg ha-1 of K2O as potassium source. The productivity increase also had a threshold close to this range (150 kg ha-1 K2O) corroborating that potassium fertilization as KCl should not exceed this amount.
In a study with salinity water irrigation on cowpea beans, Furtado et al. (2014) observed that the chlorophyll b levels, total and carotenoids had a quadratic response in relation to the water EC, with increase in these pigments contents until 3 dS m-1. From that value on the pigments concentration decreased.
In our study, the increase in K2O rate promoted a linear increase of the soil EC up to 1.65 dS m-1 in the superficial layer (Figure 1), and using the dose of maximum efficiency obtained in the Figure 5 (125; 125; 147 and 128 kg ha-1 of K2O for chlorophyll a, b, total and carotenoids, respectively), the threshold of soil EC for those traits by using the curve in Figure 1 are 1.35; 1.35; 1.37 and 1.38 dSm-1.
In an experiment with sorghum and three salinity levels, Kumari et al. (2016) observed that increasing in salinity promoted reduction in chlorophyll a, b, total and carotenoids. This effect was attributed to reduction in photosynthetic pigments synthesis, as well as due to the salt toxic effect that promote leaf chlorosis via stimulation of chlorophyllase.
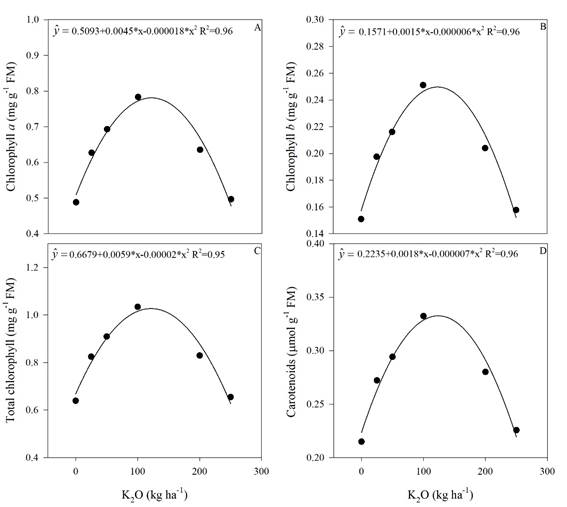
Figure 5 Concentration of chlorophyll a (A), chlorophyll b (B), total chlorophyll (C) and carotenoids (D) in sugarcane plants as a function of the potassium rates. * Significant (p<0.05), R2 determination coefficient. Means of 4 replications.
Proline has an important role in the plants osmoprotection, especially for the structures of macromolecules, such as chloroplasts (Silveira et al., 2010). In our study, a similar behavior was observed among the proline concentration (Figure 4) and the levels of chlorophyll a, b, total and carotenoid (Figure 5), thus suggesting that proline plays an important role in leaf pigments stability.
Another study observed that K deficiency promoted a decrease in chlorophyll concentration (Cavalcante et al., 2015) and, consequently, decreased the photosynthesis. In our study, there was an increase in the leaf pigments concentrations by increasing the K2O rates up to 147 kg ha-1 for total chlorophyll (Figure 4).
CONCLUSIONS
Potassium fertilization, as KCl, provided a significant increase in productivity accompanied with an increase in proline, chlorophyll a, b, total and carotenoids up to a threshold of 150, 128, 125, 125, 147 and 135 kg ha-1 K2O, respectively, and linear increase in K, S and decrease in Mg leaf levels. From these rates on, there were sharp decrease in those variables. Sugarcane productivity loss seems to be associated with soil electrical conductivity increase and the decrease in Mg leaf concentration which caused decrease in leaf pigments concentrations and, thus, impairment on biomass production. Soil electrical conductivity of 1.38 dSm-1 was associated with the threshold that promoted sugarcane productivity loss, 150 kg ha-1 of K2O, and this value should be used as a soil EC limit for sugarcane RB 992506 variety. Despite sugarcane has a high K demand, potassium fertilization should not exceed 150 kg ha-1 K2O when using KCl as a potassium source in order to avoid productivity loss caused by salinity.


