


 Inglês (pdf)
 Artigo em XML
 Referências do artigo
 Enviar este artigo por email
 Citado por SciELO
  Similares em
SciELO
Similares em
SciELO 
 Permalink
INTRODUCTION
Soil salinity is an important factor in productivity loss of agricultural soils and land degradation. The electrical conductivity of the saturated soil paste extract (EC e ) is widely used as a reference measurement for soil salinity. The soil is generally considered to be saline when EC e is above 4 dSm-1, a threshold initially defined by Richards (1954). Sensitive crops can start having growth limitations for EC e above 1.5 dSm-1, while highly tolerant plants grow well until EC e of about 12 dSm-1 (Weil & Brady, 2017). EC e is an advantageous measurement because it allows comparison among soil samples regardless of their water content under field conditions. EC e is also widely used as a reference because it is more comparable to the electrical conductivity of the soil solution (EC sw ) than the electrical conductivity measured in aqueous extracts obtained from soil-water ratios such as 1:1, 1:2, and 1:5. EC e is measured in the aqueous extract from the saturated soil paste which is also used for determination of the concentrations of dissolved salts in the soil and to determine the Sodium Adsorption Ratio (SAR) (Paz et al., 2023).
The method for obtaining the saturated soil paste has been initially published by Richards (1954), and consists of adding distilled water to a soil sample while stirring with a spatula, until obtaining a paste that 1) “glistens as it reflects light”, 2) “flows slightly when the container is tipped”, and 3) “slides freely and cleanly off the spatula for all soils but those with a high clay content”.
The protocol includes a standing time of “one hour or more” before rechecking the three criteria for saturation. After the standing time, more water can be added if the paste stiffens or loses glisten or more soil can be added if there is free water at the soil surface. The method for preparation of the saturated soil paste has been recently updated by FAO (2021), which added another standing time of 24 hours and a further checking of the saturation criteria, but without providing support data regarding the relevance of this additional standing time.
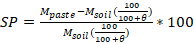
The water content of the saturated soil paste is called the saturation percentage (SP), which can be used to calculate EC sw according to the following equation, where θ is the gravimetric water content of the soil (Rhoades et al., 1989):
 [dSm] eq. (1)
This study aimed to analyse the influence of the standing time used for the preparation of the saturation soil paste in the determination of EC e, SP, and EC sw . Considering that the soil solids determine the release of ions to the soil solution, the impact of the standing time might be related to the soil’s particle size distribution (Weil & Brady, 2017; Sparks et al., 2024). As a result, the analysis was carried out by preparing the saturation soil paste in three soils with different textural classes and using three different standing times.
MATERIAL AND METHODS
Soil samples
Soil samples from three soils with different textural classes, were collected at three locations in Portugal (Alenquer, Torres Vedras, and Lezíria Grande de Vila Franca de Xira), at a depth of 0-20 cm. The particle size distribution was determined using the pipette method and the Atterberg scale and the soil organic carbon was determined using the Walkey-Black method. Table 1 shows the soil textural class according to the diagram by (Gomes & Antunes, 1962), the particle size distribution, soil organic carbon and the corresponding organic matter, using the van Bemmelen factor. The studied soils are classified as sand, loam, and silty clay and have a medium level of organic matter in the case of the sand and silty clay, and a low level of organic matter in the case of the loam.
Table 1 Characterization of the three studied soils
| Soil textural class | Coarse sand [%] (200-2000 μm) | Fine sand [%] (20-200 μm) | Silt [%] (2-20 μm) | Clay [%] (<2 μm) | Soil organic carbon [%] | Organic matter [%] |
| Sand | 66.4 | 26.6 | 3.0 | 4.0 | 1.03 | 1.8 |
| Loam | 15.7 | 38.6 | 20.4 | 25.2 | 0.61 | 1.1 |
| Silty Clay | 1.3 | 5.7 | 43.1 | 49.9 | 1.32 | 2.3 |
Preparation of the saturated soil paste
Soil samples were air-dried, ground, and homogenized through a 2 mm sieve. A mass of 300 g of air-dried fine earth was initially used for the preparation of the pastes. Three replicates were performed for each soil and treatment. Deionised water was added to the soil samples, while stirring with a spatula, until the three criteria for definition of the endpoint of the saturation paste were met. The amount of water added was decided independently for each replicate and was carried out always by the same operator. The rechecking of the criteria after the standing times may result in the addition of water or soil, as described in the introduction. When the endpoint of the saturated soil paste was reached, the mass was registered and the paste was placed in a Büchner funnel to which a negative pressure was applied, in order to collect the aqueous extract. This study carried out three treatments considering different standing times to define the endpoint of the saturated soil paste:
Treatment I - the saturated soil paste is directly placed in the Büchner funnel for extracting the extract;
Treatment II - the saturated soil paste stands for 2 hours after which the saturation criteria were rechecked and more deionised water or soil were added;
Treatment III - the saturated soil paste stands for 2 hours after which the saturation criteria were rechecked and more deionised water or soil were added, followed by an additional standing time of 24 h after which the criteria were again confirmed and again corrected, if needed.
EC e was measured in the aqueous extract of the saturation soil paste with a conductivity meter (WTW 1C20-0211 inoLab), which performs a temperature correction for obtaining the electrical conductivity to 25°C. EC e was measured simultaneously, at the same room temperature, for all the treatments within the same soil. SP was calculated considering the added water and the water already present in the air-dried soil, according to the following equation, where M soil is the mass of air-dried soil, M paste is the mass of the saturated soil paste, and θ is the gravimetric water content of the air-dried soil in %:
 [%] eq. (2)
Statistical analysis
The analysis of variance was used to study the results for the determination of EC e , SP, and EC sw . In this analysis the variance between results obtained with the three treatments was compared to the variance within each treatment (F-test). It was tested if the differences between the treatments were statically significant at different significance levels.
RESULTS AND DISCUSSION
Rechecking of the saturation criteria
In treatments II and III the saturation criteria were checked after each standing time. Table 2 shows the mass of added water or soil for each replicate. After standing times of 2 hours, there was the need to add soil in one replicate of sand and to add deionised water in all replicates of silty clay. After the standing time of 24 hours, there was the need to add deionised water in the replicates of all the soils.
Table 2 Addition of deionised water (w) [g] or soil (s) [g] after each standing time in treatments II and III
| Treatment II | After 2 h | |||||
|---|---|---|---|---|---|---|
| Rep. 1 | Rep. 2 | Rep. 3 | ||||
| Sand | 9.9 (s) | |||||
| Loam | ||||||
| Silty Clay | 10.3 (w) | 11.0 (w) | 8.9 (w) | |||
| Treatment III | After 2 h | After 24 h | ||||
| Soil | Rep. 1 | Rep. 2 | Rep. 3 | Rep. 1 | Rep. 2 | Rep. 3 |
| Sand | 10.3 (w) | 6.8 (w) | 7.4 (w) | |||
| Loam | 16.2 (w) | 20.1 (w) | 22.0 (w) | |||
| Silty clay | 15.3 (w) | 9.7 (w) | 7.8 (w) | 6.8(w) | 11.6 (w) | 11.5 (w) |
EC e and SP obtained with the different treatments
Table 3 shows the mean and standard deviation of the three replicates for each treatment and soil. Table 3 shows that even if more water was added to silty clay in Treatments II and III and to all the soils in Treatment III (Table 2), it did not necessarily lead to higher SP mean in these treatments when compared to Treatment I. This was likely because the amounts of added water were similar to the evaporation that occurred during the corresponding standing time. The addition of soil to one replicate of sand in Treatment II, did not increase the standard deviation. This can indicate that the addition of soil contributed to a good repeatability in EC e determination. Table 3 shows that there was no clear trend in either EC e or SP with increasing standing times. Furthermore, there was no consistent variation between the mean of EC e and the mean of SP, although it could be initially expected that higher SP could result in lower EC e , due to a dilution effect. Table 3 also shows that there was a decrease in the standard deviation of EC e from treatment I to III, which could indicate a higher repeatability of results in Treatments II and III. Considering SP, it was not possible to identify such trend in the standard deviation, which decreased for sand but increased for the other soils.
Table 3 Mean and standard deviation for EC e and SP for each treatment and soil
| Treatment | Sand | Loam | Silty clay | |||||||||
| EC e [dSm-1] | SP [%] | EC e [dSm-1] | SP [%] | EC e [dSm-1] | SP [%] | |||||||
| mean | StDev | mean | StDev | mean | StDev | mean | StDev | mean | StDev | mean | StDev | |
| I | 1.4 | 0.07 | 34.0 | 1.32 | 0.5 | 0.01 | 43.1 | 0.19 | 1.4 | 0.17 | 80.9 | 0.52 |
| II | 1.6 | 0.04 | 31.1 | 1.13 | 0.5 | 0.01 | 42.9 | 0.33 | 1.3 | 0.16 | 80.9 | 0.52 |
| III | 1.6 | 0.05 | 32.1 | 0.66 | 0.5 | 0.01 | 42.8 | 0.53 | 1.4 | 0.08 | 86.2 | 1.49 |
Figures 1 and 2 show the measured EC e and SP and the mean of the three replicates for each treatment and soil. For EC e , the analysis of variance showed that there were significant differences between treatments I and III (p<0.05) and highly significant differences between treatments I and II (p<0.01), in the case of the sandy soil. Considering the SP, statistically significant differences occurred between treatments I and II in the sandy soil and between treatments I and III (p<0.01) and treatments II and III (p<0.05) in the silty clay.
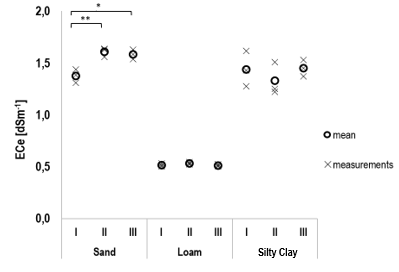
Figure 1 Measured EC e and mean for each treatment (I, II, and III) and soil (sand, loam, and silty clay). Statistically significant differences between groups are identified with * for p< 0.05 or ** for p<0.01, lower p-value means a higher statistical significance.
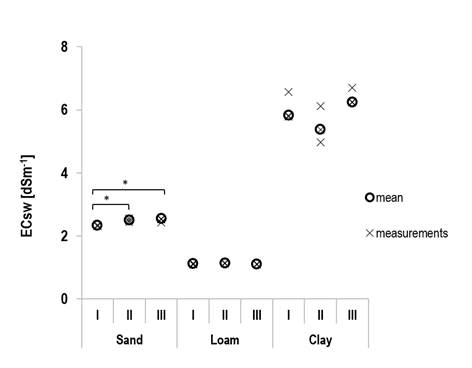
Figure 2 Measured SP and mean for each treatment (I, II, and III) and the three soils (sand, loam, and silty clay). Statistically significant differences between groups are identified with * for p< 0.05 or ** for p<0.01, lower p-value means a higher statistical significance.
Differences in the SP of the replicates can determine differences in EC e , because a higher SP might contribute to a dilution of the ions in the extract. In order to verify the significance of the results considering the influence of SP in EC e , EC sw was determined according to equation (1), assuming a hypothetical value of θ = 20%. EC sw is also an important variable as it is mostly used for modelling the water and solute transport in soils.
Figure 3 shows the calculated EC sw and the mean for each treatment and soil. The figure shows that there were significant differences between treatment I and treatment II, and between treatment I and treatment III for the sandy soil. This was also the case for of EC e (Figure 2), but the significant level between treatment I and treatment II decreased in the case of EC sw
The significant differences in ECe and EC sw in the case of sandy soil were rather surprising as it was initially expected that increased standing times could have a larger impact on the saturated soil paste of heavier textures. Although, the results could be partly explained by the relatively high EC e of the sandy soil (Table 3) and its relatively appreciable level of organic matter (Table 1).

Figure 3 EC sw calculated from measurements and mean of EC e , considering a hypothetical θ w of 20%, for each treatment (I, II, and III) and soil (sand, loam, and silty clay). Statistically significant differences between groups are identified with * for p< 0.05 or ** for p<0.01, lower p-value means a higher statistical significance.
CONCLUSIONS
Considering the determination of EC e , the results obtained with the three studied soils indicate that:
there was a highly significant difference of a standing time of 2 hours (treatment II) compared to no standing time (treatment I) in the case of the sandy soil.
there was no significant influence of an additional standing time of 24 hours (treatment III).
The standard deviation of EC e replicates decreases from Treatment I to Treatment III, which can indicate a that the standing times and rechecking of the saturation criteria, can result in higher repeatability.
Considering SP:
there were significant differences between treatments I and II for sand. In the case of silty clay there were highly significant differences and between treatments I and III and significant differences between treatments II and III.
using SP and EC e to calculate EC sw , the differences were significant between I and II between I and III, only for the sandy soil.
The results obtained with the three studied soils indicate the importance of including a standing of 2 hours in the method for obtaining of the extract from the saturated soil paste, due to highly significant differences in EC e and to significant differences in EC sw only in the case of the sandy soil. No significant differences were found from including an additional standing time of 24 hours.

