


 Inglês (pdf)
 Artigo em XML
 Referências do artigo
 Enviar este artigo por email
 Citado por SciELO
  Similares em
SciELO
Similares em
SciELO 
 Permalink
INTRODUCTION
The soil organic carbon (SOC) provides useful information about the soil quality in order to improve yield and plants development (Sharma et al., 2019), especially in highly degraded soil conditions, such as in the NE Portugal, Mediterranean area, known for its semi-arid climate, with an aridity index between 0.2 and 0.5 (Royer et al., 2021) and low carbon storage in soils, which is highly susceptible to desertification process (Figueiredo, 2013a). The exacerbated region's topography, low vegetation cover favored by inadequate agriculture practices (tillage on slope, heavy machinery and absence of sporadic plant covers) and high intensity rainfall events (Royer et al., 2021) contributes for the loss of fertile topsoil, making the remaining soil less productive and more vulnerable to further erosive events (Chen et al., 2021). In general terms, the organic C storage in the soil can positively influence the ecosystem services, either as a soil amendment, increasing the water-holding capacity and the cation exchange capacity and stabilizing the soil aggregates (Zhu et al., 2021) or as a pollution mitigation by residues (Ribeiro et al., 2021).
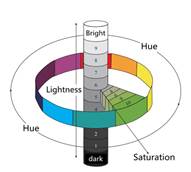
The mineral material associated to soil organic matter (SOM) is directly related to the pigments in the soil, for example, humus contributes to black colors presence, silica acid, kaolinite and calcium carbonate provide whiteness; iron hydroxides and clay contribute for the redness presence; instead, in case of reduced or anaerobic environmental conditions the color can be grey or green (Jiang et al., 2021). Traditionally, the soil color has been determined by the Munsell chart, it basically contains a set of color sheets divided in hue (red, yellow, green, blue and purple), value (lightness - 0 = black and 10 = white) and chroma (saturation), as it shows in the Figure 1. The simple use of the Munsell chart has guided to soil scientists in a common procedure, highly useful in soil taxonomy.
Based on the foregoing, the colorimetric determination of SOC acknowledges more accessible information in terms of costs saving and laboratory resources. In this case scenario, the SOC predicted from color parameter is essential for understanding the potential soil C storage (Gholizadeh et al., 2020). Thus, the current study follows the after objectives: (i) analyze SOC by routine method in different soil-type, (ii) estimate Munsell color parameters in same soil-type, and (iii) develop a consistent and reliable model prediction for SOC in a specifically soil-type: leptosol.
MATERIAL AND METHODS
Study area and field trial
The chosen soil-type was Leptosol, representative of the Trás-os-Montes region, in North East Portugal, known for its high erodibility, degraded appearances and poor SOM content (Figueiredo, 2013b). Study area included two soil-type: the first set of samples (soil-type I) is an agricultural area located in Gimonde and underwent through a precipitation essay in trays, with three different types of compost of olive pomace (OP): Compost A, B e C (Table 1) and two types of extracted OP (biomass): Ext-A e Ext-B, each of the treatments added an equivalent amount of 12 ton/ha per tray. The second set of samples (soil-type II) were collected in an olive grove crop in organic farming, located in Vila Flor, after 1 year the application of the same OP composts in site (Table 1), but with different dosages (10, 20 and 40 ton/ha), according to the Decree-Law 30/2022 limits for the olive crop production (Decreto-Lei 30/2022, April 11, 2022). However, it is worth to highlight an important factor that occurs in olive grove crop: the responsible farmers chose not to use any kind of chemical fertilizers or agricultural inputs, so their final product, the olive oil, has an international certification of organic agriculture and environment friendly production.
Table 1 Compost piles composition (m3)
| Olive pomace | Sheep manure | Almond shell | |
|---|---|---|---|
| Compost A | 8 | 2 | 16 |
| Compost B | 12 | 3 | 12 |
| Compost C | 7 | 14 | 7 |
| Compost D | 8 | 2 | 16 |
Soil sampling and sample preparation
In total, 57 soil samples were sampled, being 18 from the trays essay (Soil-type I) and 39 from the field experiment (Soil-type II); all of them were collected between 0-1cm, determined as topsoil. An aliquot of three composite samples of each treatment were sieved through a 2-mm mesh and grinded with a mortar and pestle; then weighted and dried in the stove for 24 hours in 105ºC. After that, the samples were weighted again and the moisture content was measured for further corrections in the organic C quantitative analyses.
Munsell chart color measurement
With all the samples already grinded, approximately 2g of each one was placed in white recipient with standardized ambient lighting and humidified with a standard sprayer, and then compared with the chart chips in order to read out the qualitative color (Ramos et al., 2020). Measurements were obtained by three different viewers, in different time, at the equivalent hue 10 YR; value and chroma average were recorded on wet.
Soil organic carbon
For the total SOC, the partial oxidation method on wet was applied using as oxidative agent potassium dichromate (K2Cr2O7) in acid environment (pH=1). The amount of SOC was calculated after oxidation of SOM (from Cr6+ to Cr3+) by the overmeasure of the Cr6+ in excess that has not been oxidized with Mohr’s salt (Fe(NH4)2(SO4)2 0,5M), using the diphenylamine as an indicator (Walkley & Black, 1934).
Data Analysis
Linear and “reciprocal-x” regression model were used to examine the extent to which soil color varied in response to SOC composition. In order to show differences between treatments analysis of variance (ANOVA) was performed by treatment and dosages. Whenever significant difference was identified, the verification was made by Tukey HSD mean comparation test (α=0.05).
RESULTS AND DISCUSSION
The value and chroma data observed by the Munsell chart covered the ranges 2.0 - 3.5 and 2.0 - 4.0 for soil-Type I and 3.8 - 4.2 and 3.4 - 4.3 for soil-Type II, respectively, being the soil-Type I between a very dark grayish brown and a dark yellowish brown and soil-Type II mostly inside the dark yellowish-brown range.
The SOC of both soil-types, before adding compost or biomass (control soil), already showed significant different amounts of SOC (1.11±0.33 and 2.05±0.43 g C/100g, respectively for soil-Type I and soil-Type II), as shown in Table 2. Soil-Type II, in general, have more SOC, very likely to be from the current organic farming management of the olive grove, known for being chemical-free and eco-friendly.
Table 2 Soil Organic Carbon classification according to Munsell Value observation in humid
| Soil-Type I (12 ton/ha) | Soil-Type II (10 ton/ha) | |||||
|---|---|---|---|---|---|---|
| Distric Leptossol | Leptossol | |||||
| Gimonde (41º47'28"N; 6º40'54"W) | Quinta do Prado (41º20'38"N; 7º05'36"W) | |||||
| SOC (1) | Munsell color (2) | SOC (1) | Munsell color (2) | |||
| Soil | 1.11±0.33 | 3.5/ 3 | 2.05±0.43 | 3.8 / 4 | ||
| Compost A | 1.41±0.46 | 3/ 3.5 | 3.01±0.59 | 4.2 / 3.7 | ||
| Compost B | 2.27±0.47 | 3/ 3.5 | 2.73±0.23 | 4 / 3.7 | ||
| Compost C | 1.93±0.28 | 3/ 4 | 2.63±0.35 | 4.3 / 4 | ||
| Compost D | - | - | 3.50±0.22 | 3.8 / 3.4 | ||
| Olive pomace extract A | 2.56±0.35 | 2/ 2 | - | - | ||
| Olive pomace extract B | 3.09±0.33 | 2/ 3 | - | - | ||
| Number of samples | 18 | 39 | ||||
*1) g of C/ 100g of soil (2) Hue 10 YR in humid
Particularly, for soil Type I, there is a statistically significant difference in SOC between the control soil and all other treatments (compost and biomass). Among the three composts, compost B exhibits the highest incorporation of C in the soil (2.27±0.47 g C/100g) without any statistically significant difference from the others. Ext-A is shown to be statistically different from Ext-B (Figure 2(a)), with Ext-B having the highest amounts of SOC (3.09±0.33 g C/100g).
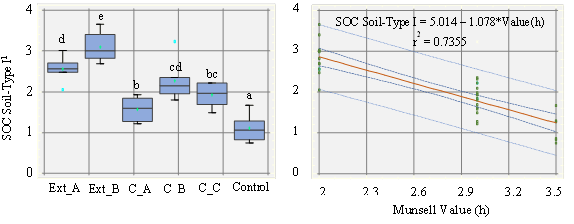

Figure 2 Soil-Type I Organic Carbon potentially explained by (a) treatment and (b) predicted wet value Ext_A: extract A; Ext_B: extract B; C_A: Compost A; C_B: Compost B; C_C: Compost C (a) lowercase letter inside of the plot indicate statistical difference between each treatment/ dosage verified by Tukey HSD mean comparison test ((=0.05) (b) p-value ANOVA < 0.01 at 99% confidence level 1 (g of C/100g of soil)
Figure 2 (b) shows how the extent Munsell observed color attribute can be related to SOC on soil-Type I. There is moderately strong linear regression model that indicates the relationship for lightness (Munsell value in humid) which allow predicting SOC in 73.55%. Once again, the chroma observed did not presented a linear relation to be analyzed or even predicted.
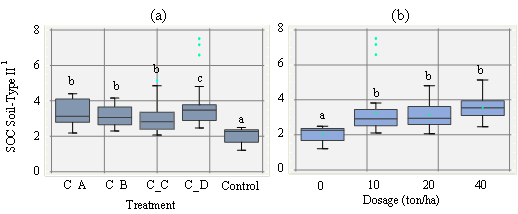
For soil Type II, specifically, the control soil also exhibited a lower predicted amount of SOC, showing a significant difference from all the other treatments. Although, Compost D had higher amounts of SOC compared to the other treatments, with significant difference. However, the others composts did not have statistical difference between each other (Figure 3 (a)). Nonetheless, dosages comparation, showed control soil with lower SOC with statistical difference with all the others treatments, while the dosages 10, 20 and 40 ton/ha did not show any significant difference. Kantikowati et al. (2019) used manure compost and also found out the dosage 10 ton/ha to be the most effective in productivity to be used compared to 15 ton/ha. By the other hand, Yaşasın et al. (2022) conducted a study in a grapevine crop soil with poor organic matter content (< 1%) in Turkey, and when compared the applied dosages of OP compost (10, 20 and 40 ton/ha) also found no statistically significant differences in crop yield within 3 years experiment. This fact suggests that the dosage of 10 ton/ha is already enough for increase the C in the soil, which represents lower resources expenses for accommodating this SOM in the same area, enlarging thus the amount area covered for crop production and exploring all the worthy benefits of revalorizing the organic residues for compost and its application.

Figure 3 Soil-Type II Organic Carbon potentially explained by (a) treatment and (b) per dosage C_A: Compost A; C_B: Compost B; C_C: Compost C lowercase letter inside of the plot indicate statistical difference between each treatment/ dosage verified by Tukey HSD mean comparison test ((=0.05) 1 (g of C/100g of soil)
The SOC-predicted values, in relation to the observed Munsell color, showed a negative moderately strong relationship between the variables when the regression model "reciprocal-x" was applied. This relationship yielded a potential prediction of 57.14% for SOC (Figure 4).
CONCLUSION
The results provide support for the potential of utilizing the Munsell chart to gather dependable soil color information. Furthermore, it demonstrates that a standard equation for leptosol can facilitate the compilation of usable data, thereby addressing certain challenges associated with time and resource constraints. SOC predictions from color could provide a detailed evaluation of SOC over time and space, which is key to enhance the understanding of SOC changes when external inputs are used, such as composts, improving the landscapes and implementing effective management strategies for soil C storage and optimize some of the environmental related issues, controlling erosion in mountain regions, for example and revalorizing the organic waste within society.
For further research, it is suitable to include a spectroscopy correction for more precise correlation, as well as nonparametric statistical approach.

