INTRODUCTION
Since the declaration of the Coronavirus Disease 2019 (COVID‑19) pandemic in March 2020, countries world‑wide have registered a large number of cases in different waves that have brought their health‑care systems to the limit of saturation.
Several factors such as advanced age, obesity, diabetes mellitus, hypertension, and cardiovascular pathology have been associated with the disease severity in the general population. Against this backdrop, solid organ transplant patients are a major risk group, given the high prevalence of these factors in addition to their chronic immunosuppressive state1,2. The mortality rates among kidney transplant patients vary in different reports, but are high especially in the elderly and in the early post‑transplant period3,4. A report of the Spanish Registry shows differences in overall mortality between the first (March‑June) and second (July‑December) wave (27.4% vs 15.1%) but similar rates in critical patients..
The aim of this study is to analyze the risk factors for hospitalization and the predictors of worse clinical outcome on admission in our kidney transplant patients affected by COVID‑19 during the pandemic thus far.
SUBJECTS AND METHODS
Study design and participants
This was a retrospective cohort study that included kidney transplant recipients with COVID‑19 treated at the transplant unit of La Fe Hospital in Valencia. We included all adult kidney transplant recipients with a functioning allograft who tested positive for SARS‑CoV‑2 between March 16th 2020 and February 11th 2021. Patients were classified into several groups for analysis: a first division based on the need for patient hospitalization and a second division among hospitalized patients regarding their evolution and the development of severe pneumonia.
Data collection
Demographic, clinical, laboratory, and comorbidity data were extracted retrospectively from electronic medical records at our center. A total of 17 patients were hospitalized in other centers, and their information was collected by phone or their hospital records were accessed electronically, when possible. Clinical and laboratory information of two patients could not be collected. SARS‑CoV‑2 diagnosis was based on the polymerase chain reaction (PCR) test from the nasopharyngeal swab.
Statistical analysis
Categorical variables were summarized with counts and percentages, while quantitative variables included minimum‑maximum, means (standard deviation) and medians with Interquartile Range (IQR), where appropriate. Due to our small sample size and in order to avoid overfitting, variable selection via Lasso regularization was applied. After multicollinearity and potential outliers had been checked, the penalty factor (lambda) that produces the lowest possible mean squared error in our data was calculated through cross‑validation. Lambda at 1 standard error of the minimum was chosen, giving a simpler and parsimonious model. Selected variables were then included in a multivariate logistic regression model and interpreted in terms of odds ratio (OR) and 95% confidence intervals. A P‑value of <.05 was considered significant. Model fit was checked through residual diagnostics. Analyses were performed using R Statistical Software (version 4.0.4).
RESULTS
Demographic and clinical characteristics
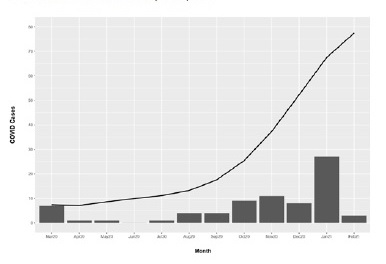
Since the pandemic outbreak in March 2020 to February 11th 2021, 76 kidney transplant recipients were diagnosed with COVID‑19 (Figure 1). Out of 76 infected patients, 49 (64.5%) were male while 27 (35.5%) were female, between 24 and 81 years of age, with mean 57.5 and standard deviation 13.9. Regarding blood type, the most common among patients were type A and O (n=31 [40.8%] and n=27 [35.5%], respectively) followed by type B (n=10 [13.2%]) and AB (n=3 [3.9%]). Remaining cases (n=5 [6.6%]) were not available.
Causes of kidney disease included glomerular disease (n=22 [28.9%]), (Autosomal Dominant Polycystic Kidney Disease (ADPKD) (n=13 [17.1%]), hypertension (n=11 [14.4%]), interstitial (n=10 [13.2%]), unknown (n=10 [13.2%]) and other causes (n=10 [13.2%]).
Hypertension was the most common comorbidity affecting n=63 [82.9%] of patients, followed by overweight/obesity (n=36 [47.4%]), diabetes (n=29 [38.1%]) and cardiovascular disease (n=22 [28.9%]). Time to diagnosis of COVID‑19 after transplantation ranged from 4 months to 396 (33 years) with median 90 and IQR (40.3‑162), while the vast majority of patients (n=51 [67.1%]) were diagnosed during the first decade after transplantation. Maintenance immunosuppression therapy followed a standard guideline, including steroids, tacrolimus and antimetabolite (mycophenolate mofetil or mycophenolic acid) for most of the patients (n=72 [94.7%]), with those treated with mTOR inhibitor (n=4 [5.3%]) and Cyclosporine (n=2 [2.6%]) being a minority.
The almost absence of difference regarding immunosuppressive regímen led to the exclusion of this variable in the statistical analysis.
Clinical outcome and Laboratory results
The most common symptoms were fever (n=45 [59.2%]), cough (n=36 [47.4%]), dyspnea (n=17 [22.4%]), asthenia (n=15 [19.7%]), myalgia (n=13 [17.1%]) and gastrointestinal symptoms (n=13 [17.1%]. A total of 38 patients (50%) developed pneumonia; 12 (15.8%) remained asymptomatic and 48 (63.2%) were hospitalized. Table I shows baseline characteristics of the patients in terms of hospitalization.
Table I Patients’ demographic and clinical characteristics
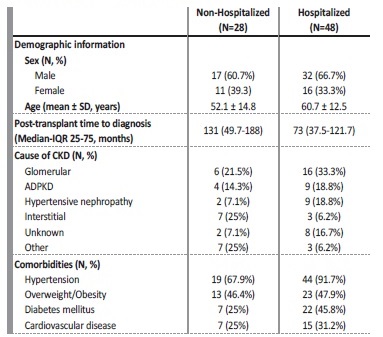
SD - Standard Deviation; IQR - Interquartile Range; CKD - Chronic Kidney Disease; ADPKD - Autosomal Dominant Polycystic Kidney Disease.
Of the 48 hospitalized patients, laboratory and clinical information during admission could not be obtained for two. Henceforth, data will refer to the 46 remaining subjects. Time from COVID‑19 diagnosis to hospitalization ranged from zero (being diagnosed the same day of admission) to 26 days. The patients’ main symptoms at the moment of hospitalization were cough (n=30 [65.2%]) and fever (n=29 [63%]), followed by dyspnea (n=15 [32.6%]) and asthenia (n=13 [28.3%]). A total of 19 patients (41.3%) needed oxygen support on admission, while 13 of them (28.3%) had an oxygen saturation (SpO2) rate ≤92%. The differentiating cut‑off point of a low oxygen saturation at ≤92% is based on Severinghaus equations, where the author establishes a relationship between SpO2 saturation and pO2, mmHg6. We consider hypoxia as the decrease of pO2 below 60 mmHg, which corresponds to a SpO2 saturation of 90.7%. Thus, to be above that limit and as a cut‑off point to initiate supplemental oxygen therapy, the limit of SpO2 ≤92% was established. Concerning patient evolution, 21 (45.7%) developed severe pneumonia, while the remaining 25 (54.3%) had a better evolution (including from mild to moderate pneumonia, or a mild to moderate clinical manifestation without respiratory symptoms). Hospitalization time ranged from one day to 93, with a considerable percentage (60.9%) being hospitalized for a period of less than two weeks.
Regarding laboratory measures on admission, interest focused on creatinine (mg/dL), C‑reactive protein (CRP) (mg/L), lymphocyte (x103/μL), leucocyte (x103/μL) and D‑dimer (ng/mL). Thus, creatinine levels in the total amount of hospitalized patients showed a median of 1.6mg/dL and IQR (1.2‑2.5 mg/dL), while leucocyte presented a median of 5.9 x10³/μL and IQR (4.5‑7x10³/μL). 63% of the patients had lymphopenia (< 1x10³/μL), with the median for all patients being 0.8 x10³/ μL and IQR (0.5‑1.2 x10³/μL). Median and IQR for CRP and D‑dimer were 55.5 mg/L (19.4‑91.1mg/L) and 600 ng/mL (383‑838.2ng/mL), respectively. Table II shows baseline, clinical, and laboratory characteristics between both groups.
Table II Demographic characteristics, clinical manifestation, and laboratory results according to COVID‑19 disease evolution
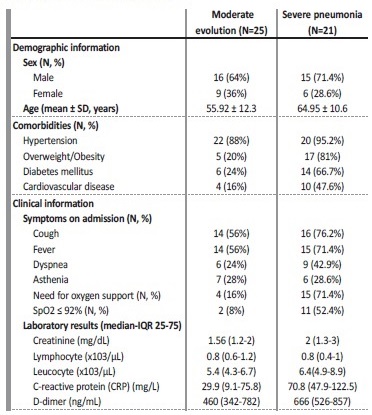
SD - Standard Deviation; SpO2 - blood oxygen saturation levels.
A small percentage of recipients experienced acute renal failure during hospitalization (n=8 [17.4%], three of whom required hemodialysis. None of the patients experienced acute rejection or allograft loss. Eleven patients (23.9%) met the criteria for admission to the intensive care unit (ICU), and seven died.
Treatment of COVID‑19, immunosuppression adjustment and oxygen therapy
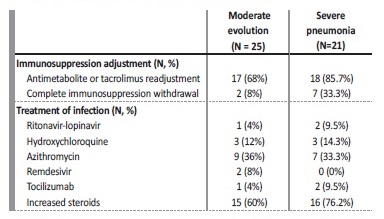
Treatment changed between the waves with more frequent use of ritonavir/lopinavir (n=3 [6.5%]), hydroxychloroquine (n=6 [13%]), and azithromycin (n=16 [34.8%]) in the first wave, and with more frequent use of remdesivir (n=2 [4.3%]) and steroids (n=31 [67.4%]) in the second. The patients experiencing cytokine storm received tocilizumab in the initial stages but not in the next waves (n=3 [6.5%]).
High steroid doses were used as treatment for pneumonia and hyper‑inflammatory state. Regarding immunosuppression adjustment, tacrolimus and antimetabolite were reduced or discontinued in most cases (n=35 (76.1%), with complete withdrawal of the immunosuppressive treatment in 9 patients (19.6%). Asymptomatic patients did not receive specific drugs against COVID‑19 and did not require immunosuppression adjustment. In patients with pneumonia, the reduction of immunosuppressive treatment was made according to the published recommendations of the DESCARTES Group7. Treatment and immunosuppression adjustment differences in line with patients’ severity are included in Table III.
Ventilatory support via nasal cannula with reservoir was provided to patients whose SpO2 rate ≤92%, aiming at a SpO2 rate towards 96%. If this was insufficient, a high‑flow nasal cannula or Venturi mask was provided. Non‑invasive mechanical ventilation was the next step in order to consider when respiratory failure continued, unless immediate intubation criteria existed. Thus, a total of 22 patients (47.8%) needed oxygen support throughout the hospitalization period. Conventional oxygen therapy was the most common (n=17 [77.3]), using a high and low‑flow nasal cannula (n=6 [27.3%] and n=7 [31.8%], respectively) and Venturi mask (n=4 [18.2%]). Five patients (22.7%) required intubation, all of whom had presented a SpO2 rate ≤92% at admission.
Risk factors associated with hospitalization and COVID‑19 evolution
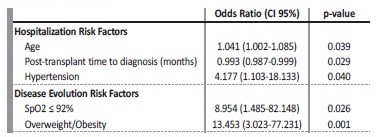
Variables included in Table I, except chronic kidney disease (CKD) cause, were considered as potential hospitalization predictors and therefore included in Lasso. After a parsimonious model with three variables was selected by L1 regularization, multivariate logistic analysis revealed that age and hypertension were predictors for hospitalization, while time after transplant was related with a lower need for hospital assistance (Table IV).
Table IV Multivariate logistic regression analysis of the parameters related to hospitalization and COVID‑ 19 evolution
SpO2 - blood oxygen saturation levels.
Regarding COVID‑19 evolution in hospitalized patients, summarized variables in Table II and Table III were included in Lasso as possible indicators, excluding symptoms on admission (as they are beyond the scope of this study) and need for oxygen support (due to its strong correlation with SpO2 ≤ 92%). After SpO2 ≤ 92% and overweight/ obesity were selected, multivariate logistic regression analysis revealed that both variables are associated with a worse evolution among hospitalized patients (Table IV).
DISCUSSION
This is a retrospective cohort study that reflects the experience of a single center faced with the impact of COVID 19 disease on its kidney transplant patients. Considering our 1500 functioning allografts and 76 infected patients, this equals an incidence of 5%, similar to the global incidence of 4.8% reported by the Spanish Society of Nephrology (S.E.N.)8 and to the 6.1% reported in the general population9. None of these patients had received a COVID‑19 vaccine at the time of the study, since the vaccination rollout in our recipients was initiated in April 2021.
As shown in Figure 1, the first peak was reached at the end of March, beginning with the first wave that lasted until May, and a total of 9 cases was reported. From then, incidence stayed low until the start of the second wave at the end of summer, reaching the highest number of cases in November. Despite the fact that a larger number of cases was recorded during the second wave (n=29), these cases were distributed fairly equally between months, mostly due to the severe restrictions that were kept in place in Spain, which resulted in greater control of the pandemic during that wave. However, at the beginning of December and coinciding with a national holiday as well as the advent of Christmas with less severe restrictions, a third and more virulent wave emerged, which reached its peak in January. Thirty‑eight cases were reported during that time.
The need for hospitalization in our study was 63.2% of all affected patients. The mortality rate was 14.5% a lower percentage than in other published series, which is above 25%10,11. Only 12 (15.8%) diagnosed patients remained asymptomatic. In the overall series, symptoms such as fever, cough and dyspnea are the most common at presentation and hospital admission percentages are similar in other published reports11,12.
In our analysis, older age and hypertension were the main risk factors for hospitalization among positive COVID‑19 patients, while the probability of being hospitalized decreased with time after transplantation. It should be highlighted that about 67.1% of our patients were at least ten years after their transplant. Advanced age and COVID‑19 infection in the first months were associated with severe disease and high mortality in previous series13,14. We also analyzed in our hospitalized patients which factors on admission could be related to a worse evolution and severe pneumonia.
Among them, only SpO2 ≤92% on admission (OR 8.954, p=0.026) and overweight/obesity (OR 13.453, p=0.001) were predictors of a worse evolution. These observations are similar to the published results from registry series5,15. The relationship with low oxygen rates and poor outcomes has also been described in several studies16,17.
This retrospective cohort study has some limitations. First, the sample size is small, lowering the study power which may lead to false‑positives and overestimated effect sizes. Further, the limited sample size does not allow the division into a train and test set to check the model performance, which would have strengthened the results. However, this should not be a limitation in order to provide useful data which may help focus on high‑risk patients.
On the other hand, this single‑center experience provides the advantage of a follow‑up and homogeneous treatment criteria.


