Introduction
Over the past decade, screen use by adolescents has increased and become a central part of their lives.1 Digital media can be beneficial in many ways, helping to build relationships and access information, but excessive screen time has been linked to poor sleep and a more sedentary lifestyle.2-7 Currently, the American Academy of Pediatrics recommends creating a family plan that allows for screen time while ensuring adequate sleep, physical activity, and media-free activities.8
The relationship between sleep and health has been well established over the years, including its importance for brain development.7,9 Insufficient sleep in adolescents has been associated with impaired cognition, emotional problems, peer conflict, risky behaviors, and obesity.5,9-11 The physiologic delayed sleep phase characteristic of this age group, combined with poor sleep hygiene, has a major impact on sleep quality and quantity.9 Studies suggest that digital media may negatively affect sleep through many mechanisms, including exposure to bright and blue light.1,2,12,13 Studies in children have shown an impact of screen time on both sleep quality and quantity, with a negative correlation between screen time before bedtime and sleep duration.12,14 In adolescents, increased screen time on all devices (television, computer, electronic games, and mobile phones) is associated with shorter sleep duration.14 Increased screen time may also correlate with poorer self-reported sleep quality and daytime sleepiness.15 In addition, the presence of media devices in the bedroom and their use before bedtime (especially in the preceding hour) affects adolescents’ sleep by delaying bedtime and shortening sleep duration.13-18 Between 75% and 97% of adolescents have at least one electronic device in the bedroom, and 80-90% use it in the last hour before bedtime.13,14,16-18
During the COVID-19 pandemic, many countries implemented quarantine and lockdown measures that affected daily habits, including screen time and sleep quality.7,19 A systematic review and meta-analysis showed that the estimated prevalence of sleep problems across populations during the pandemic was 37%.19,20 A survey conducted in Singapore in children and adolescents aged 3 to 16 years showed an increase in sleep duration and non-academic screen use during this period.5 Parents reported that the main factors affecting their children’s sleep were the lack of school commuting and increased internet time.5 Conversely, a Tunisian study found poorer sleep quality during the pandemic, but no significant change in sleep duration.21 This study also found a 150% increase in daytime exposure and a 93% increase in nighttime exposure to digital devices.21 These data suggest an association between increased screen time associated with COVID-19-related lifestyle changes and poorer sleep. However, other unknown factors may contribute to these findings, and further studies are needed to confirm this association.19
Portugal had lockdowns from March to May 2020 and January to April 2021. Schools were closed and mandatory online learning took place. The implementation of distance learning appears to have increased screen time during this period, which may have negatively affected sleep quality and quantity. In addition, home confinement may have also increased non-academic screen use, particularly for communicating with friends and family.
This study aimed to characterize adolescents’ sleep and screen use behaviors during the COVID-19 pandemic lockdown. It also sought to evaluate differences in subjective sleep quality, sleep duration, presence of onset insomnia, and EDS between the following groups: screen time ≥6 hours/day vs. <6 hours /day; screen use within one hour before bedtime ≥4 times/week vs. < 4 times/week; presence vs. absence of electronic devices in the bedroom.
Material and methods
Study design: Multicenter, cross-sectional, descriptive study.
Sample: The study sample included all adolescents aged 10 to 18 years who attended an Adolescent Medicine outpatient visit at one of four hospitals in northern Portugal between January 25 and March 25, 2021 (corresponding to the second lockdown). Patients who were unable to complete the survey independently were excluded.
Survey methods: Questionnaires were preferably delivered and completed during the medical visit. If this was not possible, they were sent by e-mail and completed online by the participant. All study participants and legal guardians provided informed consent to participate in the study.
Study variables: The survey included the following sections:
Sociodemographic data: age, gender, parents’ age, number of siblings, household members, grade and field of study, school success (i.e., school retention or negative evaluation in the last semester), and extracurricular activities;
Health status: presence of medical conditions and current medications;
Data on sleep in the previous month: sleep habits, sleep environment, bedtime and wake time on weekends and weekdays, time taken to fall asleep, self-reported sleep quality, changes during the pandemic, and the Portuguese version of the Pediatric Daytime Sleepiness Scale.22 Questions about sleep habits were converted to a 5-point Likert scale (1-5) for easier interpretation, with 1 representing “never” and 5 “always.” The Pediatric Daytime Sleepiness Scale includes eight questions sc“red o” a 5-point Likert scale (0-4), with EDS defined as a total score of 20 or greater. The time at which the adolescents fell asleep was calculated by adding the time it t“ok to”fall as“eep to ”he reported bedtime. Sleep duration was calculated as the difference between the time the adolescents fell asleep and the time they woke up. Subjective sleep quality was assessed using a 4-point Likert scale, with 0 representing “very poor” and 3 “very good”. Onset insomnia was defined as taking more than 30 minutes to fall asleep more than three times per week;
Data on screen use in the previous month: screens available at home/in bedroom, screen use at bedtime, and daily screen use habits - e.g., average hours of screen time per day (total and by activity - online classes, homework, talking to friends, watching videos, playing games, family time), getting up early to use a device, screen use during meals.
The study was approved by the ethics committees of the participating hospitals.
Statistical analysis: Categorical variables were presented as frequencies and percentages, and continuous variables as means and standard deviations [SD] or medians and interquartile ranges [IQR] for variables with skewed distributions. Categorical variables were compared using Fisher’s exact test or chi-squared test, as appropriate, and continuous variables were compared using the Mann-Whitney test for independent samples with non-normal distribution. All reported p-values were two-tailed, with a p-value of 0.05 indicating statistical significance. Analyses were performed using the Statistical Package for the Social Sciences (SPSS) software version 27.0.
Results
The study included 131 adolescents who completed the survey, mostly female (66.4%), with a median age of 15 years (minimum 10 and maximum 19 years). The sociodemographic characteristics and health status of the study population are described in Tables 1and2, respectively.
Table 1 Sociodemographic characteristics of the study population
| Characteristic | Value | |
| Gender, female/male - n (%) n=131 | 87 (66.4) / 44 (33.6) | |
| Age (years) - median (IQR) n=131 | 15 (13-16) | |
| Mother's age (years) - mean (SD) Father's age (years) - mean (SD) n=102 | 44.2 (5.7) 45.9 (6.2) | |
| How many siblings do you have? - n (%) n=131 | 0 | 28 (21.4) |
| 1 | 72 (55.0) | |
| 2 | 20 (15.3) | |
| 3 or more | 11 (8.3) | |
| Who do you live with most days? - n (%) n=131 | Mother and father | 75 (57.3) |
| Siblings | 70 (53.4) | |
| Mother or father | 53 (40.5) | |
| Grandparents | 28 (21.4) | |
| Other | 11 (8.4) | |
| What is your school grade? - n (%) n=130 | 1st cycle basic education | 3 (2.3) |
| 2nd cycle basic education | 18 (13.8) | |
| 3rd cycle basic education | 47 (36.2) | |
| Secondary education | 62 (47.7) | |
| Have you ever repeated a school grade?, yes - n (%) n=131 | 20 (15.3) | |
| Did you fail any classes last semester?, yes - n (%) n=131 | 44 (33.6) | |
| Did you stop any extracurricular activities because of the pandemic?, yes - n (%) n=131 | 71 (54.2) | |
IQR - interquartile range; SD - standard deviation
Table 2 Health status of the study population
| Variable | Value | |
|---|---|---|
| Do you have a medical condition?, yes - n (%) n=131 | 39 (29.8%) | |
| If you have a medical condition, what is it? - n (%) n=39 | Asthma/rhinitis/”allergies” | 19 (48.7) |
| Attention deficit hyperactivity disorder | 6 (15.4) | |
| Depression/anxiety | 3 (7.7) | |
| Anemia | 2 (5.1) | |
| Autism spectrum disorder | 1 (2.6) | |
| Others | 19 (48.7) | |
| Do you have a sleep disorder?, yes - n (%) n=131 | 15 (11.5) | |
| If you have a sleep disorder, what is it? - n (%) n=15 | Insomnia | 12 (80.0) |
| Frequent nightmares | 5 (33.3) | |
| Somnambulism | 1 (6.7) | |
| Restless leg syndrome | 1 (6.7) | |
| Other | 1 (6.7) | |
| Are you taking any medication?, yes - n (%) n=131 | 54 (41.2) | |
| If you are taking any medication, what is it? - n (%) n=54 | Allergy/inhaler | 29 (53.7) |
| Psychoactive drug | 24 (44.4) | |
| Unspecified "stress" drugs | 9 (16.7) | |
| Melatonin | 2 (3.7) | |
| Other | 15 (27.8) | |
Regarding sleeping-conditions, the majority (80.9%) reported having a bedroom to themselves. Of those who shared a bedroom, most (87.5%) shared it with a sibling, and about half (56.0%) did not share a bed. About two-thirds of respondents (67.2%) said they felt they got enough sleep in the past month, and a similar proportion (64.1%) said their sleep quality did not decrease during the pandemic. In terms of sleep quality, 19.8% of adolescents rated their sleep as very good, 60.3% as good, 17.6% as poor, and 2.3% as very poor.
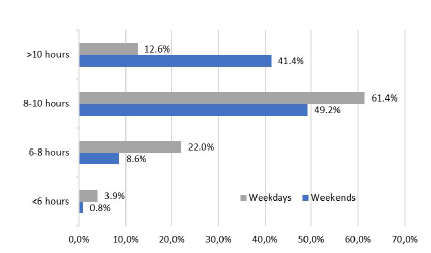
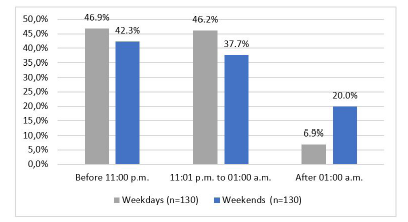
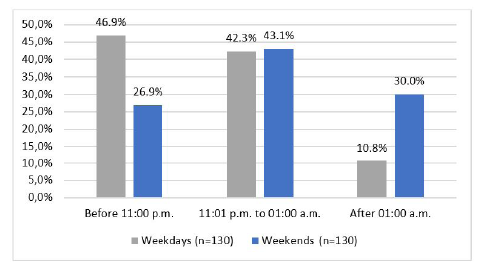
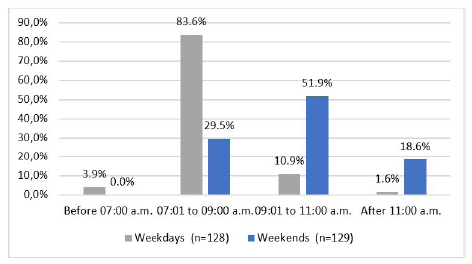
When asked how much sleep they thought they needed to feel good during the day, the most common answer among adolescents was eight hours (minimum four and maximum 13). Regarding the amount of sleep, the median sleep duration was nine hours on weekdays (minimum three and maximum 11.5) and 10 hours on weekends (minimum 4.5 and maximum 15.5). Sleep duration below the recommended minimum of eight hours was found in 25.9% of participants on weekdays (vs. 9.4% on weekends), while total sleep duration of more than 10 hours was found in 41.4% on weekends (vs. 12.6% on weekdays). Figure 1 shows the amount of sleep for both weekdays and weekends. In terms of sleep timing, the mean time adolescents fell asleep was 11:30 p.m. (SD 1.5) on weekdays and 00:22 a.m. (SD 1.7) on weekends. As shown in Figures 2,3, and4, 53.1% fell asleep after 11:00 p.m. on weekdays (n=130), whereas this number increased to 73.1% on weekends (n=130). A difference was also found in the time the adolescents woke up, with 1.6% waking up after 11:00 a.m. on weekdays (n=128) and 18.6% doing the same on weekends (n=129).
Onset insomnia was present in 39.7% of the study population. Approximately one quarter (26.7%) reported nightmares at least twice per week, eleven patients (8.4%) reported episodes of sleepwalking, and 6.9% reported snoring two to three times per week and 10.7% more than three times per week. Excessive daytime sleepiness (EDS) was reported by 13.7% of respondents.
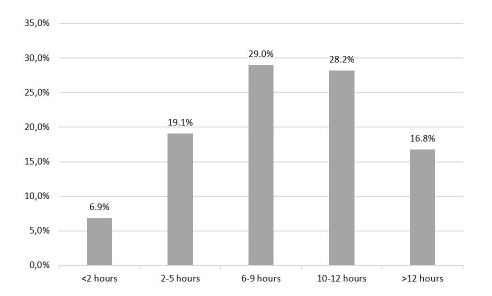
When asked about daily screen time, 74.0% of adolescents reported six hours or more, and 16.8% reported more than 12 hours (Figure 5). Screens were used for multiple daily activities, most commonly for attending classes (Table 3). Screens available in the bedroom at night included the smartphone for 83.2%, television for 61.1%, computer for 57.3%, and game console for 16.0% of adolescents. When asked if they watched screens in the hour before bedtime, 55.0% said it was a daily habit. The rest of the respondents were divided as follows: 22.9% used screens 4-6 times per week, 14.5% 2-3 times per week, 5.3% once per week, and 2.3% never used screens in the hour before bedtime.
Table 3 Screen use by activity
| Attending classes | School work | Talking to friends | Watching videos | Gaming | Family time | |
| <2 hours | 1.5% | 48.1% | 39.7% | 58.8% | 61.1% | 48.1% |
| 2-5 hours | 43.5% | 36.6% | 21.4% | 22.9% | 22.9% | 28.2% |
| 6-9 hours | 42.0% | 10.7% | 29.8% | 11.5% | 9.9% | 14.5% |
| 10-12 hours | 6.9% | 2.3% | 3.1% | 5.3% | 3.8% | 3.1% |
| >12 hours | 6.1% | 2.3% | 6.1% | 1.5% | 2.3% | 6.1% |
When comparing adolescents with at least six hours of screen time per day and those with less than six hours, the former were more likely to have shorter sleep duration on weekdays (p=0.038) and EDS (p=0.041). Similar data were found when comparing adolescents who used screens in the hour before sleeping at least four times per week and those who used screens in the hour before sleeping less than four times per week, with the former more likely to have onset insomnia (p=0.018), shorter weekday sleep duration (p=0.038), and EDS (p=0.012). Adolescents who reported having a computer or smartphone in the bedroom at night also reported shorter sleep duration during the week (p=0.040 and p=0.006, respectively). The results of the univariate analysis are shown in Table 4.
Table 4 Univariate analysis
| Screen use ≥6 h/day | Screen use <6 h/day | Test and p-value | |
| Sleep quality - n (%) Good or very good Poor or very poor | 76 (78.4) 21 (21.6) | 29 (85.3) 5 (14.7) | Χ2 (1, n = 131) = 0.763 p=0.382* |
| Sleep duration on weekdays Mean (SD) | 8.5 (1.6) | 9.1 (1.3) | U=1201.000 p=0.038 § |
| Sleep duration on weekends Mean (SD) | 9.7 (1.5) | 10.2 (1.6) | U=1279.000 p=0.083§ |
| Onset insomnia - n (%) Present Absent | 41 (42.3) 56 (57.7) | 11 (32.4) 23 (67.6) | Χ2 (1, n = 131) = 1.034 p=0.309* |
| EDS - n (%) Present Absent | 17 (17.5) 80 (82.5) | 1 (2.9) 33 (97.1) | p=0.041# |
| Screen use within one hour before bedtime ≥4 times/week | Screen use within one hour before bedtime <4 times/week | Test and p-value | |
| Sleep quality - n (%) Good or very good Poor or very poor | 80 (78.4) 22 (21.6) | 25 (86.2) 4 (13.8) | Χ2 (1, n = 131) = 0.858 p=0.354* |
| Sleep duration on weekdays Mean (SD) | 8.5 (1.6) | 9.2 (1.2) | U=999.500 p=0.038 § |
| Sleep duration on weekends Mean (SD) | 9.7 (1.7) | 10.3 (1.0) | U=1050.500 p=0.066§ |
| Onset insomnia - n (%) Present Absent | 46 (45.1) 56 (54.9) | 6 (20.7) 23 (79.3) | Χ2 (1, n = 131) = 5.620 p=0.018* |
| EDS - n (%) Present Absent | 18 (17.6) 84 (82.4) | 0 (0) 29 (100) | p=0.012# |
| Smartphone in the bedroom | No smartphone in the bedroom | Test and p-value | |
| Sleep quality - n (%) Good or very good Poor or very poor | 87 (79.8) 22 (20.2) | 18 (81.8) 4 (18.2) | p=1.000# |
| Sleep duration on weekdays Mean (SD) | 8.5 (1.6) | 9.4 (0.9) | U=725.000 p=0.006 § |
| Sleep duration on weekends Mean (SD) | 9.7 (1.6) | 10.4 (0.9) | U=859.500 p=0.066§ |
| Onset insomnia - n (%) Present Absent | 45 (41.3) 64 (58.7) | 7 (31.8) 15 (68.2) | Χ2 (1, n = 131) = 0.685 p=0.408* |
| EDS - n (%) Present Absent | 18 (16.5) 91 (83.5) | 0 (0.0) 22 (100.0) | p=0.042 # |
| TV in the bedroom | No TV in the bedroom | Test and p-value | |
| Sleep quality - n (%) Good or very good Poor or very poor | 63 (78.8) 17 (21.2) | 42 (82.4) 9 (17.6) | Χ2 (1, n = 131) = 0.254 p=0.614* |
| Sleep duration on weekdays Mean (SD) | 8.5 (1.7) | 8.9 (1.3) | U=1674.500 p=0.215§ |
| Sleep duration on weekends Mean (SD) | 9.8 (1.8) | 9.7 (1.2) | U=2052.500 p=0.614§ |
| Onset insomnia - n (%) Present Absent | 35 (43.8) 45 (56.2) | 17 (33.3) 34 (66.7) | Χ2 (1, n = 131) = 1.412 p=0.235* |
| EDS - n (%) Present Absent | 11 (13.8) 69 (86.2) | 7 (13.7) 44 (86.3) | Χ2 (1, n = 131) = 0.000 p=0.997* |
| Computer in the bedroom | No computer in the bedroom | Test and p-value | |
| Sleep quality - n (%) Good or very good Poor or very poor | 60 (80.0) 15 (20.0) | 45 (80.4) 11 (19.6) | Χ2 (1, n = 131) = 0.003 p=0.960* |
| Sleep duration on weekdays Mean (SD) | 8.4 (1.6) | 9.0 (1.5) | U=1559.000 p=0.040 § |
| Sleep duration on weekends Mean (SD) | 9.9 (1.4) | 9.8 (1.7) | U=1946.000 p=0.868§ |
| Onset insomnia - n (%) Present Ausent | 27 (36.0) 48 (64.0) | 25 (44.6) 31 (55.4) | Χ2 (1, n = 131) = 1.000 p=0.317* |
| EDS - n (%) With EDS Without EDS | 11 (14.7) 64 (85.3) | 7 (12.5) 49 (87.5) | Χ2 (1, n = 131) = 0.127 p=0.722* |
| Gaming console in the bedroom | No gaming console in the bedroom | Test and p-value | |
| Sleep quality - n (%) Good or very good Poor or very poor | 17 (81.0) 4 (19.0) | 88 (80.0) 22 (20.0) | p=1.000# |
| Sleep duration on weekdays Mean (SD) | 8.5 (2.2) | 8.7 (1.4) | U=1064.500 p=0.971§ |
| Sleep duration on weekends Mean (SD) | 9.9 (1.8) | 9.8 (1.5) | U=1147.000 p=0.658§ |
| Onset insomnia - n (%) Present Ausent | 9 (42.9) 12 (57.1) | 43 (39.1) 67 (60.9) | Χ2 (1, n = 131) = 0.104 p=0.747* |
| EDS - n (%) With EDS Without EDS | 1 (4.8) 20 (95.2) | 17 (15.5) 93 (84.5) | p=0.304# |
EDS - excessive daytime sleepiness; h - hour; IQR - interquartile range; SD - standard Deviation. *Chi-square test. # Fisher's exact test. §Mann-Whitney test
Discussion
This study aimed to characterize adolescents’ sleep and screen use behaviors during the COVID-19 lockdown. The results showed that 80.9% of the adolescents slept alone in their bedroom, similar to the Spanish reality (86.1%).12 However, the household composition was more diverse in this study, with 57.3% of the adolescents living with both parents (compared to 74.4% in Spain) and 40.5% living with either mother or father (compared to 15.7% in Spain).12 On the other hand, 29.8% of adolescents in this study reported having a disease and 41.2% were taking medication, which can be explained by the fact that the respondents were selected from a hospital setting.
In their study of self-reported sleep quality in adolescents aged 17 and 18 years, Cabré-Riera et al. (2019) showed that 89.4% reported good or very good and 10.6% reported poor or very poor sleep quality.12 These findings slightly differ from the present study, in which 80.1% of adolescents reported good or very good sleep quality, which may be explained not only by the different age ranges of the population surveyed, but also by the impact of the pandemic on sleep quality. In fact, 35.9% of respondents in this study reported that their sleep quality had worsened during this time.
In terms of subjective perception of adequate sleep duration, this study found that 67.2% of adolescents felt they got enough sleep. A similar question was asked of 136 American adolescents aged 13-17 years in 2011, and 55.9% reported the same.18 This difference may be due to the fact that 58% of respondents woke up before 7:00 a.m. on weekdays compared to only 3.8% in the present study. The lockdown may also have affected these results, as online classes do not require a commute and may contribute to later wake-up time.
Compared to similar studies, adolescents in this study seem to sleep longer: median of nine hours on weekdays and 10 hours on weekends, while previous studies reported an average sleep duration of 7.3-7.7 hours before the pandemic.15,18 In addition, the mean bedtime in this study (11:30 p.m. on weekdays) was similar to that reported in a study conducted during the pandemic in Singapore among secondary school adolescents (11:06 p.m.).5 In this study, about one-quarter of respondents (25.9%) slept less than the recommended minimum of eight hours on weekdays, compared to 55.6% in a Hong Kong study conducted before the pandemic.15 A study conducted in Singapore5 showed a significant difference in sleep duration before and after distance learning imposed by lockdown, with an overall longer sleep duration during lockdown. Meanwhile, a study in Tunisia found no significant changes in sleep duration during lockdown without online distance learning.21 These studies seem to support the idea that lockdown and online schooling explain these findings, as discussed above. Other reasons, such as different school schedules or cultural differences between countries, may also be possible explanations.
As expected, the adolescents surveyed in this study seem to sleep longer on weekends (41.4% slept more than 10 hours on weekends compared to 12.6% on weekdays). Sleep schedules also seem to differ, with adolescents going to bed and waking up later on weekends. These results are in line with those of an American study in which half of the participants went to bed between 11:00 p.m. and 02:00 a.m.18 The results of this study are also similar to those of Fobian et al. (2016), who concluded that adolescents who fell asleep later tended to make up for it by waking up later as well.17
Studies evaluating onset insomnia have reported disparate results. Johansson et al. (2016)18) found similar results, with 30% of respondents taking longer than 30 minutes to fall asleep, compared to 30.7% in this study. However, Mak et al. (2014) found a lower rate of 13.6%.15 EDS rates are more difficult to compare because studies have used subjective measures or the Epworth Sleepiness Scale. Reported rates vary from 17.6% to 41.5%, but seem to be higher than the 13.7% found in this study.15,18,23 EDS was also found to be associated with higher screen time and screen use in the hour before sleeping, which is supported by findings from other studies.24
Regarding screen use, this study showed that the group that reported frequent screen use within one hour of bedtime had fewer hours of sleep. These findings are comparable to those of similar studies, including those conducted during the pandemic.1,2,12,13,16-18,24 In fact, the National Sleep Foundation’s Sleep in America Poll found that 97% of adolescents had at least one electronic media device in their bedroom in 2006, and 97% used some type of technology in the hour before sleep in 2011.14,18 Other studies confirmed that having a computer or smartphone in the bedroom at night is associated with shorter sleep duration.24,25 A systematic review found that the use of devices at bedtime was associated with increased odds of inadequate sleep quantity, poor sleep quality, and EDS.24 When comparing different media devices, a systematic literature review found that computers, video games, and mobile devices were more consistently associated with adverse sleep outcomes, with television most likely to have such adverse association.25 Of note, some studies found that the presence of television in the bedroom was associated with less sleep, but no association was found between television use and less sleep.25
Seventy-four percent of adolescents in this study had six or more hours of screen time. Mandatory online classes certainly had an impact on these results. However, 45.0% had more than 10 hours of screen time spent in academic, leisure, and social activities. Studies comparing screen time before and after the lockdown show an increase in total as well as non-academic use.5,21 Adolescents who had more than six hours of screen time were more likely to experience a negative impact on their sleep, with shorter sleep duration and higher EDS rates. These findings are consistent with previous research. Hysing et al. (2015) found similar results, with screen use of more than four hours associated with sleep deficits.16 Parent et al. (2016) also concluded that screen time longer than 10 hours was associated with higher levels of sleep disturbance in adolescents.26
The present study provides an important opportunity to explore the impact of lockdown on sleep and screen use in Portuguese adolescents, adding relevant data to the existing literature. However, it has limitations that should be acknowledged, including its cross-sectional design and the use of subjective self-reports. In addition, the study sample was derived from a group of adolescents evaluated in a hospital outpatient setting, which may also have biased the results obtained. The use of non-validated questionnaires (with the exception of the Pediatric Daytime Sleepiness Scale) is also an important limitation. Despite the available literature on sleep and screen use in adolescents, it is not always possible to compare results because of the different methods used in different studies, especially questionnaires and objective and subjective measures. On the other hand, several studies were conducted before the pandemic, which may explain some of the differences found. Longitudinal studies would provide a more complete understanding of this issue.
As next steps, the authors plan to repeat this study’s survey in the present to compare the results obtained before and after the lockdown measures and better understand how the pandemic has affected the behavior of Portuguese adolescents.
Conclusions
The importance of sleep to adolescent health and brain development should not be understated. The COVID-19 pandemic led to school closures, forcing adolescents to take online classes and spend more time at home, relying on digital technology for leisure and social interaction, and inevitably increasing screen time. Although it has provided a platform for coping with imposed restrictions, excessive screen use has negative consequences in many areas, including sleep. The current study found that most adolescents had six or more hours of screen time per day during the COVID-19 lockdown period. Although the majority reported subjectively good or very good sleep quality and quantity, spending more than six hours per day using electronic devices and using screens within one hour of bedtime were associated with weekday sleep deprivation and EDS. These findings reinforce the importance of identifying and intervening in these issues when addressing adolescent global health.
Authorship
Paula Manuel Vieira - Conception and Design of the Study; Acquisition of Data; Data Analysis; Writing - original draft; Writing - review & editing.
Inês Cascais - Conception and Design of the Study; Acquisition of Data; Data Analysis; Writing - original draft; Writing - review & editing.
Diana Alba - Acquisition of Data; Data Analysis; Writing - review & editing.
Ana Bernardo - Acquisition of Data; Writing - review & editing.
João Faria - Acquisition of Data; Writing - review & editing.
Ana Feio - Acquisition of Data; Writing - review & editing.
Margarida Paiva Coelho - Conception and Design of the Study; Acquisition of Data; Writing - review & editing.
Maria do Céu Ribeiro - Conception and Design of the Study; Acquisition of Data; Writing - review & editing.
Lúcia Gomes - Conception and Design of the Study; Acquisition of Data; Writing - review & editing.
Paula Fonseca - Conception and Design of the Study; Acquisition of Data; Writing - review & editing.
Marta Rios - Conception and Design of the Study; Acquisition of Data; Writing - review & editing.


