Serviços Personalizados
Journal
Artigo
Indicadores
-
 Citado por SciELO
 -
 Acessos
Links relacionados
-
 Similares em
SciELO
Compartilhar
Portugaliae Electrochimica Acta
versão impressa ISSN 0872-1904
Port. Electrochim. Acta v.28 n.3 Coimbra 2010
Use of Experimental Designs to Evaluate the Influence of 2-Mercaptobenzimidazole on the Corrosion of Mild Steel in HCl (1 M) Environment in the Presence of Alcohol Ethoxylate
I. Forsal,1,2,* M. Ebn Touhami,2 B. Mernari,1 J. El Hajri,3 M. Filali Baba4
1 Electrochemical Corrosion and Environment Laboratory, IBN Tofail University, Faculty of Science, BP 133 Kenitra, Morocco
2 Coordination and Analytical Chemistry Laboratory, Chouaib Doukkali University, Faculty of Science El Jadida, Morocco
3 Physical Chemistry Laboratory, Chouaib Doukkali University, Faculty of Science El Jadida, Morocco
4 Analysis Physical-chemical and Catalytic Materials for the Environment Laboratory, Faculty of Science Dhar El Mahraz, Fès, Morocco
DOI: 10.4152/pea.201003203
Abstract
The present study attempted to investigate the best conditions for the use of a mixture of 2-mercaptobenzimidazole and alcohol ethoxylate (C13) as corrosion inhibitor of mild steel in 1 M HCl through the use of the surface response methodology.
A matrix of Doelhert to 4 factors was used as the experimental design in this research as it permits the use of the response surface methodology in a spherical field.
The response used in the exploitation of the design was the determination of the inhibitor efficiency. It was assessed through gravimetric measurements on samples in the absence and presence of the inhibitor. The results were confirmed using electrochemical impedance spectroscopy (EIS).
Keywords: experimental designs, corrosion inhibition, matrix of Doelhert, electrochemical impedance spectroscopy.
Introduction
Steel corrosion and its inhibition by means of organic compounds in acid environment has been the subject of many investigations [1-3]. Various aspects were treated: the influence of the type of acid [4,5], its concentration [6,9] and temperature [10,11]…
Several amines [12-14], mercaptans [15, 16], aminothiols [17], thio-compounds [18], triazole [19], tetrazole [20], imidazole [21], thiazoles [22], phosphonate [23] and alcohol ethoxylates [24] have a good inhibitory effect in hydrochloric acid.
Generally, the experiments were carried out in a sequential manner by varying these parameters in a respective way. This method led to some results but remained too much demanding in terms of time and expense, and required the implementation of a great number of experiments.
The current work is but a contribution to the study of the optimization of the inhibition of steel corrosion in an environment where acid is found by.
Interest was mainly shed on determining the influence of temperature and the time of immersion on the inhibiting capacity of steel corrosion in 1 M HCl of a mixture of 2-mercaptobenzimidazole and alcohol ethoxylate. The influence of these factors was tested by using the methodology of experimental designs [25] that allowed the simultaneous study of the four factors through less experiments.
Experimental part
Experimental conditions
Prior to any measurement, the mild steel samples (0.03% P, 0.4% Mn, 0.08%C, 0.03% S and balance iron) were mechanically polished on wet SiC paper from 400 to 1200 grade respectively. The specimens were washed thoroughly by bidistilled water, degreased ultrasonically in ethanol, and finally dried with acetone before they were immersed in the acid solution at room temperature. The aggressive medium (1 M HCl) was prepared by dilution of analytical grade 37% HCl, and appropriate concentrations of inhibitor were obtained with double distilled water.
Gravimetric experiments were carried out in a double-walled glass cell. The solution volume was 100 mL. The used mild steel specimens had rectangular form (1 cm × 4 cm × 0.08 cm). After the corrosion test, the specimens were carefully washed in double distilled water, dried and then weighted. Triplicate experiments were performed in each case, and the mean of weight loss value was reported.
Weight loss allowed us to calculate the mean corrosion rate as expressed in mg cm-2h-1. The tests were carried out in a cell thermostat.
The electrochemical impedance spectroscopy (EIS) measurements were performed using a transfer function analyser (Voltalab PGZ 100), with a small amplitude A.C. signal (10 mV rms) over a frequency domain from 100 kHz to 10 mHz at 47 °C with 10 points per decade. Computer programs automatically controlled the measurements performed at rest potentials after different immersion times at Ecorr. The impedance diagrams are given in the Nyquist representation.
Experimental strategy
As far as the implementation of the experimental design was concerned, a matrix of Doelhert 4 factors [26] was chosen. The experiment matrices of Doelhert present a uniform distribution of the experimental points in the space of the coded variables.
These experiment matrices permit a sequential step in the study of a second degree reply surface, that is, either to change the field of study by recovering some of the experimental points used at the time of a preceding study, or add, for example, a new factor with new experimental points to the studied design.
A polynomial model of the second degree is established to quantify the influence of the variables on the reply [26]:

where: X1, X2, X3 and X4: independent variables representing the immersion time, the concentration of inhibitor, the concentration of alcohol ethoxylate and temperature of the solution; b0: constant; b1, b2, b3 and b4: coefficients reflecting the effect of factors X1, X2, X3 and X4; b12, b13, b14, b23, b24, and b34: coefficients reflecting the interaction between two factors X1X2, X1X3, X1X4, X2X3, X2X4 and X3X4; b11, b22, b33 and b44: coefficients reflecting the influence of quadratic X1, X2, X3 and X4.
Study area
The field of variation of the 4 studied experimental factors was selected in order to approach the natural conditions which can be met in the experimental field.
The maximum level tolerated for the four factors was 7 for the concentration of inhibitor and alcohol ethoxylate, 5 for the temperature from immersion and 3 for the immersion time.
Classically, the various levels were expressed in a system of coded variables. Level +1 corresponded to the highest natural value and level -1 to the lowest natural value.
The correspondence between real variables and coded ones was done starting from the following equation:

where: Xj = value of the variable factor in j-coded; Uj = corresponding value of factor j in natural variable; and = central value in the field of variation:

All fields of variation for the 4 studied factors are warranted in Table 1:
Table 1. Center and variation step of parameters.

Experimental response
The only experimental response followed in the current study was the inhibition efficiency of mixtures E%; it is calculated by using the following equation:

where V0 and V are the weight loss of steel without and with inhibitor/mixtures, respectively.
Used matrix
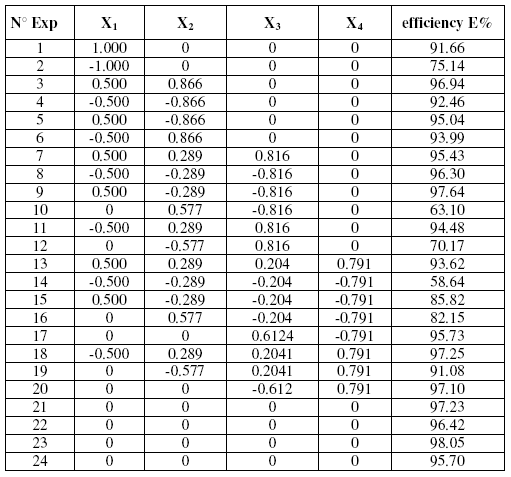
Table 2 displays the Doehlert matrix design [27] used. All experiences were achieved in duplicate, with or without studied inhibitor. A point was also added to the centre of the domain that was achieved in triplicate.
The use of factor coding relations permitted to transform the experience matrix in designs of experimentation that were expected to be fulfilled. Responses measured for the inhibitor efficiency of the different mixture were represented in Table 2.
Table 2. Experimental matrix used with response vectors.
Results and discussions
Statistical treatment of data
The statistical treatment is very significant with regard to the interpretation of results. In our case the statistical analysis consists in estimating, thanks to the least square method, coefficients of the model and the different residues (gap between the observed values and values foreseen by the model). The results were obtained through NEMRODW software [28]. Tests of multiple regressions allowed the development of the mathematical (eq. (5)) model, permitting the inhibition reaction’s efficiency simulation as a function of the four studied factors in the tentative domain of interest:

Validity of the model
The statistical analyses that led to the validity of the model are displayed as variance analysis in Table 3.
This table provides the percentage of variance explained by the mathematical model in comparison to the variance contained within the experimental results.
The probability for ANOVA is smaller than 5% confirmed the validity of the suggested model.
Table 3. Analysis of variance(ANOVA) for the response model.

Graphic analysis of the model
The aim of this study was to find an inhibitor solution whose features would have been previously defined from the operative conditions extracted from the mathematical model.
Because the direct exploitation of the equation was delicate, it was convenient to restore it under a graphic representation; while fixing two of the four factors of the survey, it was possible to represent the response surface materializing the surface of regression in a three-dimensional space. It was also possible to project the equation in a design under isoresponse curves, interpreted as card curves level.
Evolution of efficiency as a function of the concentration of inhibitors and the immersion time
Fig. 1 shows the evolution of the inhibition efficiency as a function of the immersion time and the inhibitor efficiency. We can see that the length has a weak influence on the tentative response. The maximal efficiency is obtained for an immersion time of 0,25 in coded variable, i.e., 16 hours in real variable.
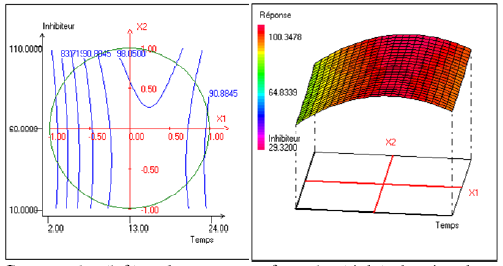
Figure 1. Contour plot (left) and response surface plot (right) showing the variation of response (efficiency) as a function of the immersion time (X1) and concentration of inhibitor (X2). The temperature (X4) is fixed at 40 °C and the concentration of alcohol ethoxylate is fixed at 31.00 mg/L.
Evolution of efficiency as a function of the inhibitor and alcohol ethoxylate concentrations
Fig. 2 shows the synergism between the two factors: the concentration of inhibitor and alcohol ethoxylate in inhibitor efficiency at 13 h of immersion and at temperature of 40°C. It can be noted that the effect of the alcohol ethoxylate differed according to the inhibitor efficiency’s variation. This effect becomes positive and even more important when the inhibitor efficiency is raised.
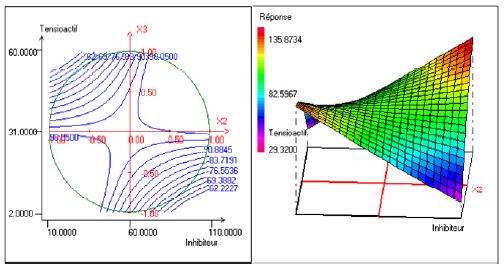
Figure 2. Contour plot (left) and response surface plot (right) showing the variation of response (efficiency) as a function of the inhibitor’s concentration (X2) and of the concentration of alcohol ethoxylate (X3) .The immersion time (X1) is fixed at 13 h and the temperature (X4) is fixed at 40 °C.
Evolution of efficiency as a function of the inhibitor concentration and temperature
Fig. 3 represents the evolution of the efficiency as a function of the temperature and the inhibitor efficiency. This figure shows that the inhibitor efficiency increased when the temperature increased. This evolution was however more accentuated for the weakest concentrations in inhibitors.
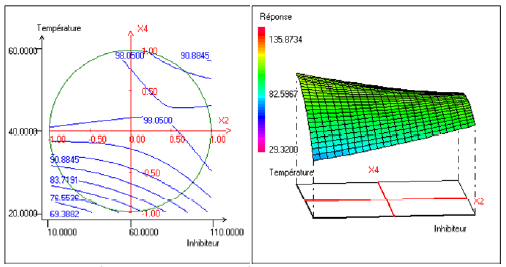
Figure 3. Contour plot (left) and response surface plot (right) showing the variation of response (efficiency) as a function of concentration of the inhibitor (X2) and temperature (X4). The immersion time (X1) is fixed at 13 h and the concentration of alcohol ethoxylate is fixed at 31.00 mg.
Confirmation of the results by EIS
The corrosion of mild steel in acidic solution in the presence of a mixture was investigated by the EIS method at 47°C, after 30 min, 6 h and 13 h of immersion, for a quantity of inhibitor and alcohol ethoxylate equal to 66.69 mg / L and 32.35 mg / L, respectively. The locus of the Nyquist plots was regarded as one part of a semicircle. Nyquist diagrams of ordinary steel with and without mixture are shown in Fig. 4. The values of charge-transfer resistance (Rt) and double layer capacity (Cdl) were obtained with impedance measurements as described elsewhere [29]. The impedance parameters and values of E (%) are given in Table II. The results described below can be interpreted in terms of the equivalent circuit of the electrical double layer shown in Fig. 5, which has been used previously to model the iron-acid surface [30].
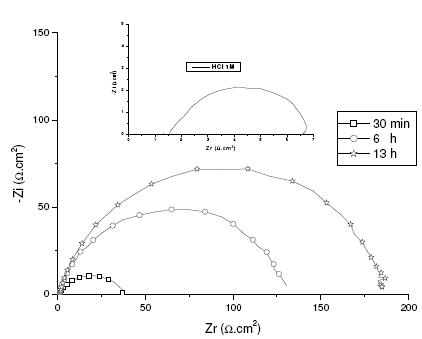
Figure 4. EIS spectra under open circuit conditions at different immersion times. System: mild steel in 1 M HCl + 66.69 mg / L of inhibitor and 32.35 mg / L of alcohol ethoxylate at 47 °C.

Figure 5. Equivalent circuit for the metal-acid interface.
Table 4. EIS data of mild steel in 1 M HCl + 66.69 mg / L of inhibitor and 32.35 mg / L of alcohol ethoxylate at 47 °C.

In agreement with the gravimetric measurements, electrochemical impedance spectroscopy showed that the inhibition efficiency surpassed 96% to the optimal conditions.
It is clear that the Rt values increased sharply from 6 to 185 O cm2 during the initial 13 h and remained fairly constant afterward. At the same time, the Rt value remained constant and had the same value as 6 µF cm-2 after 13 h. These results show that the formation of the inhibitor surface film [31, 32], and therefore the inhibitor adsorption on the electrode surface was relatively fast and completed within optimal conditions [33].
Conclusions
The surface response methodology was used to find out the best conditions by means of 2-mercaptobenzimidazole and alcohol ethoxylate (C13) as corrosion inhibitor of mild steel in 1 M HCl.
The experiment design methodology has enabled us, through a limited number of carefully selected tests, to get a description of the studied response behaviour within the experimental area and thus determine experimental conditions that maximize the efficiency of inhibition. In this regard, the obtained efficiency was 98.5% for treatment at 47 °C for 13 h for a quantity of inhibitor and alcohol ethoxylate equal to 66.69 mg / L and 32.35 mg / L, respectively.
Acknowledgement
Special thanks should go to professor Bouchra Bouklata for willingly accepting to revise the article though her sickness.
References
1. F. Bentiss, M. Largenee, M. Tralsnel, J. Appl. Electroch. 29 (1999) 1073. [10.1023/A:1003421111890] [ Links ]
2. T.Y. Soror, H.A. El-Dahan, N.G. El-Sayed Ammer, J. Mater. Sci. Technol. 15 (1999) 16.
3. H.B. Fan, C.Y. Fu, H.L. Wang, X.P. Guo, J.S. Zheng, Br. Corros. J. 37 (2002) 122. [10.1179/000705902225004383]
4. F. Bentiss, M. Traisnel, M. Lagrenee, Corros. Sci. 42 (2000) 127. [10.1016/S0010-938X(99)00049-9]
5. A. Chetouani, A. Aouniti, B. Hammouti, N. Benchat, T. Benhadda, S. Kertit, Corros. Sci. 45 (2003) 1675. [10.1016/S0010-938X(03)00018-0]
6. Y. Abboud, A. Abourriche, T. Saffaj, M. Berrada, M. Charrouf, A. Bennamara, N. Al Himidi, H. Hannache, Mater. Chem. Phys. 105 (2007) 1. [10.1016/j.matchemphys.2007.03.037]
7. B. Mernari, H. El-Attari, M. Traisnel, F. Bentiss, M. Lagrenéé, Corros. Sci. 40 (1998) 391. [10.1016/S0010-938X(97)00142-X]
8. M.A. Quraishi, M.A.W. Khan, D. Jamal, M. Ajmal, S. Muralidharan, S. Iyer Venkatakrishna, J. Appl. Electrochem. 26 (1998) 1253. [10.1007/BF00249927]
9. M.A. Quraishi, M.A.W. Khan, D. Jamal, Trans. Ind. Inst. Met. 51 (1998) 34.
10. E. Stupnisek-Lisac, Z. Ademovic, Proc. 8th European Symposium on Corrosion Inhibitors, Ann. Univer. Ferrara, Italy, 1995, P.257
11. S.S. Abd El-Rehim, S.A.M. Refacey, F. Taha, M.B. Saleh, R.A. Ahmed, J. Appl. Electrochem. 31 (2001) 429. [10.1023/A:1017592322277]
12. A.L. de Queiroz Baddini, S.P. Cardoso, E. Hollauer, J.A. da Cunha Ponciano Gomes, Electrochim. Acta 53 (2007) 434. [10.1016/j.electacta.2007.06.050]
13. A. Chetouani, M. Daoudi, B. Hammouti, T. Ben Hadda, M. Benkaddour, Corros. Sci. 48 (2006) 2987. [10.1016/j.corsci.2005.10.011]
14. K. Tebbji, I. Bouabdellah, A. Aouniti, B. Hammouti, H. Oudda, M. Benkaddour, A. Ramdani, Mater. Letters 61 (2007) 799. [10.1016/j.matlet.2006.05.063]
15. A. Balezin, S.M. Belen’kii, Yu.P. Aronson, N.M. Belen’Kaya, Zashchita Metallov 4 (1968) 385.
16. R.S. Chaudhary, A. Singh, J. Electrochem. Soc. Ind. 46 (1997) 119.
17. K.C. Pillai, R. Narayan, Corros. Sci. 23 (1983) 151. [10.1016/0010-938X(83)90113-0]
18. M.T. Makhlouf, S.A. El-Shatory, A. El-Said, Mater. Chem. Phys. 43 (1996) 76. [10.1016/0254-0584(95)01593-J]
19. W. Li, Q. He, C. Pei, B. Hou, Electrochim. Acta 52 (2007) 6386. [10.1016/j.electacta.2007.04.077]
20. F. Zucchi, G. Trabanelli, M. Fonsati, Corros. Sci. 38 (1996) 2019. [10.1016/S0010-938X(96)00094-7]
21. M. Scendo, M. Hepel, Corros. Sci. 49 (2007) 3381. [10.1016/j.corsci.2007.03.022]
22. D. Kuron, H.-J. Rother, H. Graefen, Werkst. Korros. 32 (1981) 409. [10.1002/maco.19810321002]
23. M. Benabdellah, A. Dafali, B. Hammouti, A. Aouniti, M. Rhomri, A. Raada, O. Senhaji, J.-J. Robin, Chem. Eng.. Comm. 194 (2007) 1328. [0.1080/00986440701401362]
24. D. Chebabe, Z. Ait Chikh, A. Dermaj, K. Rhattas, T. Jazouli, N. Hajjaji, F. El Mdari, A. Srhiri, Corros. Sci. 46 (2004) 2701. [10.1016/j.corsci.2004.03.016]
25. D. Mathieu, R. Phan Tan Luu, Designs d’expériences, applications à l’entreprise, J.J. Droesbecke, J. Fine, G. Saporta, Eds., Technip, Paris, 1997.
26. D. Benoist, Y. Tourbier, S. Germain-Tourbier, Designs d’expériences: construction et analyse, Technique & Documentation, Lavoisier, 1994.
27. J. Goupy, Pratiquer les designs d’experiences. ISBN 2 10 004217 3 Dunod, Paris, 2005.
28. D. Mathieu, J. Nony, R. Phan-Tan-Luu, NEMROD-W software, LPRAI, Marseille, 2000.
29. A. Popova, M. Christov, A. Vasilev, Corros. Sci. 49 (2007) 3290. [10.1016/j.corsci.2007.03.012]
30. I. Forsal, L. Lakhrissi, K. Naji, C. Jarmoumi, M. Ebn Touhami, B. Lakhrissi, S. Abirou, B. Benali, M. Addou, Spectroscopy Letters 43 (2010) 1.
31. E.S.M. Sherif, R.M. Erasmus, J.D. Comins, J. Colloid Interf. Sci. 311 (2007) 144. [10.1016/j.jcis.2007.02.064]
32. I.L. Rosenfeld, Corrosion Inhibitors, McGraw-Hill, New York, 1981.
33. Sha Cheng, Shougang Chen, Tao Liu, Xueting Chang, Yansheng Yin, Electrochim. Act 52 (2007) 5932. [10.1016/j.electacta.2007.03.038]
Received 19 September 2009; accepted 21 June 2010
* Corresponding author: forsalissam@yahoo.fr


