Serviços Personalizados
Journal
Artigo
Indicadores
-
 Citado por SciELO
 -
 Acessos
Links relacionados
-
 Similares em
SciELO
Compartilhar
Portugaliae Electrochimica Acta
versão impressa ISSN 0872-1904
Port. Electrochim. Acta vol.29 no.5 Coimbra set. 2011
https://doi.org/10.4152/pea.201105349
Metal Recovery from Aqueous Solutions
C. Ascensão, L. Ciríaco*, M.J. Pacheco, A. Lopes
UMTP Department of Chemistry, University of Beira Interior, 6201-001, Covilhã, Portugal
doi: 10.4152/pea.201105349
Abstract
Metal recovery by reduction of metal ions present in model solutions, containing one or more heavy metals, was performed. To prepare the model solutions, sulfates and/or chlorides of Cu(II), Cd(II), Pb(II) and Zn(II) were used, at pH 3.5. Assays were run in a one or two compartments cell, at different applied potentials, using a steel plate as cathode, a platinum plate as anode and an Ag/AgCl, KClsat as reference electrode. The metal recovery yield was determined by atomic absorption spectroscopy. The phases corresponding to the metallic deposits were identified by X-ray diffraction. For the solutions containing just one metal ion, the best metal recoveries and the corresponding applied potentials, obtained in a one cell compartment, were the following: Cu2+ 99% at E = -100 mV; Pb2+ 99% at E = -800 mV; Cd2+ 93% at E = 900 mV; and Zn2+ 38% at E = -1300 mV.
The metal removals from the mixed solution of four heavy metals, after 4 consecutive chronoamperometries, performed in a one compartment cell, at the best applied potentials determined with the solutions containing only one metal ion, were the following: Cu2+ 99%; Pb2+ 68%; Cd2+ 92%; and Zn2+ 10%.
Keywords: metal recovery, copper, lead, cadmium, zinc
Introduction
Heavy metals are one of the most dangerous classes of pollutants [1,2]. There are several methods for their separation and recovery, some of them using a combination of various techniques, such as membrane processes, electrolysis or precipitation, to recover metal ions in the metallic state or as oxides or hydroxides, with the possibility of being reused later, thereby recovering their market value [3,4].
The application of electrochemical techniques in the environmental remediation is increasing because, besides being very versatile, they can be applied in the removal of polluting solids, liquids and gases. The recovery of heavy metals from aqueous solutions is one of the examples of the use of electrochemical methods with environmental purposes [5-9]. In fact, several metal ions in solution can be recovered in the metallic form by reduction at a cathode under specific conditions. Examples are silver and copper [5,8,10-15], whose economic value is significant, and cadmium, lead and nickel [6] used in common and car batteries, whose toxicity is high. The recovery of metals from Ni-Cd batteries has also been intensively studied in the last decade [7,16-18]. In the case of lead, besides the reduction at the cathode, its oxidation can also take place at the anode, obtaining lead metallic and lead oxide (IV) [19], respectively, being both useful products. During the metal ion recovery from solution, cathodic side reactions can take place, like hydrogen evolution or reduction of the dissolved oxygen to form water, thus decreasing the current efficiency of the process. Besides the recovery of isolated metal ions, several papers were also published in what concerns the recovery of metals from mixed solution [9,18,20,21].
In this paper, the deposition of several metals from aqueous solutions containing either a single metal ion or a mixture of metal ions is reported. Metal recoveries were performed under potentiostatic conditions from chloride or sulfate solutions containing Cu(II), Pb(II), Cd(II), Zn(II) as heavy metals.
Experimental
All reagents used in this study were analytical grade, from Sigma Aldrich, having purities higher than 99%. The model solutions were aqueous solutions containing one or more metal salts and an electrolyte. The heavy metal salts used in the preparation of the model solutions were copper sulfate, cadmium sulfate, zinc sulfate and lead chloride, with concentrations of 10-2 mol L-1 . This value was chosen since this is a common value for the concentration of heavy metals in some industrial effluents [5,21]. In the case of lead, a chloride salt was used instead of the sulphate, since sulfate salt has very low solubility. The electrolytes, Na2SO4 or KCl, were chosen since they have a common anion with the metal salt and they were used with a concentration of 0.035 mol L-1. H2SO4 or HCl solutions, 0.1 mol L-1, were used to correct the pH value to 3.5 [9].
In order to choose the potential values to run the assays of metal recovery from solution, by chronoamperometry, linear and cyclic voltammetries were run with the model solutions. Applied scanning rates ranged between 0.025 and 25 mV s-1. After the identification of the highest cathodic potential (HCP) that allowed the recovery of the metal from solution, chronoamperometries were performed with the model solutions containing one or the four metal salts. In the former case, chronoamperometry was run for 3 h at several cathodic applied potentials, lower than HCP determined for the metal, and the metal ion yield recovery was calculated; in the later case, four chronoamperometries were successively run, with duration of 3 h each, at the different applied potentials determined in the first part of the study as those who allowed best recovery yields for every metal ion.
Chronoamperometries were performed, at room temperature, with stirring. The total volume of solution used in the experimental assays of metal recovery was 200 mL, for tests run in a one compartment cell. This cell had four electrodes connected to the potentiostat/galvanostat: an Ag/AgCl, KClsat electrode as reference electrode; a steel plate with 10 cm2 (both sides) as working electrode; two square platinum plates, 12.5 cm2 each, as auxiliary electrodes, placed on each side of the steel plate.
In the case of lead chloride, an electrochemical cell with two compartments was also used. One of the compartments contained 150 mL of metal salt solution in the electrolyte, acidified to 3.5, the working electrode and the reference electrode. The other compartment had 150 mL of acidified electrolyte solution and the auxiliary electrode. The two compartments were separated by a membrane, and joined by a salt bridge with a high concentration of electrolyte in the cell, 1 mol L-1.
The electrochemical studies were carried out in a potentiostat-galvanostat, VoltaLab brand, model PGN 301.
In order to determine the metal recovery yield, 10 mL samples were collected every hour and quantification of the metals in the samples was performed by atomic absorption spectroscopy, using a Philips apparatus, model PYE UNICAM SP9. The phase identification of the metallic deposits over the cathode and/or anode was obtained by X-ray diffraction (XRD), using a Rigaku X-ray diffractometer model DMAXIII / C with Cu K radiation (λ = 0.15406 nm) and working at 30 kV/40 mA. The diffraction patterns were collected in the range of 2θ = 10-90° with a 0.02° step and an acquisition time of 2 s per step. Scanning electron microscopy (SEM) and spectroscopy of energy dispersion X-ray (EDS), performed with Hitachi Model S-2700/Oxford (60-74), were used to visualize the morphology of the deposits and to have its semi-quantitative chemical analysis, respectively.
Results and discussion
Voltammetric study
In order to select the applied potential for the cathodic deposition of the heavy metals in solution, linear voltammetries were run for the different solutions containing metal salt, at several scan rates. Fig. 1 presents the linear voltammetries performed at 20 mV s-1, used to determine HCP for the different metal ions, which were the following: Cu(II) -100 mV, Pb(II) -400 mV, Cd(II) 600 mV and Zn(II) -1000 mV.
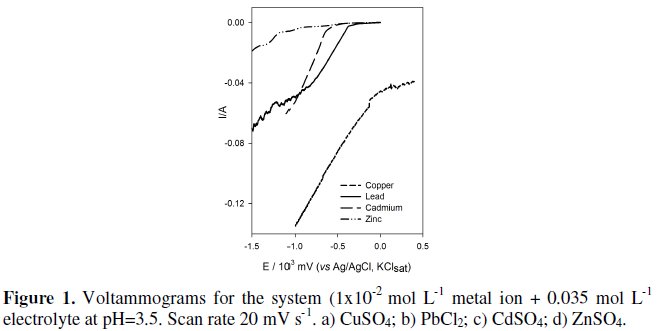
In the linear voltammogram performed with the zinc solution some shoulders were unexpectedly found, since it was predictable that Zn (II) was directly reduced to the metallic phase. This observation may be explained by the existence of further reductions, related to the reduction of the sulfate to S and later to HS-, species that are soluble in aqueous media [22], or a Zn2+ underpotential reduction. This has only been detected with zinc, probably because it presents a reduction potential more cathodic than the other studied metals.
Removal of metals from solution by chronoamperometry
Copper
Fig. 2, a to c, shows the micrographs obtained from deposits on the cathode at three different applied potentials, -100, -300 and -500 mV, respectively, equal and more cathodic than the HCP determined for copper. Analysis of these micrographs shows a more stratified morphology for the applied potential of -100 mV.
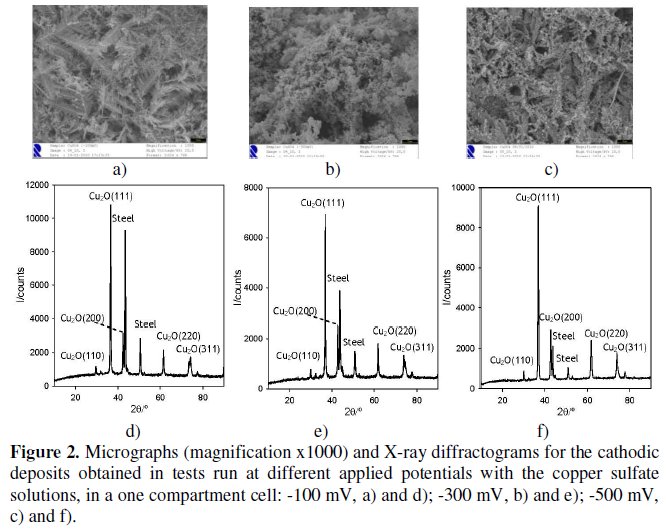
The diffractograms of these deposits (Fig. 2, d to f) identified cuprite, Cu2O, as the main phase, meaning that Cu (II) in solution was mostly reduced to Cu (I). The diffractograms are quite clear, with narrow peaks well defined, and when compared with XRD files from database of the Joint Committee on Powder Diffraction Standards (JCPDS) confirm that the obtained deposit was cuprite, since the experimental diffractogram coincides with that of the PDF file # 05-0667 of the Cu2O, cubic structure, with a = 0.42696 nm. Thus, copper (II) initially in solution was reduced to copper (I) forming the cuprite. In fact, for the applied cathodic potentials the formation of cuprite is only predictable for solutions more basic than those used [22]. However, H+ reduction to H2 may compete with the reduction of Cu2+, at the cathode, increasing the local pH and favouring the formation of cuprite. At the end of the tests, the copper removal is almost total, being higher for the less cathodic applied potential (-100 mV).
Lead
Fig. 3 presents the SEM (Fig. 3a to c) and XRD (Fig. 3d to f) results for the deposits obtained for the chronoamperometries performed with lead chloride solutions, carried out in one compartment cell, at applied potentials of -500 and 800 mV.
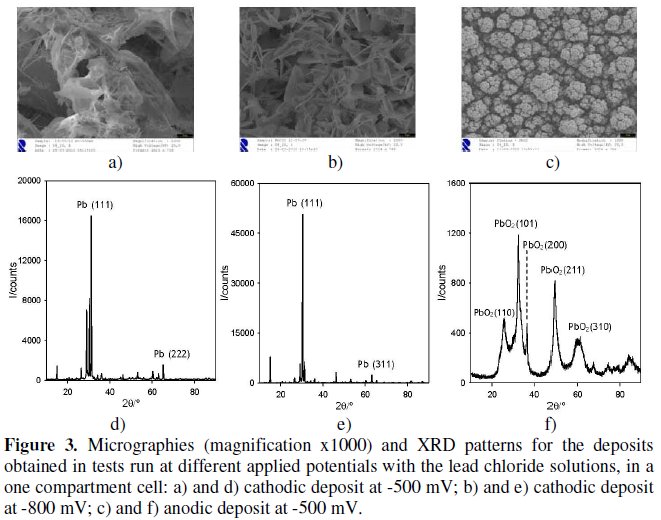
During these chronoamperometries the occurrence of a black anodic deposit was also observed, whose SEM and XRD results are also presented in Fig. 3. By analyzing the experimental diffractograms and comparing them with XRD database files, JCPDS, references (PDF # 04-0686 for Pb and PDF # 52-0751 for PbO2) a similarity between the values of interplanar distances points to a lead deposit over the cathode, with cubic structure and a = 0.49506 nm, and a deposit of lead oxide over the platinum anode, with an orthorhombic structure and a = 0.493 nm, b = 0.4814 nm and c = 0.3363 nm. As the objective of this work was the recovery of metal ions in solution by cathodic reduction and in lead ion solution assays with one cell compartment, we have obtained simultaneous formation of cathodic and anodic deposits, similar tests were run in a two compartments electrochemical cell to avoid the anodic deposits. In these tests, since the anodic compartment did not contain lead ion (as described in the experimental section), only cathodic deposits were obtained, corresponding to the same Pb metal phase identified in the tests run in a one compartment electrochemical cell (data not shown).
Cadmium
Fig. 4 shows the micrographs and XRD patterns of the cathodic deposits obtained with the chronoamperometries performed with cadmium sulfate solutions at three different applied potentials: -700, -800 and -900 mV.
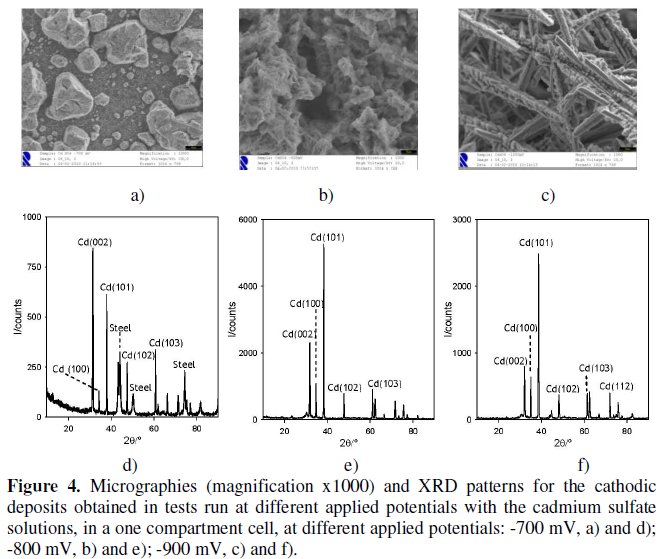
For the applied potential of -900 mV a more stratified morphology can be observed. Regarding the diffractograms, when a comparison with the database JCPDS files is made, the presence of cadmium metal for the three deposits can be identified, coinciding with the PDF file #05-0674, showing a hexagonal structure, with a = 0.2979 nm, b = 0.2979 nm, c = 0.5618 nm, a=b=90° and g=120°.
Zinc
Fig. 5, a to c, shows the micrographs of the deposits obtained on the steel cathodes, for the three different applied potentials (-1200, -1300 and -1400 mV), showing a morphology less defined for the more cathodic potential studied (1400 mV).
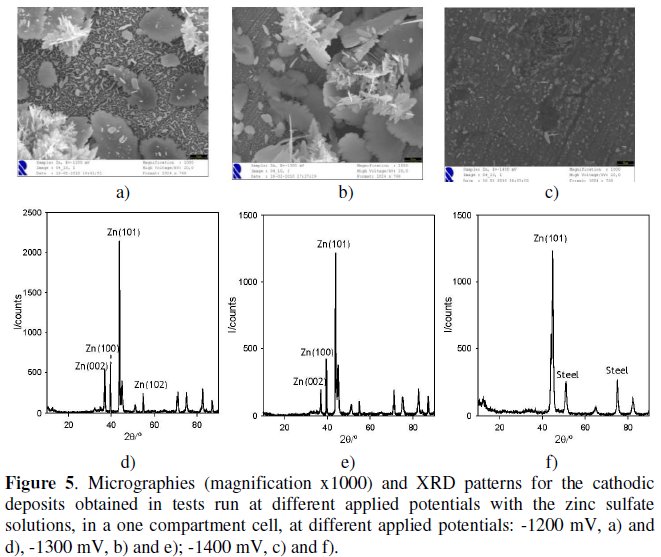
Fig. 5 also presents the diffractogram of the deposits and, when the results are compared with those from JCPDS XRD database files, one can come to the conclusion that the deposit obtained is metal zinc, since the diffractogram match the PDF file # 04-0831, for hexagonal structure, with a = 0.2665 nm, b = 0.2665 nm, c = 0.4947 nm, a=b=90° and g=120°. For the highest cathodic applied potential, -1400 mV, some refraction lines attributed to steel were detected. These lines have also been observed in some of the metal recoveries performed with copper and cadmium solutions. They were not detected in the diffractograms obtained for zinc recovery at higher applied potentials, probably due to the increase in zinc deposit obtained at less cathodic potentials that covers the substrate in a more regular way.
Table 1 shows the metal removals from solution obtained after 3 hour assays for the various applied potentials, for solutions containing a single heavy metal.

Mixed solution with four heavy metals During the preparation of the aqueous solution containing sulfates of copper (II), cadmium (II) and zinc (II) and chloride of lead (II), in a concentration of 0.01 mol L-1 each, and 0.035 mol L-1 sodium sulphate, the formation of a precipitate of lead sulfate (Solubility of 1.4×10⁻⁵ mol L-1 at 25 °C [23]) occurred. After several hours stirring, the suspension was filtered and with the resulting solution a cyclic voltammetry was performed, at a scan rate of 25 mV s-1, starting at 2000 mV (Fig. 6).
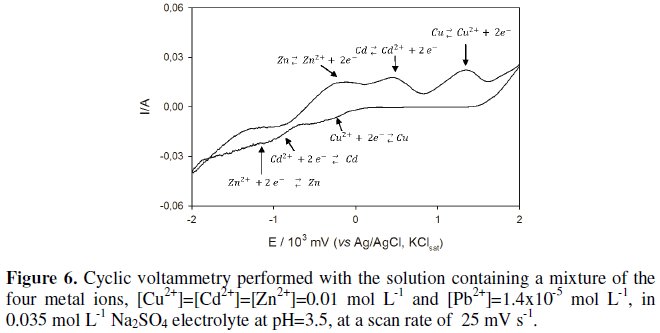
Several successive reductions were observed in the cathodic scan, as well as several oxidations in a row in the anodic sweep. These peaks were assigned to the redox processes related with three of the four heavy metals in solution (Fig. 6) according to the sequence of the standard reduction potential. Despite the lead ion should also undergo reduction and oxidation, as its concentration is much lower than that of the other metals in solution, its redox processes are hidden between those of copper and cadmium.
Fig. 7 shows the successive chronoamperometries for the mixed solution, performed at the different chosen applied potentials, in 3 h periods each.
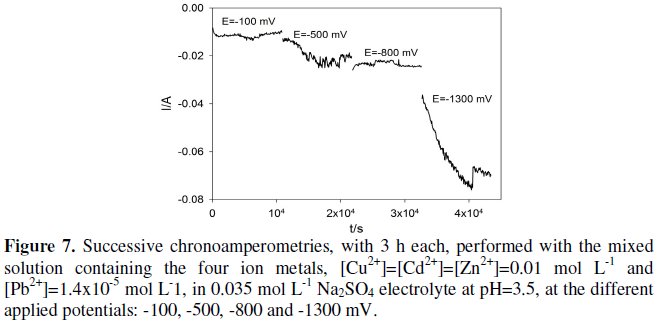
Although this experiment was held in a one compartment cell, there was no black deposit of PbO2 on the anode. This may be due to the fact that lead concentration in solution was very low. In the analysis by EDX of the cathode deposits it was not possible to identify lead, probably due to the same reasons.
The metal removals from solution during the successive chronoamperometries are presented in Table 2 and, with the exception of zinc, good removals were obtained at the end.
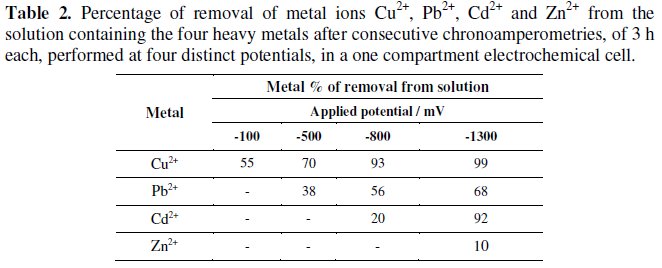
The XRD analysis of the cathodes allowed the conclusion that heavy metals were recovered in metallic form, even for copper, which, when isolated in solution, was recovered in the form of cuprite. Comparing the values of removals obtained in the individual test, after 3 hours, with the values obtained in the mixed solution, it appears that removal is greater when the metal is "isolated". The worst removal values have been obtained for zinc in both situations, due to the high formation of hydrogen even at its HCP.
Conclusions
The recovery of copper from solution presented different behaviors for solutions containing just Cu2+ or a mixture of Cu2+ with other metal ions, at the same applied potential and with the same experimental setup: in the former case, copper was recovered by reduction on the cathode in the form of Cu2O and, in the later case, it was deposited over the cathode has metallic copper.
Regarding Pb2+ removal from aqueous solutions, it was recovered in the metallic form over the cathode and in the form of PbO2 over the anode, when tests were run in a one compartment cell. However, when the assay was performed in a two compartments cell, with the metal ion only in the cathodic solution, lead was recovered in the metallic form over the cathode, avoiding anodic deposit. The removal of lead ion from solution in the cell with two compartments was significantly lower than that obtained in a one compartment cell.
Metal ions Cd2+ and Zn2+ were recovered in the metallic form over the cathode, in a one compartment cell, either from the solutions containing just a single metal ion or when solutions containing a mixture of metal ions were used.
The best results obtained in the recovery of the different metals, obtained in a one compartment cell, after 3 h under the applied experimental conditions, for solutions containing just one metal ion, were: Cu2+ 99% at E = -100 mV; Pb2+ 99% at E = -800 mV; Cd2+ 93% at E = -800 mV and Zn2+ 38% at E = -1300 mV. The low yield observed for zinc is related to the fact that its reduction is given under conditions where the release of hydrogen is quite intense and there is competition between the two reduction processes.
The duration of the experiments containing single metal ion was adequate for the almost total removal of metals from solutions, with the exception made to zinc ion solutions. In the case of the mixed solutions, with four metal ions, the four consecutive runs, with 3 h each, at selected potentials, proved to be enough to achieve high removals of the various metals, exception made for zinc: 99% for Cu2+, 68% for Pb2+, 92% for Cd2+ and 10% for Zn2+.
References
1. A. Fuentes, M. Llorens, J. Saez et all, Environ. Pollut. 143 (2006) 355. [ Links ]
2. F. Hammy, G. Mercier, J-F. Blais, Hydrometallurgy 80 (2005) 232. [ Links ]
3. A. Janin, F. Zaviska, P. Drogui et all, Hydrometallurgy 96 (2009) 318. [ Links ]
4. V. Cinanni, I.A. Gough, A.J. Sciuto, Desalination 106 (1996) 145. [ Links ]
5. M. Hunsom,_K. Pruksathorn, S. Damronglerd et all, Water Res. 39 (2005) 610. [ Links ]
6. N.M.S. Kaminari, D.R. Schultz, M.J.J.S. Ponte at all, Chem. Eng. J. 126 (2007) 139. [ Links ]
7. V.G. Lacerda, A.B. Mageste, I.J.B. Santos et all, J. Power Sources 193 (2009) 908. [ Links ]
8. C.A. Basha, N.S. Bhadrinarayana, N. Anantharaman, K.M.M.S. Begum, J. Hazard. Mater. 152 (2008) 71. [ Links ]
9. L. Doulakas, K. Novy, S. Stucki, Ch. Comninellis, Electrochim. Acta 46 (2000), 349. [ Links ]
10. M.C. Santos, S.A.S. Machado, L.A. Avaca, L.H. Mascaro, Quím. Nova 23 (2000) 392. [ Links ]
11. R.Y. Bek, V.N. Kiryushov, L.I. Skvortsova et all, J. Anal. Chem. 55 (2000) 1069. [ Links ]
12. J.P. Chen, L.L. Lim, Chemosphere 60 (2005) 1384. [ Links ]
13. D. Arrington, M. Curry, S. Street, G. Pattanaik, G. Zangary, Electrochim. Acta 53 (2008) 2644.
14. K.I. Popov, T.M. Kostic, N.D. Nikolic et all, J. Electroanal. Chem. 464 (1999) 245. [ Links ]
15. K.I. Popov, P.M. Zivkovic, S.B. Krstic, N.D. Nikolic, Electrochim. Acta 54 (2009) 2924. [ Links ]
16. C.-C. Yang, J. Power Sources 115 (2003) 352. [ Links ]
17. R. Mayen-Mondragon, J.G. Ibanez; R.C. Vasquez et all, Water Air Soil Poll. 194 (2008) 45. [ Links ]
18. F-R. Xiu, F-S. Zhang, J. Hazard. Mater. 170 (2009) 191. [ Links ]
19. N.P. Brandon, D. Pilone, G.H. Kelsall, Q. Yin, J. Appl. Electrochem. 33 (2003) 853. [ Links ]
20. K. Scott, X. Chen, J.W. Atkinson, M. Todd, Resources, Conserv. Recycling 20 (1997) 43. [ Links ]
21. D. Pilone, G.H. Kelsall, Electrochim. Acta 51 (2006) 3802. [ Links ]
22. M. Pourbaix, Atlas D'équilibres électrochimiques à 25 °C, Ed., Gauthier-Villars & Cie éditeur, Paris, 1963. [ Links ]
23. Handbook of Chemistry and Physics, CRC Press, Inc, Florida, 63rd Ed., 1982-1983. [ Links ]
Acknowledgements
Fundação para a Ciência e a Tecnologia, FCT, PTDC/AAC-AMB/103112/2008.
* Corresponding author. E-mail address: lciriaco@ubi.pt
Received 5 January 2011; accepted 3 March 2011


