Serviços Personalizados
Journal
Artigo
Indicadores
-
 Citado por SciELO
 -
 Acessos
Links relacionados
-
 Similares em
SciELO
Compartilhar
Portugaliae Electrochimica Acta
versão impressa ISSN 0872-1904
Port. Electrochim. Acta vol.31 no.1 Coimbra jan. 2013
https://doi.org/10.4152/pea.201301021
Corrosion Behaviour of 18%Ni M250 Grade Maraging Steel under Welded Condition in Hydrochloric Acid Medium
Pradeep Kumar and A. Nityananda Shetty*
Department of Chemistry, National Institute of Technology Karnataka, Surathkal, Srinivasnagar, Mangalore 575025, Karnataka, India
Abstract
The corrosion behaviour of welded maraging steel in hydrochloric acid solutions was studied over a range of acid concentration and solution temperature by electrochemical techniques like Tafel extrapolation method and electrochemical impedance spectroscopy. The corrosion rate of welded maraging steel increases with the increase in temperature and concentration of hydrochloric acid in the medium. The energies of activation, enthalpy of activation and entropy of activation for the corrosion process were calculated. The surface morphology of the corroded sample was evaluated by surface examination using scanning electron microscopy (SEM) and energy dispersive X-ray spectroscopy (EDS).
Keywords: maraging steel, EIS, polarization, SEM, EDS.
Introduction
Over past decades, a growing interest has been observed in the study of electrochemical and corrosion behaviour of metals and alloys in acidic media. Maraging steel, the most widely used engineering material, corrode in many circumstances, especially in some industrial processes, such as acid cleaning, acid descaling and oil well acidizing. The alloy is a low carbon steel that classically contains about 18 wt % Ni, substantial amounts of Co and Mo together with small additions of Ti. However, depending on the demands dedicated by the application, the composition of the material can be modified [1]. For many of the applications of maraging steels, welding is the important means of fabrication. The unique property of being weldable in the solutionised condition followed by a low temperature (480 °C) post weld maraging treatment makes these steels attractive for fabrication of large structures [2]. According to available literature, atmospheric exposure of 18 Ni maraging steel leads to corrosion in a uniform manner and becomes completely rust covered [3,4]. Maraging steels were found to be less susceptible to hydrogen embrittlement than common high strength steels due to significantly low diffusion of hydrogen in them [5]. Bellanger et al. [6] have studied the effect of slightly acid pH with or without chloride in radioactive water on the corrosion of maraging steel and have reported that corrosion behaviour of maraging steel at the corrosion potential depends on pH and intermediates remaining on maraging steel surface in the active region favouring the passivity. Here an attempt has been made to study the corrosion behaviour of welded maraging steel in different concentrations of hydrochloric acid at different temperatures.
Experimental
Preparation of specimen
The corrosion tests were performed with specimen of welded maraging steel (18% Ni M250 grade). Percentage composition of 18% Ni M250 grade maraging steel sample is given in Table 1.

The maraging steel plate was welded by GTAW-DCSP, by using filler material of composition as given in Table 2.

The working electrode was in the form of a rod machined into a cylindrical form embedded in epoxy resin leaving an open surface area of 0.646 cm2. This coupon was abraded as per standard metallographic practice, belt grinding followed by polishing on emery papers of different grades, finally on polishing wheel using legated alumina abrasive to obtain mirror finish, degreased with acetone and dried before immersing in the medium.
Test solution
Analytical grade of hydrochloric acid and doubly distilled water were used for preparing the test solutions having concentrations 0.1 M, 0.5 M, 1 M, 1.5 M and 2 M. Experiments were carried out in a calibrated thermostat at temperatures of 30 °C, 35 °C, 40 °C, 45 °C and 50 °C (±0.5 °C).
Potentiodynamic polarization studies
Electrochemical analyses were performed in a conventional three-electrode system by using an electrochemical work station, Gill AC having ACM instrument Version 5 software. Tafel plot measurements were carried out using a conventional three electrode Pyrex glass cell with a platinum foil as counter electrode and a saturated calomel electrode as reference electrode. Finely polished welded maraging steel sealed by epoxy resin with exposure surface of 0.646 cm2 as working electrode was exposed to corrosion medium of different concentrations of hydrochloric acid (0.1 M to 2.0 M) at different temperatures (30 °C to 50 °C) for 30 minutes and allowed to establish a steady state open circuit potential. The potentiodynamic current-potential curves were recorded by polarizing the specimen to -250 mV cathodically and +250 mV anodically with respect to the open circuit potential (OCP) at a scan rate of 1 mV s-1.
Electrochemical impedance spectroscopy studies (EIS)
Electrochemical impedance spectroscopy (EIS), which gives early information about the electrochemical processes, at the metal solution interface, has been used in many reports on the corrosion studies [7]. EIS measurement was carried out on steady open circuit potential (OCP), disturbed with an amplitude of 10 mV ac sine wave at frequencies from 100 KHz to 10 mHz; and the impedance data were analyzed using Nyquist plots. The charge transfer resistance, Rct was extracted from the diameter of the semicircle in Nyquist plot. In all the above measurements, at least three similar results were considered and their average values are reported.
The scanning electron microscope images were recorded to establish the interaction of acid medium with the metal surface using a JEOL JSM-6380LA analytical scanning electron microscope.
Results and discussion
Tafel polarization measurements
The effect of hydrochloric acid concentration and solution temperature on the corrosion rate of welded samples of maraging steel was studied using Tafel polarization technique. The anodic and cathodic current-potential curves are extrapolated up to their intersection at the point where the corrosion current density (icorr) and the corrosion potential (Ecorr) are obtained [8]. The potentiodynamic polarization curves for the corrosion of welded maraging steel in different concentrations of HCl at 40 °C are represented in Fig. 1.
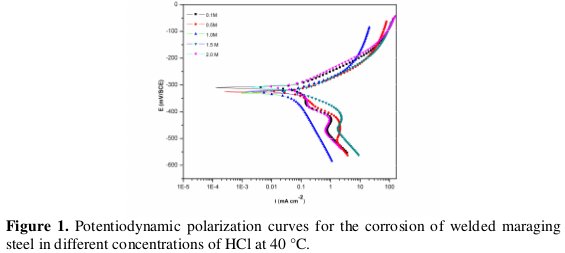
Similar plots were obtained at other temperatures also. It is seen from the Fig. 1 that the polarization curves are shifted to the high current density region as the concentration of HCl is increased, indicating the increase in the corrosion rate with the increase in HCl concentration.
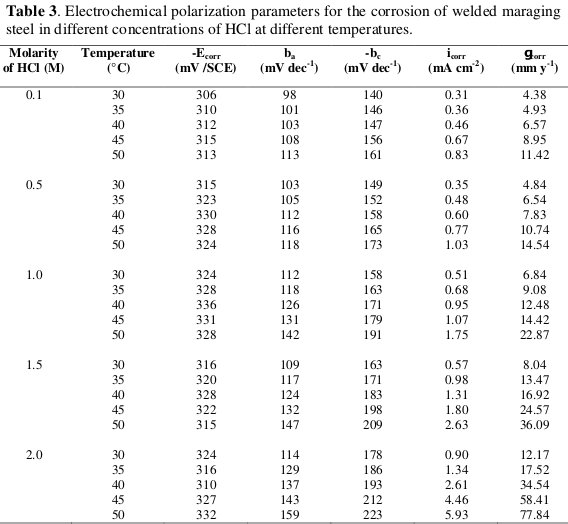
The potentiodynamic polarization parameters like corrosion potential (Ecorr), corrosion current (icorr), anodic and cathodic slopes (ba and bc) and corrosion rate (νcorr) were calculated from Tafel plots and are tabulated in Table 3.
The corrosion rate was calculated using Equation 1:

where 3270 is a constant that defines the unit of corrosion rate, icorr is the corrosion current density in A cm-2, ρ is the density of the corroding material, 8100 kg m-3, M is the atomic mass of the metal, and Z is the number of electrons transferred per metal atom [9].
From the data summarized in Table 3 it is evident that the corrosion rate of welded maraging steel specimen increases with the increase in the concentration of hydrochloric acid in the solution.
It is also observed from the results that the corrosion potential is shifted towards less negative values as the concentration of hydrochloric acid is increased.
The corrosion of steel normally proceeds via two partial reactions in acid solutions. The partial anodic reaction involves the oxidation of metal and formation of soluble Fe2+ ions, while the partial cathodic reaction involves the evolution of hydrogen gas [10].
In hydrochloric acid, the following mechanism is proposed for the corrosion of iron [11]. According to this mechanism anodic dissolution of iron takes place as follows (Eq. 2):

In a cathodic reaction, hydrogen evolution takes place as follows (Eq. 3):

Electrochemical impedance spectroscopy
The Nyquist plots for the corrosion of the specimen in solutions of different concentrations of acid and at 40 °C are shown in Fig. 2.
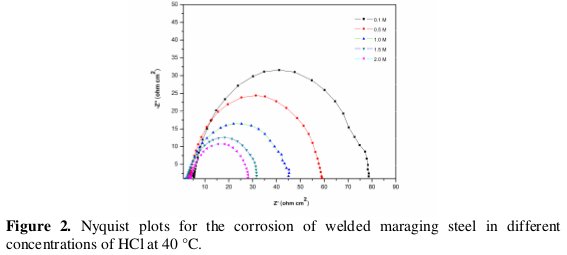
Similar plots were obtained at other temperatures also. The impedance diagrams have an approximately semicircular appearance, with small distortions. The point where the semi-circle of the Nyquist plot intersects the real axis at high frequency (close to the origin) yields solution resistance (Rs). The intercept on real axis at the other end of the semicircle (low frequency) gives the sum of solution resistance and the charge transfer resistance (Rct). Hence the charge transfer resistance value is simply the diameter of the semicircle [12]. The diagonal region between the high frequency and low frequency region has a negative slope due to the capacitive behaviour of the electrochemical double layer. The corrosion current density is calculated using the Stern Geary Equation (Eq. 4):

From Fig. 2 it is clear that the diameter of the semicircle decreases with the increase in the concentration of HCl, indicating the decrease in Rct value and increase in corrosion rate. The fact that impedance diagrams have semicircular appearance shows that the corrosion of weld aged maraging steel is controlled by a charge transfer process and the mechanism of dissolution of metal in HCl is not altered with the change in the HCl concentration [14]. As seen from the figure, the Nyquist plots are not perfect semicircles. The deviation has been attributed to frequency dispersion [15,16]. The depressed semicircles have a centre under the real axis, and can be seen as depressed capacitive loops. Such phenomena often correspond to surface heterogeneity which may be the result of surface roughness, dislocations, distribution of the active sites or adsorption of molecules [17].
The results obtained can be interpreted in terms of the equivalent circuit of the electrical double layer shown in Fig. 3.
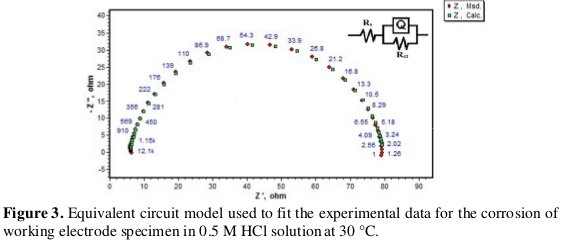
The circuit fitment was done by ZSimpWin software of version 3.21. In the equivalent circuit, Rs represents the solution resistance and Rct the charge transfer resistance. The constant phase element (Qdl) is substituted by the capacitive element to give a more accurate fit, as most capacitive loops are depressed semi circles rather than regular semi circles [18].
The impedance of constant phase is given by the expression:

where Y0 is a proportional factor, n has the meaning of a phase shift and j = (-1)1/2. The value of double layer capacitance (Cdl) can be obtained from the equation

where, w is the frequency at which the imaginary part of the impedance has its maximum [18]. The results of EIS measurement are summarized in Table 4.
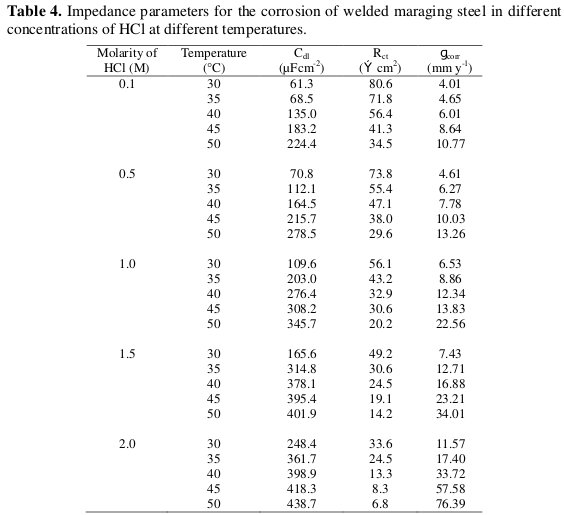
The results show that the charge transfer resistance (Rct) value decreases and the double layer capacitance (Cdl) increases with the increase in the concentration of hydrochloric acid. The Nyquist plots obtained in the real system represent general behaviour where the double layer on the interface of metal/solution does not behave as a real capacitor. On the metal side electrons control the charge distribution whereas on the solution side it is controlled by ions. As ions are much larger than the electrons, the equivalent ions to the charge on the metal, will occupy quite a large volume on the solution side of the double layer.
Increase in the capacitance, which can result from an increase in local dielectric constant and/or a decrease in the thickness of the electrical double layer, suggests that the chloride molecules act by adsorption at the metal/solution interface [19].
Effect of temperature
The effect of temperature on the corrosion rate of welded maraging steel was studied by measuring the corrosion rate at different temperatures between 30 °C - 50 °C. Fig. 4 and Fig. 5 represent the potentiodynamic polarization curves and Nyquist plots, respectively, at different temperatures for the corrosion of welded maraging steel sample in 1 M HCl solution.
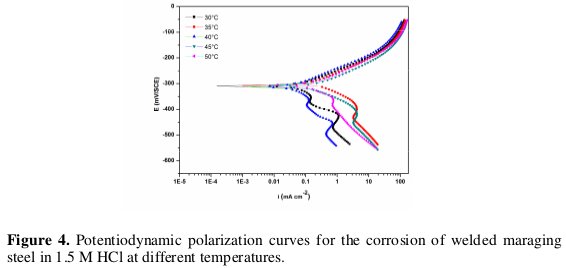
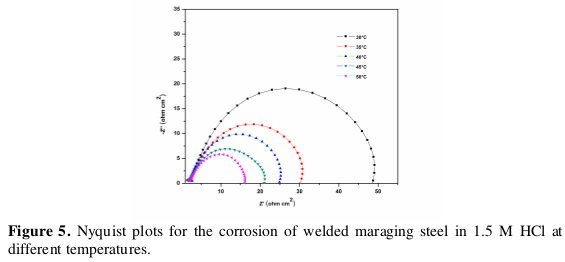
Similar plots were obtained in other concentrations of solutions also. The Tafel polarization results and EIS results at different temperatures are listed in Tables 3 and 4, respectively. From the Figs. 4 and 5 and from the results in Tables 3 and 4 it is seen that the corrosion rate increases with the increase in temperature. This may be attributed to the fact that the hydrogen evolution over potential decreases with the increase in temperature that leads to the increase in cathodic reaction rate [20]. The values of bc and ba change with the increase in acid concentration and also with the increase in temperature, which indicates the influence of the acid concentration and temperature on the kinetics of hydrogen evolution and metal dissolution.
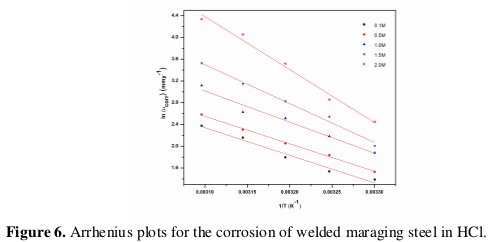
Activation energy (Ea) for the corrosion process of welded maraging steel in hydrochloric acid was calculated from the Arrhenius equation (Eq. 7) [3,4]:

where B is a constant which depends on the metal type, and R is the universal gas constant. The plot of ln(νcorr) versus reciprocal of absolute temperature (1/T) gives a straight line whose slope = -Ea / R, from which the activation energy values for the corrosion process were calculated. The Arrhenius plots for the weld aged specimen are shown in Fig. 6.
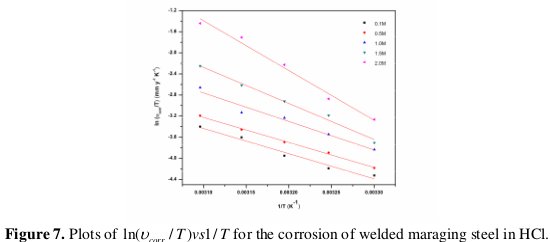
The enthalpy and entropy of activation (ΔH# & ΔS#) were calculated from transition state theory (Eq. 8) [21] and these values are tabulated in Table 5.


where h is Planck's constant, N is Avogadro's number and R is the ideal gas constant. A plot of ln(νcorr/T) versus 1/T gives a straight line with slope = -ΔH#/R and intercept = ln(R/Nh) + ΔS#/R. The plots of ln(νcorr /T) versus 1/T for the corrosion of welded maraging steel in different concentrations of hydrochloric acid are shown in Fig. 7.
The activation parameters calculated are listed in Table 5.
The activation energy values indicate that the corrosion of the alloy is controlled by surface reaction, since the values of activation energy for the corrosion processes are greater than 20 kJ mol-1 [22]. The entropy of activation is negative. This implies that the activated complex in the rate-determining step represents association rather than dissociation, indicating that a decrease in randomness takes place on going from reactants to the activated complex [19].
SEM and EDS examinations of the electrode surface
The scanning electron microscope images were recorded to establish the interaction of acid solution with the metal surface. The SEM image of a freshly polished surface of welded maraging steel sample is given in Fig. 8(a), which shows the uncorroded surface with a few scratches due to polishing.
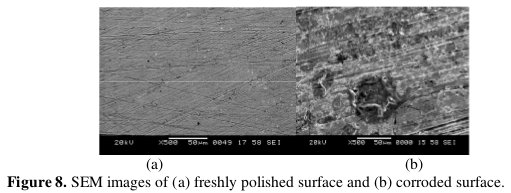
Fig. 8(b) shows the SEM image of welded maraging steel surface after immersed for 3 h in 2.0 M HCl. The SEM images reveal that the specimen not immersed in the acid solutions is in a better condition having a smooth surface, while the metal surface immersed in 2.0 M HCl is deteriorated due to the acid action. The corroded surface shows detachment of particles from the surface.
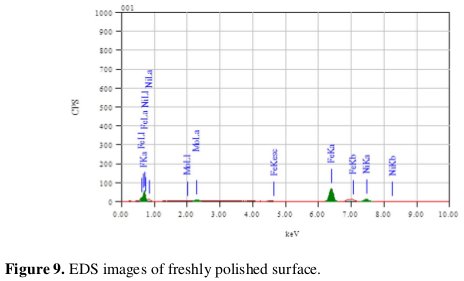
EDS survey spectra were used to determine which elements were present on the specimen surface before and after exposure to the acid solution. Fig. 9 reveals that fresh surface of the specimen with intense peak of Fe.
The spectrum of Fig. 10 shows that the Fe peaks are considerably suppressed relative to the fresh specimen and the appearance of Cl peak.
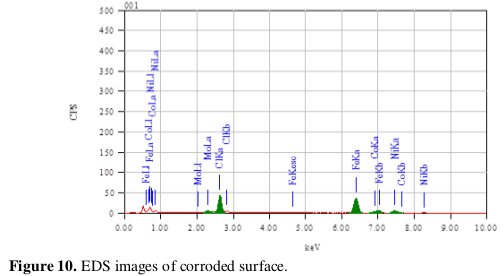
The suppression of the Fe lines indicates that the specimen has undergone corrosion in the presence of the corrosive medium. The presence of Cl peak supports the participation of chloride ions in the corrosion reaction as suggested in the mechanism.
Conclusions
From the above results and discussion, the main conclusions can be summarized in the following points:
1. The corrosion rate of welded maraging steel specimen in hydrochloric acid medium is substantial and it was found that Rct value decreases while both Cdl and icorr values increase with increasing HCl concentration.
2. The corrosion rate of the working electrode is influenced by temperature and concentration of hydrochloric acid medium. The corrosion rate of the specimen under investigation increases with increase in solution temperature and concentration of hydrochloric acid.
3. The corrosion kinetics follows Arrhenius law.
4. The results obtained from Tafel polarization curves and electrochemical impedance spectroscopy are in reasonable agreement.
References
1. Stiller K, Danoix F, Bostel A. Appl Surf Sci. 1996;94:326. [ Links ]
2. Adama CM, Travis RE. Weld J. 1964;43:193. [ Links ]
3. Poornima T, J Nayak, Shetty AN. Int J Electrochem Sci. 2010;5:56.
4. Poornima T, J Nayak, Shetty AN. Int J Electrochem Sci. 2011;41:223.
5. Rezek J, Klein IE, Yhalom J. Corros Sci. 1997;39:385. [ Links ]
6. Bellanger G, Rameau JJ. J Nucl Mater. 1996;228:24. [ Links ]
7. Bellanger G. J Nucl Mater. 1994;217:187. [ Links ]
8. Khaled K. Electrochim Acta. 2003;48:2493. [ Links ]
9. Fontana MG. Corrosion engineering. 3rd ed. Singapore: McGraw Hill; 1987. P. 173. [ Links ]
10. Kriaa A, Hamdi N, Jbali K, Tzinmann M. Corros Sci. 2009;51:668. [ Links ]
11. Kumar SA, Quraishi MA. Corros Sci. 2010;52:152. [ Links ]
12. Mansfeld F. Electrochim Acta. 1990;35:1533-1544. [ Links ]
13. Prabhu RA, Venkatesha TV, Shanbhag AV et al. Corros Sci. 2008;50:3356. [ Links ]
14. EL-Sayed A. J Appl Electrochem. 1997;27:89. [ Links ]
15. Amin AM, Khaled KF, Mohsen Q. Corros Sci. 2010;52:1684. [ Links ]
16. Mansfeld F, Kendig MW, Tsai S. Corrosion. 1982;38:570. [ Links ]
17. Larabi L, Harek Y, Traisnel M, Mansri. J Appl Electrochem. 2004;34:833. [ Links ]
18. Li WH, He Q, Zhang ST et al. J Appl Electrochem. 2008;38:289. [ Links ]
19. Tang Y, Chen Y, Yang W. J Appl Electrochem. 2008;38:1553. [ Links ]
20. Prabhu RA, Shanbhag AV, Venkatesha TV. J Appl Electrochem. 2007;37:491. [ Links ]
21. Abd Ei-Rehim SS, Ibrahim MAM, Khaled KF. J Appl Electrochem. 1999;29:593. [ Links ]
22. Bouklah M, Hammouti B, Benkaddour M, Benhadda T. J Appl Electrochem. 2005;35:1095. [ Links ]
*Corresponding author. E-mail address: nityashreya@gmail.com
Received 19 October 2012; accepted 23 January 2013


