Serviços Personalizados
Journal
Artigo
Indicadores
-
 Citado por SciELO
 -
 Acessos
Links relacionados
-
 Similares em
SciELO
Compartilhar
Portugaliae Electrochimica Acta
versão impressa ISSN 0872-1904
Port. Electrochim. Acta vol.31 no.2 Coimbra mar. 2013
https://doi.org/10.4152/pea.201302119
Azo Dye Compounds as Corrosion Inhibitors for Dissolution of Mild Steel in Hydrochloric Acid Solution
A.M. Nagiub1, M.H. Mahross1, H.F.Y. Khalil2, B.N.A. Mahran3, M.M. Yehia3 and M.M.B. El-Sabbah2,*
1 Chemistry Department Faculty of Science, Al-Azhar University, Assiut , Egypt
2 Chemistry Department Faculty of Science, Al-Azhar University, Nasr City, Egypt
3 Laboratory for Environment Quality Monitoring, National Water Research Center, Egypt
Abstract
The effect of some mono-,bis -and tris-azo dyes compounds on the dissolution of mild steel in 1.0 M HCl solution was studied using weight loss and potentiodynamic polarization measurements. The inhibition efficiency was found to increase with increasing concentration of the inhibitors and with decreasing temperature. The adsorption of different azo dyes on the mild steel surface obeys the Langmuir adsorption isotherm. Polarization studies indicate that the compounds used are mixed type inhibitors. The thermodynamic functions of adsorption processes were calculated from weight loss at different temperatures data and were used to analyze the inhibitor mechanism. The surface morphology of the mild steel specimens was evaluated using SEM and EDAX analysis. To provide an evidence for the formation of the complex, UV-VIS spectra of solutions were investigated. From previous results (I.E.%, ΔGads, SEM, EDAX and UV-VIS spectra) are likely to get into the possiblity of configure the complex on the mild steel surface.
Keywords: azo dyes, mild steel, inhibitors, surface morphology.
Introduction
Mild steel is an alloy of iron, which undergoes corrosion easily in acidic medium. Acidic solutions are extensively used in chemical laboratories and in several industrial processes such as acid pickling, acid cleaning, acid descaling and oil wet cleaning, etc. Also mild steel is used under different conditions in chemical and allied industries for handling alkaline, acid and salt solutions.
Inhibitors are often added in industrial processes to secure metal dissolution from acid solutions. Authors show that organic compounds containing O, S and/or N atoms act as effective inhibitors [1-3]. These organic compounds adsorb on metallic surface and then decrease the corrosion rate [4-7]. It has been observed that adsorption depends mainly on certain physico-chemical properties of the inhibitor group, like functional groups, electron density at the donor atom, π-orbital character, and the electronic structure of the molecule [8-10]. Azo compounds are the most widely used class of dyes due to their versatile application in various fields, such as the dyeing of textiles, and fibbers, to coloring of different materials, and high-technology areas, such as eletro-optical devices and ink-jet printers. Some studies have shown that the inhibition of the corrosion by organic dyes is mainly attributed to the formation of complex compounds between the metal-ions and the nitrogen of azo binding at the electrode surface [11-38].
The objective of this study is to investigate the corrosion behavior of mild steel in 1.0 M HCl at different temperatures in the presence of some mono-,bis -and tris-azo dyes compounds by using weight loss, polarization resistance and Tafel polarization. The effects of temperature were also studied.
Experimental
Materials
The mild steel specimens tested in the present study are in the form of sheet; the designation and analysis of the material is given in Table (1).

Before immersion the obvious electrodes in the test solution each of them is prepared by polishing with emery paper from 250 to 1200 grade to obtain a smooth surface, washed with distilled water and then degreased with acetone about 5 minutes, washed again with distilled water, then dried using filter papers.
Selection and assessment of dyes used
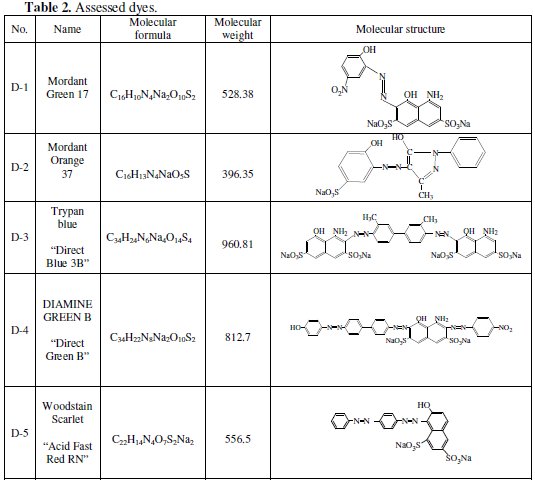
In the present work, some selected dyes were used to determine if there is a parallel structure-corrosion inhibition relationship for the corrosion of Fe in the acidic solution, and different concentrations of dyes at different temperatures. Characteristics of the dyes used are listed in Table (2).
Adopted techniques
Weight loss measurements
Weight loss measurements were carried out by weighing the mild steel specimens before and after immersion in 500 cm3 acid solutions for different time intervals in the presence and absence of various concentrations of dyes. Experiments were also performed at temperature range (298-328 K) in 1.0 M HCl solutions. Duplicate experiments were performed in each case and the mean value of the weight loss was determined.
Open circuit potential measurements (OCP)
The potential of the mild steel electrode (working electrode) was measured against a saturated calomel electrode (SCE) (reference electrode) in 1.0 M HCl solution in absence and presence of different concentrations of the inhibitor.
Potentiodynamic polarization measurements
The electrochemical cell used in potentiodynamic polarization consists of three electrodes: working electrode (mild steel), reference electrode (saturated calomel electrode (SCE)) and platinum wire used as counter electrode. The exposed area of the working electrode to solution was (1 cm2). For the anodic and cathodic potentiodynamic polarization (Tafel plots) the entire potential scan was programmed to take place within ±250 mV of the corrosion potential. The measurements were conducted at scanning rate of 0.2 mV/s.
Surface examinations techniques:
I-Scanning Electron Microscope (SEM)
The scanning electron microscope (SEM) is a type of electron microscope giving images of the sample surface by scanning it with a high-energy beam of electrons in a raster scan pattern. SEM images should confirm the electrode surface. The specimens have been rinsed before and after immersion in different solutions.
II-Energy Dispersive X-ray Analysis (EDAX)
EDAX is an analytical technique used for the elemental analysis or chemical characterization of a sample. The identification of the elements present in the surface of the specimens before and after immersion in different solutions will be performed using an energy dispersion X-ray analysis. This technique is used in conjunction with SEM.
Results and discussion
Weight loss measurements
Weight loss of mild steel electrode was determined at various time intervals in absence and presence of different concentrations of mono-,bis-and tris azo-dyes. It is obvious that the weight-loss of mild steel electrode in the presence of different azo-dyes (D-1--D-5) varies linearly with time, being much lower than that obtained in blank solution. The linearity obtained indicates the absence of insoluble surface film during corrosion and the inhibitors were fast adsorbed onto the metal surface and, therefore, impeding the corrosion process [39]. The corrosion rate (C.R.), the inhibition efficiency (IE %) and the surface coverage (θ), that represent the weight of metal surface covered by inhibitor molecules, were calculated using the following equations:


where (C.R.)free and (C.R.)inh are the corrosion rate in the absence and presence of inhibitors, respectively. The calculated values of (C.R.), I.E. % and θ for different inhibitors at 25 °C are listed in Table (3).
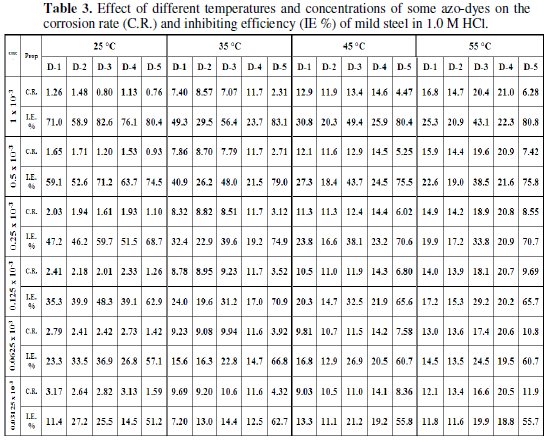
Figure (1) gives the evaluation of I.E. % of mild steel electrode as a function of concentrations of different inhibitors.
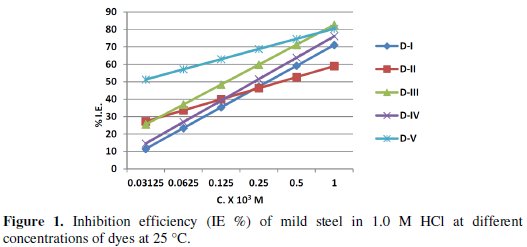
Inspection of the tabulated data and Fig. (1) revealed that the inhibition efficiency increases with an increase in inhibitor concentration. This behavior could be the attributed to increase of the number of adsorbed molecules at the metal surface [40].
The inhibition action of different inhibitors can be explained by considering the following mechanism, where Fe (Inh)ads. is the intermediate [41]:

At first, when there is not enough Fe (Inh)ads. to cover the metal surface, because the inhibitors concentration is low or because the adsorption rate is slow, metal dissolution takes place in sites on the mild steel surface free of Fe (Inh)ads. With high inhibitor concentration, a compact and coherent inhibitor over filmed is formed on the mild steel which reduces chemical attacks on the metal.
The values of the corrosion rate and inhibition efficiency for the different azodyes, Table 3 and Fig. (1), revealed that the decrease in corrosion rate and the increase in the inhibition efficiency are more significant for bis-and tris-azo compounds (D-3, D-4 and D-5), than the mono-azo ones (D-1 and D-2). This may be due to the larger size of bis-and tris-molecules as compared with that of the mono-azo ones, which allows covering more surface area of the metal. The decrease of the corrosion rate and increase of the inhibition efficiency follow the sequence:
D-3(bis) > D-5(bis) > D-4(tris) > D-1(mono) > D-2(mono)
Effect of temperature
Values of C.R.,I.E.% and θ of mild steel determined in 1.0 M HCl solution in absence and in presence of different concentrations of each of the under testing azo-dyes at different temperatures(25-55 oC) are tabulated in Table (3). The data recorded indicated that the rate of corrosion of mild steel in 1.0 M HCl decreases with increase in the concentration of the inhibitor at all the temperatures studied and decreases with increase in temperature. Decrease in inhibition efficiency with the increase of the temperature may be attributed to increase in the solubility of the protective films and of any reaction products precipitated on the surface of the metal that may otherwise inhibit the reaction. Ergun et al. [42] have attributed the inhibition efficiency decrease with rise in temperature to be due to an enhanced effect of temperature on the dissolution process of steel in acidic media and / or the partial desorption of the inhibitor from the metal surface.
Adsorption consideration
In order to get a better understanding of the adsorption mode of the inhibitor on the metal surface, the data were tested graphically by fitting them to various isotherms to find the best isotherm which describes this study. The value of correlation coefficient (R2) was used to determine the best fit isotherm. Langmuir adsorption isotherm was found to fit well the experimental data. According to this isotherm, θ is related to the C and adsorption equilibrium constant Kads., via the following equation [43]:

Using equation (3), plots of log (C/θ) versus C gave straight lines Fig. (2), with a slope of around unity confirming that the adsorption of different azo-dyes on mild steel surface in hydrochloric acid solution obeys the Langmuir adsorption isotherm at 25 °C (similar data are obtained at different temperatures).
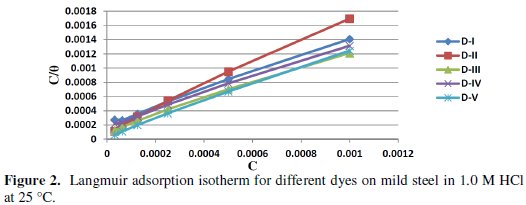
The values of Langmuir adsorption parameters obtained from the plots are recorded in Table (4).
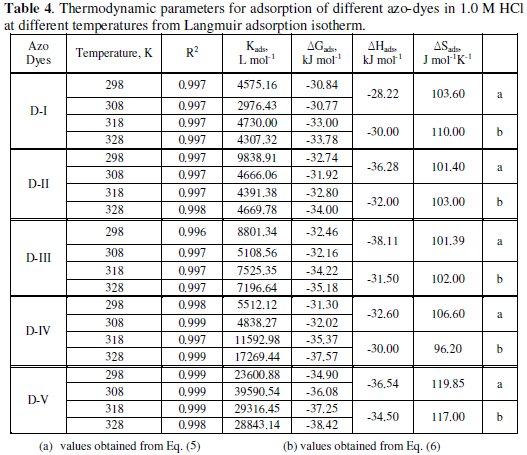
The results show that the slopes and R2 values are very close to unity indicating strong adherence of the adsorbed inhibitors to the assumptions of Langmuir [44].
The equilibrium constant of adsorption obtained from the slopes of the Langmuir isotherms was used to calculate the free energy for the adsorption of different azo-dyes on the surface of mild steel. The free energy of adsorption of different azo-dyes on the metal surface is related to the equilibrium constant of adsorption according to equation (4):

where R is the universal gas constant , ΔGads. is the free energy of adsorption and 55.5 is the concentration of water in solution (mol L-1) [45].
The enthalpy and entropy of adsorption (ΔHads. and ΔSads. ) can be calculated using equation (5):

Using equation (5), the values of ΔHads. and ΔSads. were evaluated from the slope and intercept of plot ln Kads. versus 1 / T, Fig. (3).
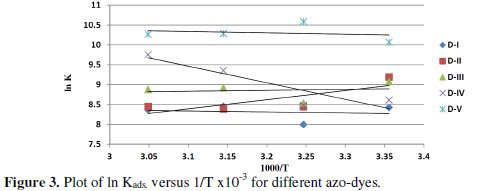
The values of ΔGads. , ΔHads. and ΔSads. are listed in Table (4).
From the results, it is significant to note that the calculated values of ΔGads. are negative indicating that the adsorption is a spontaneous process. Generally, the values of ΔGads. around -20 KJ moL-1 or lower are consistent with the electrostatic interaction between charged molecules and the charged metal surface (physisorption), while those around -40 KJ moL-1 or more negative involve chemisorption [46]. In the present study, the values of ΔGads. ranged from (-30.84 to -33.78), (-32.74 to -34.00), (-32.46 to -35.10), (-31.30 to -37.57) and (-34.90 to -38.42) for D-1 to D-5, respectively, at temperatures ranged from (25 to 55 °C), which probably means that both physisorption and chemisorption are taking place.
The values of ΔGads are positive in the adsorption process and this could be explained as follows:
An adsorption isotherm describes the equilibrium between the concentration of certain species in the phase in which it is present and in the metal-electrolyte phase. So, adsorption equilibrium can be written as:

where ORG is the organic compound adsorbed and deadsorbed at the same speed on the metal surface. The adsorption phenomenon occurs in an aqueous solution containing the organic compound [ORG (aq)]. This involves the displacement of a certain number of water molecules (χ) by the organic compound which is adsorbed on the electrode surface [H2O (ads)].
Ateya et al. [48] described this situation as the adsorption of the organic compound which is accompanied by the desorption of water molecules from the surface. Thus, while the adsorption process is believed to be exothermic and associated with a decrease in entropy of the solute, the opposite is true for the solvent. Therefore the gain in entropy that accompanies the substantial adsorption process is attributed to the increase in solvent entropy. The values of ΔHads provide further information about the mechanism of corrosion inhibition. The endothermic adsorption process is ascribed unambiguously to chemisorption and an exothermic process may involve either physisorption or chemisorption or a combination of both [49]. In the present study, the obtained negative values of ΔHads indicate a combination of both physisorption and chemisorption processes.
The values of ΔHads and ΔGads can also be calculated by using the following equation [37]:

Using equation (6), the plot of ΔGads. versus T gives a straight line (Fig. (4)) with a slope of -ΔGads and intercept of ΔHads..
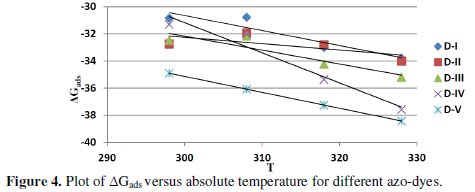
The values obtained are well correlated with those obtained from equation (5).
Thermodynamic consideration
To investigate the mechanism of inhibition and to determine the activation energy of the corrosion process, weight loss of mild steel in 1.0 M HCl was determined at various temperatures (298-328 K) in the absence and presence of different concentrations of azo-dyes compounds.
In an acidic solution the corrosion rate is related to temperature by the Arrhenius equation [50]:

where (C.R.) is the corrosion rate, Ea is the apparent activation energy, R is the molar gas constant, T is the absolute temperature and A is the frequency factor.
Figure (5) shows the plot of log C.R. versus 1/T.
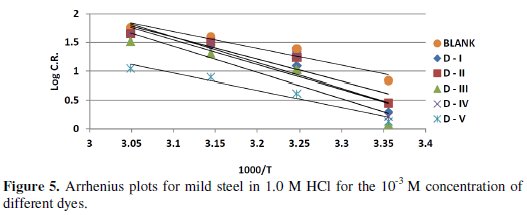
Linear plots were obtained for different azo-dyes compounds. The values of Ea were computed from the slope of the straight lines and are listed in Table (5).
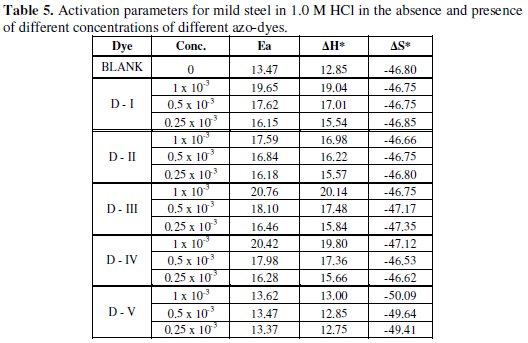
It is clear from this table that Ea values in presence of the azo-dyes are higher than in their absence. Inspection of these data reveals that the apparent activation energy Ea in HCl in the absence of azo dye compounds was 13.47 kJ /moL-1.
Low activation energy means fast reaction, and high activation energy means slow reaction. High activation energy corresponds to a reaction rate that is very sensitive to temperature. Conversely small activation energy indicates a reaction rate that varies only slightly with the temperature. If reaction has zero activation energy, its rate is independent of temperature. In some cases, activation energy (Ea) is found to be negative, which indicates that the rate decreases when temperature is raised and such behaviour is a signal that the reaction has a complex mechanism [30,51].
Enthalpy and entropy of activation ΔH* and ΔS* were obtained by applying the transition state equation:


where h is the Plank's constant, N is the Avogadro's number, T is the absolute temperature and R is the universal gas constant. Plots log[C.R./T] as a function of 1/T were made in Fig. (6).
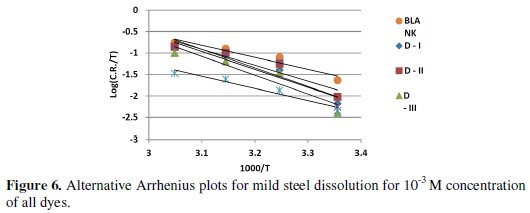
Straight lines were obtained with a slope of (-ΔH*/ RT) and an intercept of log[R/Nh] + (ΔS*/ R), being the values of ΔH* and ΔS* calculated, and listed in Table (5). While an endothermic adsorption process (ΔH* > 0) is attributed unequivocally to chemisorption, an exothermic adsorption process (ΔH* < 0) may involve either physisorption or chemisorption or a mixture of both processes [50]. In the present work, the positive sign of the activation enthalpy (ΔH*) reflects the endothermic nature of the steel dissolution process and that the dissolution of steel is difficult. The order of the phenomena ascribed by the negative values of (ΔS*), may probably be explained by the possibility of the formation of iron complex on the metal surface [17].
Electrochemical techniques
Open Circuit Potential measurements
The open-circuit potential (OCP) for mild steel as a function of time in 1.0 M HCl in absence and in the presence of different concentrations of all under testing azo-dyes are studied.
As revealed from inspection of curves, Fig. (7), the potential of the mild steel electrode is measured directly after immersion as the steady state potential varies with different concentrations of the used azo-dyes solutions (1.0 × 10⁻³ -0.125 × 10⁻³).
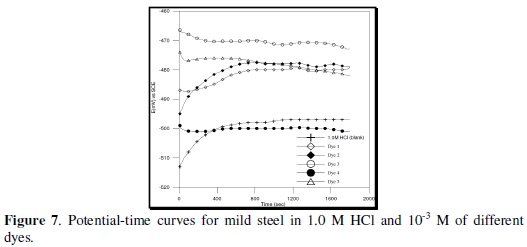
In almost all azo-dye compounds, there is always a general tendency for the OCP to drift with time towards more stable values at which it tends to be stabilized after 30 minutes.
Accordingly, the behavior can be classified into two different behaviors depending upon the mode of the variation of the steady state potentials with time and concentration of the test solutions.
In the first behavior which is represented by the potential time curves of mild steel electrode in 1.0 M HCl containing different concentrations of D-1, D-2, D-3 and D-5, there is always a general tendency for the immersion potential (Eim) to shift from negative to the positive direction. The values of steady state potential (Ess) in this case are higher than the value in free acid.
The second behavior, on the other hand, belongs to the azo-dye D-4 (which contains tris azo-group) where the values of steady state potential are lower than the value in free HCl solution. This behavior indicates that the first adsorbed molecules of the inhibitors are attached to the most active anodic sites. In contrast to some azo-dyes, there is some inhibition of the cathodic reaction probably due to steric hindrance of the combination of the adsorbed hydrogen atoms to form molecules.
Potentiodynamic polarization measurements
Figure (8) represents linear and Tafel polarization curves of 1.0 M HCl in 10-3 M of different studies of dyes at room temperature.
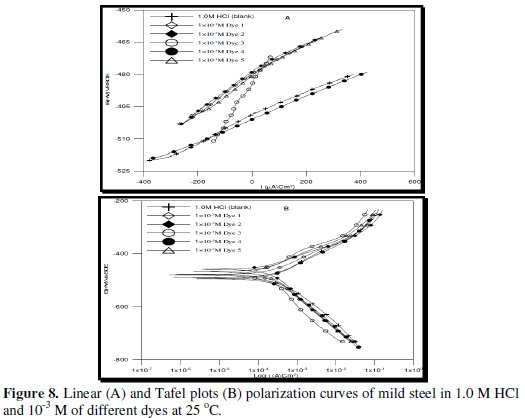
The corrosion kinetic parameters are tabulated in Table (6), showing that the polarization resistance (Rp), Tafel slopes constants (βa, βc), corrosion potential (Ecorr), corrosion current density (Icorr), corrosion rate (C.R.) and inhibition efficiencies (I.E.%) are function of the concentration of different azo-dyes.
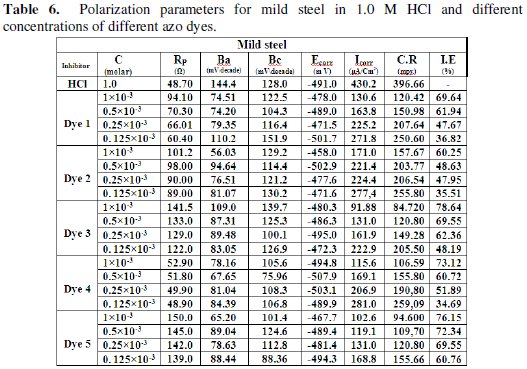
An inspection of the results presented in Fig. (8) and Table (6) reveals that increasing the concentration of the additive dyes shows the following:
(i) It is clear that different dyes shifted both anodic and cathodic branches of polarization curves to lower values of current density indicating that all dyes act as mixed type inhibitors. The addition of different dyes to HCl solution reduces the anodic dissolution of mild steel and also retards the cathodic hydrogn evolution reaction.
(ii) The corrosion potential (Ecorr) shifted slightly to more positive values while the corrosion current (Icorr) decreases with increasing the inhibitor concentration, indicating the inhibiting effect of these compounds.
(iii) The variable values of the cathodic Tafel slopes suggest that the inhibition action of such compounds occurs by simple blocking of the electrode surface area [52].
(iv) The obtained results indicated that azo-dyes compounds inhibit HCl corrosion of mild steel via their adsorption on both anodic and cathodic active sites without modifing the mechanism of corrosion reaction. This means that the adsorbed inhibitor molecules block the surface active sites and decrease the area available for hydrogn evolution and metal dissolution reactions [53].
(v) The (I.E.%) calculated was found to increase with increasing the azo-dyes concentrations.
The inhibition achieved by these compounds decreases in the following sequence:
D-3 > D-5 > D-4 > D-1 > D-2
It is of interest to note that the values of (I.E.%) given by polarization are somewhat different from those obtained by weight-loss measurements as shown in Table 7.
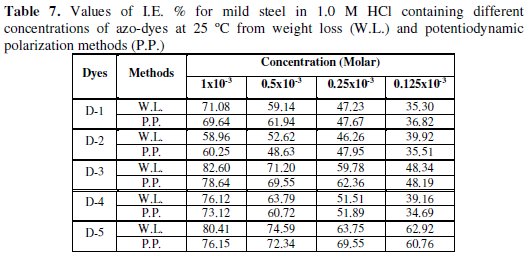
This difference can be attributed to the fact that the first method gives instantaneous corrosion rate, whereas the second method gives average corrosion rates.
This difference may also be expected to arise because of the difference in the time required to form an adsorbed layer of inhibitor on metal surface that can inhibit corrosion [54].
Surface morphology of the metal electrodes
The scanning electron microscope images and energy dispersive X-ray analysis further supported the formation of a surface film by the inhibitors and their interaction with surface atoms of mild steel.
Scanning Electron Microscope (SEM) analysis
Figure (9 A) illustrates the morphology of the surface of polished mild steel electrode before exposure to corrosion media (blank).
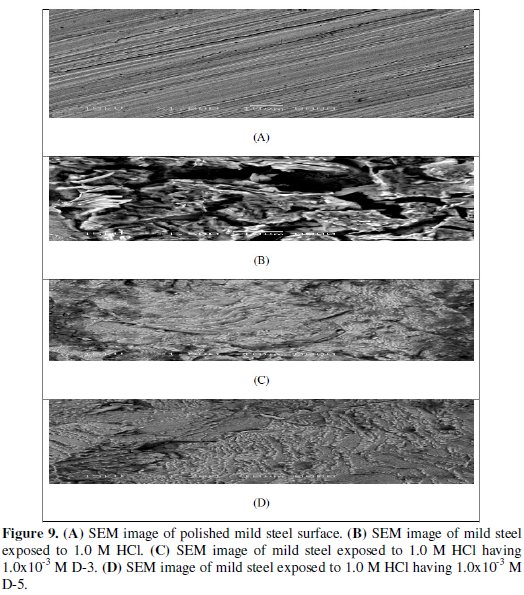
The specimens were subjected to microscopic examination at × 1000. The micrograph shows a characteristic inclusion, which was probably an oxide inclusion. Figure (9 B) shows SEM image of the surface of the studied mild steel electrode specimen after immersion in 1.0 M HCl solution for 24 h. The micrograph reveals that the surface was strongly damaged. The corroded areas are shown as black grooves in the specimen with gray and white zones, which correspond to the dandruff of iron oxide. It suggested an uncovered surface of metal electrode severally corroded. The highly oxidized phase has perhaps been formed in air when desiccated under no protection for the surface.
Figures (9 C and D) show SEM images for the surface of another mild steel specimen after immersion for the same time interval in 1.0 M HCl solution containing 1.0 × 10⁻³ M from both dyes D-3 and D-5. The micrograph reveals that the inhibited metal surface is smoother than the uninhibited surface, a good protective film present on the metal surface. This confirms the highest inhibition effeciency of the inhibitors.
Energy Dispersive X-ray analysis (EDAX)
It is important to take into consideration the percentage of the elements present on the surface of the mild steel.
The EDAX analysis of the surface reveals the presence of oxygen and iron, suggesting therefore the presence of iron oxide / hydroxide, Figs. (10 and 11).
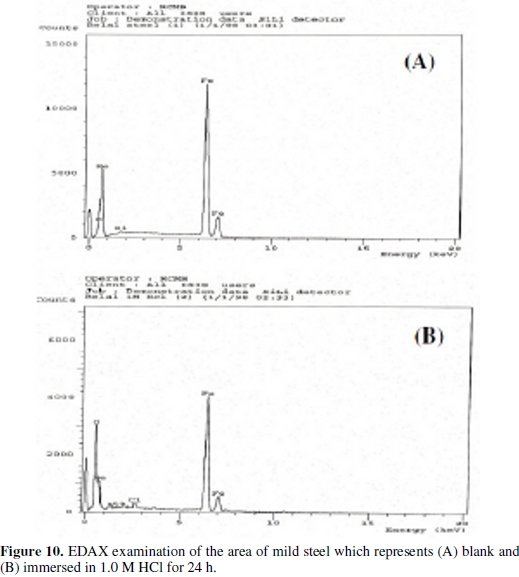
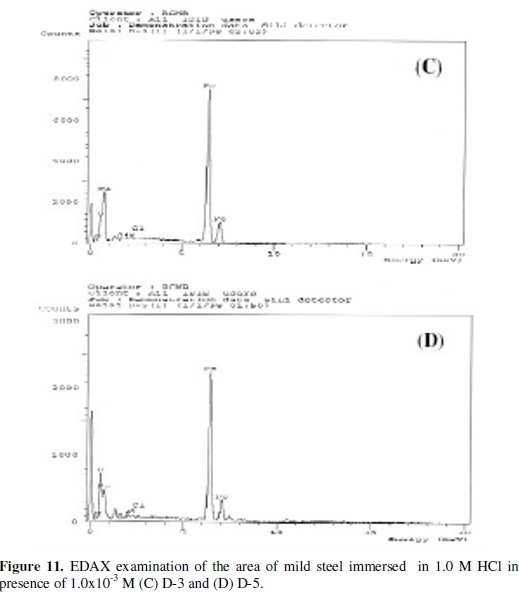
The presence of the peaks of carbon, nitrogen, chloride, silicon and sulphur is explained by the adsorption of the inhibitors [D-3, D-5 and beet root extract] on the products of corrosion of the mild steel.
Mechanism of inhibition
The inhibition action of mono-,bis-and tris-azodyes towards the corrosion of mild steel in 1.0 M HCl could be attributed to several factors including the structure, the number and types of adsorption sites, the nature of the molecule, the metal surface, and the ability to form complexes.
The results obtained in this study show the order of increase of I.E% of the compounds in solution and the extent of their ability to adsorb, hence protecting mild steel, as follows:
Bis-azodye D-3(82.6%) and D-5 (80.41%) > Tris-azodye D-4(76.12%) > Mono-azodye D-1(71.08%) and D-2 (60.25%)
The sequence may be attributed to the electronic structure of these compounds. The lone pairs of electrons on the S and N atoms are delocalized which stabilizes the compounds.
The inhibition mechanism of the azo compounds under investigation is believed to be as a result of the complex formation between Fe2+ and the azo compounds. The formed complex is adsorbed on the metal surface and thereby isolating the metal from further corroding attack.
To provide an evidence for the formation of the complex, UV-VIS spectra of solutions in presence of 1.0 M HCl and different under test azo dyes in absence (blank) and in presence of mild steel sample were investigated.
An inspection of the results presented in Fig.(12) and Table (8) reveals that the absorbance peaks in the visible region for all dyes decreased or disappeared after adsorption of the inhibitors on mild steel surface reducing the concentration of dyes.
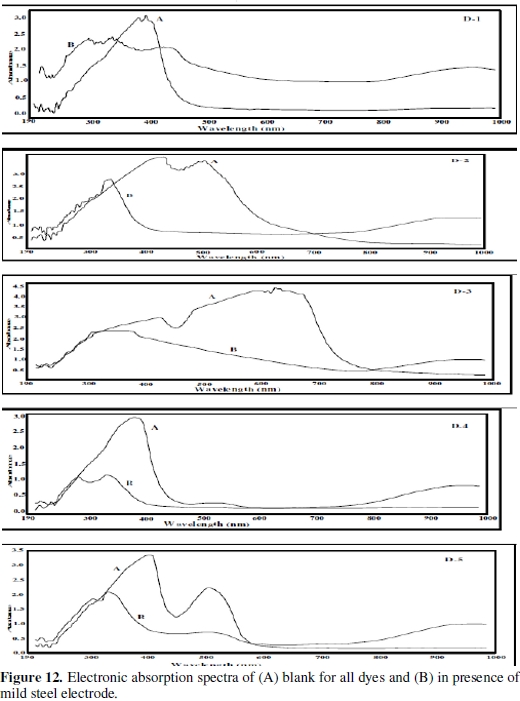
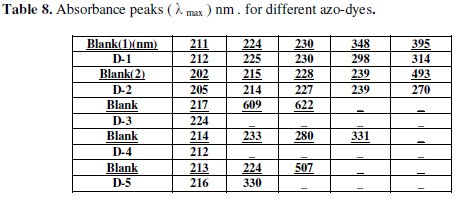
Additionally, there are two significant peaks at lower wavelengthes after addition of dyes to mild steel electrode, which may indicate a new structure unit formed and the degradation of the original structure under test dyes [55].
Previous results (I.E.%, ΔGads, SEM, EDAX and UV-VIS spectra) are likely to get into the possiblity of configure the complex on the mild steel surface (Table (9)).

Conclusions
1 - The corrosion of mild steel in 1.0 M HCl is inhibited by the addition of some mono-, bis-, and tris-azo dyes compounds.
2 - The inhibition efficiency increases with increase in the concentration of these compounds, but decreases with an increase in temperature.
3 - The adsorption of the azo dye compounds on the mild steel surface in acid solution obeyed Langmuir adsorption isotherm.
4 - The azo dye compounds influence both the cathodic and the anodic reactions in the HCl solution. This indicates that the additives act as mixed-type inhibitors.
5 - Previous results (I.E.%, ΔGads, SEM, EDAX and UV-VIS spectra) are likely to get into the possiblity of configure the complex on the mild steel surface.
References
1. Bouklah M, Benchat N, Aouniti A, et al. Prog Org Coat. 2004;51:118. [ Links ]
2. Chetouani A, Hammouti B, Aouniti A, et al. Prog Org Coat. 2002;45:373. [ Links ]
3. Morad MS. Mater Chem Phys. 1999;60:188. [ Links ]
4. Bilgic S. Mater Chem Phys. 2002;70:52. [ Links ]
5. Bentiss F, Traisnel M, Lagrenee M. Corros Sci. 2000;42:127. [ Links ]
6. Quraishi MA, Khan MAW, M. Ajmal M. et al. Corrosion 1997;53:475.
7. Khamis E. Corrosion. 1990;46:476. [ Links ]
8. Afidah A, Rahim E, Rocca J, et al. Corros Sci. 2007;49:402. [ Links ]
9. Fouda AS, Al-Sharawy AA, El-Katori EE. Desalination 2006;201:1. [ Links ]
10. Wang H-L, Fan H-B, Zheng J-S. Mater Chem Phys. 2002;77:655. [ Links ]
11. Tirbonodand F, Fiaud C. Corros Sci. 1978;18:139. [ Links ]
12. Elmorsi MA, Hassanein AM. Corros Sci. 1999;41:2337. [ Links ]
13. Abdallah M, Moustafa E. Ann Chim. 2004;94:601. [ Links ]
14. Makhlouf MT, Khalil HZ. J Chem Tech Biotechnol. 1987;38:89. [ Links ]
15. Talati JD, Daraji JM. J Indian Chem Soc. 1991;68:67. [ Links ]
16. Gomma KG, Wahdan HM. Mater Chem Phys. 1995;39:209. [ Links ]
17. Mourad MY, Seliman SA, Abd El-Metaal SM. Bull Soc Chim Fr. 1991;128:832. [ Links ]
18. Oguzie EE, Unaegbu C, Ogukwe CN, et al. Mater Chem Phys. 2004;84:363. [ Links ]
19. Oguzie EE. Mater Chem Phys. 2004;87:212. [ Links ]
20. Oguzie EE, B.N. Okolue, E.E. Ebenso, et al. Mater Chem Phys. 2004;87:394.
21. Oguzie EE. Mater Lett. 2005;59:1076. [ Links ]
22. Oguzie EE, Onuoha GN, Onuchukwu AI. Mater Chem Phys. 2005;89:305. [ Links ]
23. Ebenso EE, Oguzie EE. Mater Lett. 2005;59:2163. [ Links ]
24. Jeyaraj T, Raja C, Paramasivam M, Jayapriya B. Trans SAEST. 2005;40:19. [ Links ]
25. Oguzie EE, Okolue BN, Ogukwe CE, Unaegbu C. Mater Lett. 2006;60:3376. [ Links ]
26. Assaf FH, Abou-Krish M, El-Shahawy AS, et al. Int J Electrochem Sci. 2007;2:169. [ Links ]
27. Al-Juaid SS. Port Electrochim Acta. 2007;25:363. [ Links ]
28. Sathiyabama J, Rajendran S, Selvi JA, Amalraj AJ. Ind J Chem Technol. 2008;15:462. [ Links ]
29. Abdallah M, Fouda AS, Shama SA, Afifi EA. Afr J Pure App Chem. 2008;2:83. [ Links ]
30. Ebenso EE, Alemu H, Umoren SA, Obot IB. Int J Electrochem Sci. 2008;3:1325. [ Links ]
31. Abboud Y, Abourriche A, Saffaj T, et al. Desalination. 2009;237:175. [ Links ]
32. Prabhu RA, Venkatesha TV, Shanbhag AV. J Iran. Chem Soc. 2009;6:353. [ Links ]
33. Ashassi-Sorkhabi H, Masoumi B, Ejbari P, Asghari E. J Appl Electrochem. 2009;39:1497. [ Links ]
34. Mabrouk EM, Shokry H, Abu Al-Naja KM. Chem Met All. 2011;4:98. [ Links ]
35. Benali O, Larabi L, Merah S, Harek Y. J Mater Environ Sci. 2011;2:39. [ Links ]
36. Onen AI, Maitera ON, Joseph J, Ebenso EE. Int J Electrochem. Sci. 2011;6:2884. [ Links ]
37. ShivaKumar SS, Mohana NK. Int J Electrochem Sci. 2012;7:1620. [ Links ]
38. Nabi SAA, Hussain AA. J Bas Res. 2012;38:125. [ Links ]
39. Alego VO, Hope GA, Flitt HJ, et al. Corros Sci. 1992;33:1719. [ Links ]
40. Sahin M, Bilgic S, Ylmaz M. Appl Surf Sci. 2002;195:1. [ Links ]
41. Zaafarany A, Abdallah M. Electrochem Sci. 2010;5:18. [ Links ]
42. Ergun U, Yuzer D, Emregul KC. Mater Chem Phys. 2008;109:492. [ Links ]
43. Langmuir I. J Am Chem Soc. 1947;39:1848. [ Links ]
44. Ali SA, Saeed MT, Rahman SU. Corros Sci. 2005;45:253. [ Links ]
45. Khamis E. Corrosion. 1990;46:476. [ Links ]
46. Bensajjay E, Alehyen S, El-Achouri M, Kertit S. Anti-Corros Meth Mater. 2003;50:402. [ Links ]
47. Kumar ET, Viswanatham S, Udayabhanu G. Corros Eng Sci Technol. 2004;39:327. [ Links ]
48. Ateya B, El-Anadouli B, El-Nizamy F. Corros Sci. 1984;24:509. [ Links ]
49. Ali SA, El-Shareef AM, Al-Ghamdi RF, Saeed MT. Corros Sci. 2005;47:2659. [ Links ]
50. Ebenso EE, Alemu H, Umoren SA, Olet IB. Int J Electrochem Sci. 2008;3:1325. [ Links ]
51. Umoren SA, Ebenso EE. Pigm Resin Technol. 2008;37:173. [ Links ]
52. Lj MV, Dragic DM. Corros Sci. 2002;44:1669. [ Links ]
53. El-Mahdi B, Mernari B, Traisnel M, et al. Mater Chem Phys. 2002;77:489. [ Links ]
54. Muralidharam S, Quraishi MA, Layer SVK. Corros Sci. 1995;37:1739. [ Links ]
55. Feng W, Nansheng D, Helin H. Chemosphere. 2000;41:1233. [ Links ]
*Corresponding author. E-mail address: mmbel_sabbah@hotmail.com
Received 6 April 2013; accepted 30 April 2013


