Serviços Personalizados
Journal
Artigo
Indicadores
-
 Citado por SciELO
 -
 Acessos
Links relacionados
-
 Similares em
SciELO
Compartilhar
Portugaliae Electrochimica Acta
versão impressa ISSN 0872-1904
Port. Electrochim. Acta vol.32 no.1 Coimbra jan. 2014
https://doi.org/10.4152/pea.201401035
Phenolic and non-Phenolic Fractions of the Olive Oil Mill Wastewaters as Corrosion Inhibitor for Steel in HCl medium
A. Khadiria , A. Ousslima , K. Bekkouchea , A. Aounitib , A. Elidrissib and B. Hammoutib,*
a LCSMA-Faculté des Sciences, Université Mohammed Premier, B.P. 717, 60000 Oujda, Morocco
b LCAE-URAC18, Faculté des Sciences, Université Mohammed Premier, B.P. 717, 60000 Oujda, Morocco
Abstract
The inhibition of the corrosion of Mild Steel (MS) in 1 M HCl solution by a new synthesised organic compound, namely 1,1'-(2,2'-(2,2'-oxybis(ethane-2,1-diyl)bis (sulfanediyl))bis(ethane-2,1-diyl))diazepan-2-one, has been studied by weight loss measurements, electrochemical polarisation and electrochemical impedance spectroscopy (EIS). The experimental results have showed that this organic compound revealed a good corrosion inhibition and the inhibition efficiency is increased with the inhibitor concentration to reach 97% at 1 mM. Potentiodynamic polarisation suggested that it is a mixed type of inhibitor. EIS measurements show an increase of the polarisation resistance with the inhibitor concentration and the electrical equivalent circuit is determined. The inhibitor adsorption process on (MS) surfaces obeys the Langmuir adsorption isotherm and the adsorption isotherm parameters (Kads, ΔGads, ΔHads and ΔSads) were determined. The temperature effect on the corrosion behaviour of (MS) in 1 M HCl without and with inhibitor at different concentration was studied in the temperature range from 308 to 353 K and the kinetic parameters activation such as Ea, ΔHa and ΔSa were evaluated.
Keywords: corrosion; inhibition; thermodynamic, adsorption, azepane.
Introduction
The corrosion of steel and ferrous alloys is a fundamental process playing an important role in economies and public safety [1]. Mild Steel is a well-known material used commonly in various industries. Acid solutions are often used for the removal of rust and scale in several industrial processes. In this case, hydrochloric acid is one of the most widely used agents. Various types of organic compounds are widely used as corrosion inhibitors for protection of materials against deterioration from corrosion [2-14].A persuade of the literature on acid corrosion inhibitors reveals that most organic substances employed as corrosion inhibitors act by adsorption on the metal surface. The adsorption of the inhibitors mainly depends on the presence of π-electrons and heteroatoms such as nitrogen, oxygen, phosphorus and sulphur, which are considered as adsorption centres [1517]. In this work, we investigate the corrosion of (MS) in 1 M HCl by 1,1'-(2,2'-(2,2'oxybis( ethane-2,1-diyl)bis(sulfanediyl))bis(ethane-2,1-diyl))diazepan-2-one (AZEPE). Weight loss tests and electrochemical techniques such as potentiodynamic polarisation and electrochemical impedance spectroscopy have been used to study the effect of addition of this compound on the corrosion of steel in hydrochloric acid solution.
Experimental
Inhibitor
A mixture of N-vinyl caprolactame (27.84 g, 0.2 mol) and 2, 2-azo-bisisobutyronitrile (AIBN) (0.082g, 5.10-4 mol) in 100 mL of acetonitrile (CH3CN) was added drop by drop during 30 min to 2-mercaptoethylether dissolved in 50 mL of acetonitrile. Then, the mixture was stirred during 3h in the presence of pure nitrogen (N2) at 70 °C under atmospheric pressure. The solvent and the excess of 2-mercaptoethylether were removed and the product was purified by chromatographic on a silica column (eluent CH2Cl2), to give AZEPE product as yellow oil, yield 90%. A schematic representation of the synthesis is shown in Fig. 1.
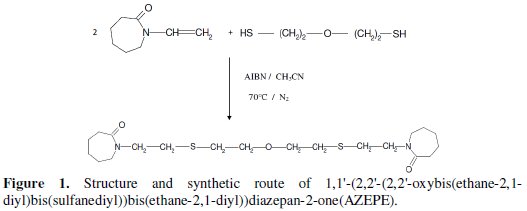
This inhibitor was synthesized according to A. Ousslim in our laboratory and characterised by 1H-NMR, 13C-NMR and IR spectroscopy. 1H-NMR (CDCl3, δ (ppm)): 1.29 (m, 2H); 1.55 (m, 2H); 1.57 (t, 2H); 2.18 (t, 2H); 2.61(t, 2H); 2.70(t, 2H) ; 3.2 (t, 2H) ; 3.65 (t, 2H) ; 3.74 (t, 2H); 13C-NMR (CDCl3, δ (ppm)): 23.5; 29.9; 30.8; 31.7; 37.26; 44.12; 49.8, 72.2, 174.28; IR (KBr, ν (cm-1)): 2918 (FF); 2864 (m); 1656-1624 (FF); 1463(f); 1308 (f); 1197 (f); 1113 (FF); 1093 (f); 725 (f).
Materials
Mild steel sheets used in this study contain 0.21% C, 0.38% Si, 0.05% Mn, 0.05% S, 0.09% P, 0.01% Al and the remainder iron (Fe). The steel specimens used were pre-treated prior to the experiment by grinding with emery paper (grade 400, 600 and 1200), then rinsed with bi-distilled water, degreased, dried and immersed in the corrosive solution.
Weight loss studies
Weight loss measurements were performed at 308 K (except for temperature effect) for 6 h by immersing the mild steel specimens into non-de-aerated solution (50 mL) without and with various concentrations of the inhibitor. After immersion period, the steel specimens were taken out, washed, dried and weighted by an analytical balance (precision ± 0.1 mg); three experiments were performed in each case and the mean value of the weight loss is calculated.
Electrochemical measurements
Electrochemical measurements were performed in a conventional three-electrode cylindrical pyrex glass cell. The temperature is controlled at 308 ± 1 K. The working electrode (WE) in the form of disc is cut from steel, has a geometric area of 1 cm2 and is embedded in polytetrafluoroethylene (PTFE). A saturated calomel electrode (SCE) and a platinum electrode are used, as reference and auxiliary electrodes, respectively. The electrochemical measurements were carried out using Tacussel Radiometer PGZ 100, which was controlled by a personnel computer. Before each experiment, the work electrode was allowed to corrode freely for 1 h (no de-aeration, no stirring). All EIS were recorded at the open circuit potential EOCP. The duration of one EIS experiment was about 20 min. The response of the electrochemical system to ac excitation with a frequency ranging mainly from 100 kHz to 10 mHz and peak to peak amplitude of 10 mV was measured with data density of 10 points per decade. The impedance data were analyzed and fitted with the simulation ZView 2.8 equivalent circuit software.
The polarisation measurements were recorded after the EIS measurements on the same electrode without any further surface treatment. Before and during each experiment, the test solutions were stirred by the magnetic stirrer and de-aerated in the cell by using pure nitrogen. The polarisation curves were obtained potentiodynamically between -800to -200mV (Ag/AgCl) with the scan rate of 1 mV s-1.
Results and discussions
Weight loss measurements
Effect of inhibitor concentration
The effect of addition of the inhibitor tested at different concentrations on the corrosion of mild steel in 1 M HCl solution is studied by weight loss at 308±1K after 6 h of immersion period. For every concentration of inhibitor, the mean value of the corrosion rate Wcorr (mg cm-2 h-1) was determined and the inhibitor efficiency, EW(%), was calculated using equations (1) and (2), respectively.


where mb and ma are the mass of the specimen before and after immersion in the tested solution, Wcorr and W0corr are the corrosion rates of mild steel in inhibited and uninhibited solution, respectively, S is the area of the mild steel specimen (cm2 ) and t is the immersion time (h).
The results obtained are summarized in Table 1.

It is very clear that the corrosion rate (Wcorr) decreases with increasing inhibitor concentration and the inhibition efficiency increases with inhibitor concentration and attains 95.56% at 1 mM of inhibitor.
Effect of temperature
The effect of temperature on the inhibition efficiency, in the temperature range 308-353 K, in 1 M HCl, was studied using gravimetric experiments in the absence and presence of 0.05, 0.1, 0.5 and 1 mM of inhibitor after 2 h of immersion time. The results obtained are summarized in Table 2.

We note a slight variation in the inhibition efficiency at all concentrations for inhibitor studies in the temperature range 308-353 K. In addition, the inhibition efficiency is quietly independent of the temperature in the range 308-333 K.
Adsorption isotherm
It is universally accepted that the organic inhibitors act by means of physiadsorption or chemiadsorption on the metal surface. Isotherm equations are frequently used to describe the adsorption. In order to gain more information about the mode of adsorption of the inhibitor on the surface of mild steel, the experimental data have been tested with several adsorption isotherms. The values of surface coverage (θ) for different concentrations at different temperatures have been used to explain the best isotherm that determines the adsorption process. The values of surface coverage (θ) were evaluated from weight loss measurements by using the following equation:

In this equation, Wcorr and W0corr represent the corrosion rates of mild steel in the presence and absence of the inhibitor, respectively.
The correlation of θ with concentration of inhibitor was evaluated by different adsorption isotherms such as Langmuir, Frumkin and Temkin. However, the best fit was obtained from the Langmuir isotherm (Fig. 2).
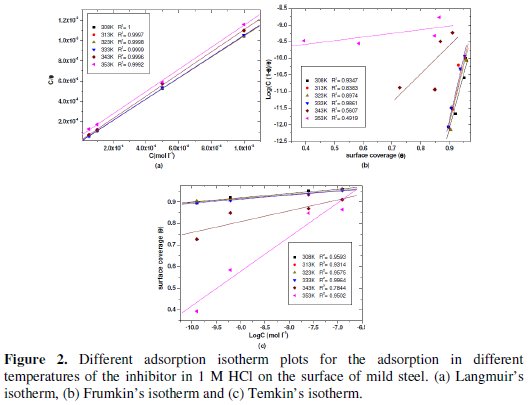
These isotherms are given by equations (4), (5) and (6), respectively [18-20].


where Kads is the equilibrium adsorption and f is the molecular interaction constant.
The equilibrium constant for adsorption process is related to the free energy of adsorption, ΔGads, and is expressed by equation (7)

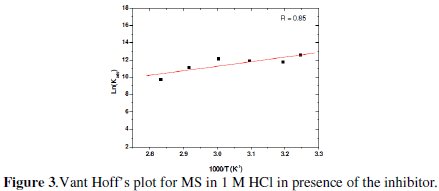
where 55.55 is the molar concentration of water in the solution expressed in (mol L-1); R is the gas constant (8.314 J K-1 mol-1) and T is the absolute temperature (K). The heat of adsorption, ΔHads, is obtained from the Van't Hoff's equation (8) [21,22].

When Ln(Kads) vs. (1/T) is plotted (Fig. 3), the value of ΔHads is obtained from the slope and ΔSads is obtained for a range of temperatures with equation (9):

The values of Kads, ΔGads, ΔHads and ΔSads are disclosed in Table 3.
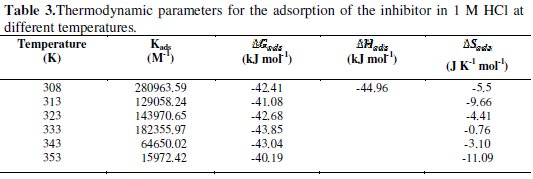
The values of negative values of ΔGads along with high Kads a spontaneous adsorption process [23, 24]. Generally, the ΔGads values up to -20 kJ molar e consistent with the electrostatic interaction between the charged molecules and the charged metal (physisorption). On the other hand, negative values less than -40 kJ mol-1 involve sharing or transferring of electrons from the inhibitor molecules to the metal surface to form a co-ordinate type of band (chemisorption) [25]. The calculated ΔGads values are ranging between -41.07 and -43.85 kJ mol-1, suggesting that the inhibitor was adsorbed chemically onto the mild steel surface.
The higher values of Kads and ΔGads refer to higher adsorption and higher inhibiting effect [26]. The negative value of ΔHads also shows that the adsorption of the inhibitor is an exothermic process [27]. The adsorption of inhibitor molecules is accompanied by negative values of ΔSads because of the confining of an adsorbed molecule to a thin surface layer (certain degrees of freedom are lost) [28].
Activation parameters
Kinetic model can be used to explain the inhibitor behaviour. The apparent activation energy for the corrosion process was calculated from the Arrhenius equation:

where Ea represents the apparent activation energy, A is the pre-exponential factor and Wcorr is the corrosion rate. Fig 4.a shows the Arrhenius plot of Log (Wcorr) vs. 1/T in the absence and presence of different concentrations of the inhibitor at different temperatures.
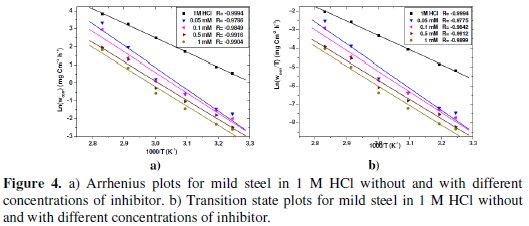
The enthalpy of activation ΔHa and entropy of activation ΔSa were obtained from the transition state equation:

where h is the Plank's constant, NA is the Avogadro's number, T is the absolute temperature and R is the universal gas constant. Straight lines of Log( Wcorr / T ) against 1/T are plotted in Fig 4.b; ΔHa and ΔSa are obtained from the slope and intercept of the linear plots, respectively. The values Ea, ΔHa and ΔSa at different temperatures are presented in Table 4.

We note that the linear regression coefficients are over 0.97 indicating the validation of the employed kinetic model.
According to the report in literature [29, 30], higher value of Ea was considered as physiadsorption. Because the electrochemical corrosion is relevant to heterogeneous reaction, the pre-exponential factor A in the Arrhenius equation is related to the number of active centres with different Ea on the metal surface: (i) the activation energy in the presence of the inhibitor is lower than that of pure acidic medium, namely Ea(inh) < Ea(HCl), which suggests a smaller number of more active sites remaining uncovered in the corrosion process, (ii) the activation energy in the presence of the inhibitor is higher than that of pure acidic medium, Ea(inh) > Ea(HCl), which represents the inhibitor adsorbed on most active adsorption sites (having the lowest energy) and the corrosion takes place chiefly on the active sites (having the higher energy).
The data in Table 4 specifically indicate that the values of Ea in presence of the inhibitor are larger than that in the absence of the inhibitor, which is consistent with the latter mentioned above; this means that the adsorbed inhibitor molecules block the most active sites, while the sites of higher activation energy, which are greater in number, take part in the subsequent corrosion [29, 31]. The positive values of ΔHa manifest the endothermic nature of the dissolution process; ΔSa was also positive in the presence of the inhibitor, suggesting that active complexes were formed by the substitution of water for the inhibitor.
This part showed that physical adsorption is not neglected and the mechanism of inhibition may be endorsed that inhibition of inhibitor acted both by physical and chemical adsorption.
Inspection of the data reveals that the ΔHa values for dissolution reaction of mild steel in 1 M HCl in the presence of inhibitor are higher (86.34; 98.52 kJ mol-1) than that of in the absence of inhibitor (64.8 kJ mol-1). The positive signs of reflect the endothermic nature of mild steel dissolution process, which suggests the slow dissolution of mild steel in presence of the inhibitor [32]. In the presence of inhibitor, one can notice the Ea and ΔHa values vary in the same way (Table 4). These results permit to verify the known thermodynamic relation between the Ea and ΔHa ( ΔHa = Ea - T.ΔSa ) [33,34].
Potentiodynamic polarisation
The values of corrosion potential Ecorr, corrosion current density icorr, and anodic and cathodic slopes (βa and βc) can be evaluated from anodic and cathodic regions of Tafel plots. The linear Tafel segments of anodic and cathodic curves were extrapolated to corrosion potential to obtain corrosion current densities (icorr).
The inhibition efficiency was evaluated from the measured icorr values using the relationship

where and are the values of corrosion current density in absence and presence of the inhibitor, respectively.
Fig. 5 shows the polarisation curves recorded on mild steel in 1 M HCl solutions in the absence and presence of different concentrations of the inhibitor.
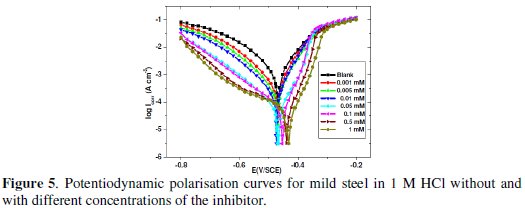
It can be seen from this figure that with the increase of inhibitor concentration, both anodic and cathodic reactions were supported through inhibitor adsorption on the mild steel surface in 1 M HCl solution.
Table 5 shows that the icorr decreases with the increase in inhibitor concentration and the inhibition efficiency reaches to the maximum at 1 mM of inhibitor.
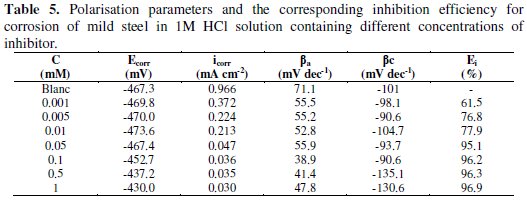
From this table, it is also clear that Ecorr values do not shift with inhibitor concentration. In literature, it has been reported that if the displacement in Ecorr is > 85 mV with respect to Ecorr, the inhibitor can be seen as of the cathodic or anodic type, and if the displacement in Ecorr is < 85 mV, the inhibition can be seen as of the mixed type [35-37]. In our study the maximum displacement in Ecorr value was 37 mV towards anodic region, which indicates that the inhibitor is of the mixed type with predominance of the anodic type. The values of the slopes of the anodic Tafel lines, βa, are lower than those for uninhibited solution, which suggests that the inhibitor can affect the kinetics of the anodic process. The inhibition efficiencies calculated from potentiodynamic polarisation curve are in good agreement with those obtained from weight loss measurements.
Electrochemical impedance spectroscopy (EIS) measurements
The corrosion behaviour of MS in 1 M HCl solution in the absence and presence of various concentrations of the inhibitor after immersion for 1 h at 308 K was investigated using EIS. In general, kinetic information of the electrode interface between the mild steel and the test solution can be obtained from the shape of the impedance diagrams [38]. The recorded EIS spectrum for MS in 1 M HCl solution in absence and presence of different concentrations (except 0.5 and 1 mM) (Fig. 6) shows a depressed capacitive loop in the high frequency (HF) range and an inductive loop in the lower frequency (LF) range. The HF capacitive loop can be attributed to the charge transfer reaction and time constant of the electric double layer and to the surface non-homogeneity of interfacial origin, such as those found in adsorption process on metal surface, and the LF inductive loop may be attributed to the relaxation process like Cl-ads and H+ads on working electrode surface [39]. For the concentration 0.5 and 1 mM, Fig. 6 shows only one depressed capacitive loop.
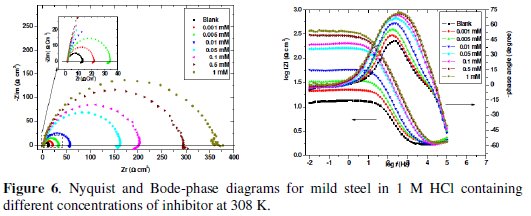
The diameters of capacitive loops increase with the increase in inhibitor concentration, which indicates the increase of charge transfer and improvement in inhibiting effect on MS corrosion (Fig. 6). It reveals that the presence of the inhibitor in 1 M HCl solutions increases the charge transfer resistance due to the formation of a protection layer on the MS surface, but it does not change other aspects of the corrosion behaviour. These results agree with those of polarization measurements, that is, the inhibitor does not substantially alter the electrochemical reactions mechanism. The above observation is also verified by the Bode plots (Fig. 6). Each Bode-phase diagram consists of a single wave crest and a portion of curve under the zero phase degree. However, it is clear that the shapes of the impedance plots for the inhibited electrodes are not essentially different from those of the uninhibited electrodes. Electrical equivalent circuits are generally used to model the electrochemical behaviour and to calculate the impedance parameters [40].
Figs.7a and b show the equivalent circuit model used to fit the experimental impedance data of MS in 1 M HCl in absence and presence of different concentrations (except 0.5 and 1 mM).

In this case the addition of inhibitor has no effect on the shape of the impedance spectra; two equivalent circuits may be proposed to fit these systems that charge transfer controls the corrosion process. The same equivalent circuit was often used to describe the corrosion inhibition caused by organic compounds in acidic medium [41-46].
In the equivalent circuit Rs is the solution resistance, CPEd is a constant phase element, Rct is the charge transfer resistance, L is the inductance and Rct + RL presents the polarisation resistance (RP). Resistance RL and inductance L may be correlated with a slow frequency intermediate process [47]. The presence of inductance L in the impedance spectra indicates that the MS is still dissolved by the direct charge transfer in the presence of the inhibitor [45]. The constant phase element, CPE, is introduced in the circuit instead of a pure double layer capacitor in order to take into account the electrode surface heterogeneity resulting from surface roughness, impurities, dislocations, grain boundaries, adsorption of inhibitors, formation of porous layers [31,48] and therefore to give a more accurate fit [49]. The impedance of the CPE is expressed as:

where A is the proportionality of CPE (in Ω-1 sn cm-1), ω is the sine wave modulation angular frequency (in rad s-1), i2 = -1 is the imaginary number, and n is an empirical exponent which measures the deviation from the ideal capacitive behaviour [50,51]. The CPE can be expressed by the values of n if resistance (n = 0, A = R), capacitance (n = 1, A = C), Inductance (n = -1, A = L) and Warburg impedance (n = 0.5, A = W) [52]. The experimental data were very well fitted according to the proposed equivalent circuit and as an example; the simulated curves are presented in Fig. 8.
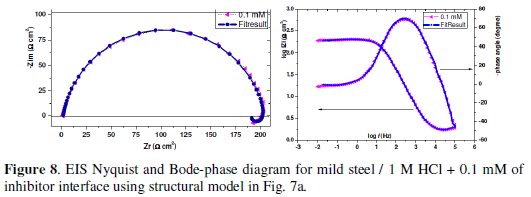
The corresponding fitting results are listed in Table 6.
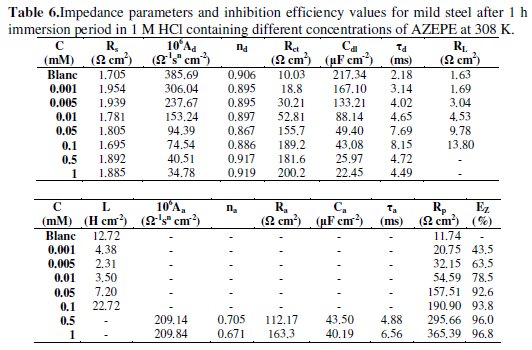
In this table are also shown the calculated double layer capacitance (Cdl) derived from the CPEd parameters according to equation (14) [53];

the relaxation time constant (τd) of charge-transfer process was calculated using equation (15) [53]:

Results in Table 6 show that Rct value increased with the concentration of the inhibitor. In addition, the value of proportional factor A of CPE varies in a regular manner with inhibitor concentration. The change in the values of Rct and A can be related to the gradual removal of water molecules by AZEPE molecules on the electrode surface and consequently leads to decrease in the number of active sites necessary for the corrosion reaction [54].
The value of the relaxation time constant (τd) slowly increases with AZEPE concentration as well and the time of adsorption process becomes therefore much higher, which means a slow adsorption process [55]. This shows that there is an agreement between the amount of charge that can be stored (that is capacitance) and discharge velocity in the interface ( d) [56]. At LF region, the inductance (L) increases with inhibitor concentration.
The related inhibition efficiency, EZ(%), is calculated from RP =(Rct+RL) using the following equation (16):

where and are the ac polarisation resistance of mild steel electrode in the uninhibited and inhibited solutions, respectively.
The equivalent circuit for the concentrations 0.5 and 1 mM of inhibitor is shown in Fig. 7b. In this model Rs refers the solution resistance, Rct the charge transfer resistance, CPEd the constant phase element of the high frequency semicircle that can be attributed to the charge transfer process, Ra the resistance of the adsorbed inhibitor, CPEa the constant phase element of the inhibitor film due to the inhibitor's adsorption on the steel surface, and the sum Rct + Ra presents the polarisation resistance RP. The same equivalent circuit was often used to describe the corrosion inhibition caused by organic compounds in acidic medium [1, 53,57-58]. The time constant of the adsorption process is τa = Ra Ca, the adsorption capacitance being again replaced by a CPE, and Ca is calculated by equation (17):

The experimental data were very well fitted according to the proposed equivalent circuit and as an example; the calculated curves are presented in Fig. 9.
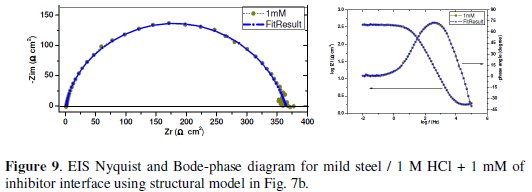
The main fitted parameters are summarised in Table 6. From these results, it's clear that Rct increase and Cdl decrease with inhibitor concentration. A large Rct is associated with a slower corroding system [48, 59]. Furthermore, the decrease in the Cdl with increase in inhibitor concentrations may be attributed to the formation of a protective layer on the mild steel surface [60].The increase of the nd values after addition of AZEPE in 1 M HCl solution (0.917-0.919) when compared to that obtained in uninhibited solution (0.889) can be explained by some decrease of the initial surface heterogeneity, due to the adsorption of the inhibitor on the most active adsorption sites on the steel surface[48]. In the same way, the values of the adsorption time constant τa show a marked tendency to increase with concentration and they are higher than τd; the apparent increase of τa with concentration is influenced by the adsorption process. The values of na are lower than those of nd, indicating greater energy distribution in the adsorption layer [53]. The resistance values Ra are lower than Rct values, so the total resistance RP is dominated by Rct and increases significantly with the inhibitor concentration.
The related inhibition efficiency, EZ(%), is calculated from RP = ( Rct + Ra ) using eq. (16). It is obvious that the increase in inhibitor concentration enhances RP, and consequently improves the inhibition efficiency till reaching their maximum value at 1 mM (RP = 365.39 cm 2, EZ(%) = 96.76) The inhibition efficiency calculated by EIS shows the same trend as those obtained from the weight loss measurements and the potentiodynamic polarisation methods.
Conclusions
The principal findings of the present work can be summarised as follows: The compound 1,1'-(2,2'-(2,2'-oxybis(ethane-2,1-diyl)bis(sulfanediyl))bis(ethane2,1- diyl))diazepan-2-one, is a good inhibitor for steel in 1 M HCl.
The adsorption of the inhibitor obeys the Langmuir adsorption isotherm. The high value of adsorption equilibrium constant and negative value of free energy of adsorption suggested that the inhibitor is strongly adsorbed on MS surface. The temperature effect reveals that the AZEPE is a good inhibitor at high temperature.
The polarisation measurements reveal that AZEPE behaves as a mixed type inhibitor by inhibiting both anodic metal dissolution and cathodic hydrogen evolution reactions.
Data obtained from electrochemical impedance spectroscopy (EIS) technique show an increase of the polarisation resistance (RP) and a decrease of the capacitance values with the concentration of the inhibitor. Both double layer and adsorption capacitances are distributed and therefore modelled by constant phase elements (CPE) due to the surface inhomogeneity.
Values of the corrosion inhibition efficiency, determined by weight loss, potentiodynamic polarisation and EIS measurements are in reasonable agreement.
References
1. Doner A, Gulfeza Kardas. Corros Sci 2011;53:4223. [ Links ]
2. Bentiss F, Traisnel M, Lagrenee M. Corros Sci. 2000;42:127. [ Links ]
3. Pillali C, Narayan R.Corros Sci. 1983;23:151. [ Links ]
4. Growcock F, Lopp VR, Corros Sci. 1988;28:397. [ Links ]
5. Bekkouch K, Aouniti A, Hammouti B, et al. J Chim Phys. 1999;96:838. [ Links ]
6. Kertit S, Bekkouche K, Hammouti B, Rev Metall. 1998;95: 251. [ Links ]
7. Bouzidi D, Kertit S, Hammouti B, et al. J ElectrochemSoc India 1997;46:23. [ Links ]
8. Kertit S, Hammouti B, Taleb M, et al. Bull Electrochem. 1997;13:241. [ Links ]
9. Hammouti B, Melhaoui A, Kertit S. Bull Electrochem. 1997;13:97. [ Links ]
10. Touhami F, Aouniti A, Kertit S, et al. Corros Sci. 2000;42:929. [ Links ]
11. Touhami F, Hammouti B, Aouniti A. Ann Chim Sci Mat. 1999;24:581. [ Links ]
12. Aouniti A, Hammouti B, Brighli M, et al. J Chim Phys. 1996;93:1262. [ Links ]
13. Hammouti B, Aouniti A, Taleb M, et al. Corrosion. 1995;51:411. [ Links ]
14. Aouniti A, Hammouti B, Kertit S. Bull Electrochem. 1998;14:193. [ Links ]
15. Avci G. Mater Chem Phys. 2008;112:234. [ Links ]
16. Avci G. Colloids Surf A: Physicochem Eng Asp. 2008;317:730. [ Links ]
17. Doner A, Solmaz R, Ozcan M, et al. Corros Sci. 2011;53:2902. [ Links ]
18. Bayol E, Kayakirilmaz K, Erbil M. Mater Chem Phys. 2007;104:74. [ Links ]
19. Frumkin A N. Prog. Surf Sci. 1977;8:1. [ Links ]
20. Durnie W, Marco R D, Jefferson A, et al. J Electrochem Soc. 1999;146:1751. [ Links ]
21. Zhao T P, G N Um. Corros Sci. 1999;41:1937.
22. Tang L, Mu G, Liu G. Corros Sci. 2003;45:2252. [ Links ]
23. Scendo M. Corros Sci. 2007;49:373. [ Links ]
24. Soltani N, Behpour M, Ghoreishi S M, et al. Corros Sci. 2010;52:1351. [ Links ]
25. Bouklah M, Hammouti B, Lagrenee M, et al. Corros Sci. 2006;48:2831. [ Links ]
26. Solmaz R, Kardas G, Culha M, et al. Electrochim Acta. 2008;53:5941. [ Links ]
27. Gomma M K, Wahdan M H. Mater Chem Phys. 1995;39:209. [ Links ]
28. Do D D. Adsorption Analysis: Equilibria & Kinetics. London: Imperial College Press;1998. [ Links ]
29. Chen W, Luo H Q, Li N B. Corros Sci. 2011;53: 3356. [ Links ]
30. Tu S, Jiang X, Zhou L, et al. Corr Sci. 2012;65:13. [ Links ]
31. Popova A, Sokolova E, Raicheva S. et al. Corros Sci. 2003;45:33. [ Links ]
32. Guan N M, Xueming L, Fei L. Mater Chem Phys. 2004;86:59. [ Links ]
33. Ahamad I, Prasad R, Quraishi M A. Corros Sci. 2010;52:933. [ Links ]
34. Yadav D K, Quraishi M A, Maiti B. Corros Sci. 2012;55:254. [ Links ]
35. Ashassi-Sorkhabi H, Majidi M R, Seyyedi K. Appl Surf Sci. 2004;225:176. [ Links ]
36. Riggs Jr O L. Corrosion Inhibitors. 2nd ed. Houston, TX;1973. [ Links ]
37. Behpour M, Ghoreishi S M, Mohammadi N, et al. Corros Sci. 2010;52:4046. [ Links ]
38. Lorenz W J, Mansfeld F. Corros Sci 1981;21: 647. [ Links ]
39. Ahamad I, Prasad R, Quraishi M A. Corros Sci. 2010;52: 933. [ Links ]
40. Macdonald J R. Electroanal Chem. 1987;223: 25. [ Links ]
41. Khaled K F, Amin M A. Corros Sci. 51 2009; 1964.
42. Amin M A, Ibrahim M M. Corros Sci. 53 2011; 873.
43. Hermas A A, Morad M S, Wahdan M H. Appl Electrochem. 2004;34:95. [ Links ]
44. Poornima T, Jagannatha N, Shetty A N. Port Electrochim Acta. 2010;28:173. [ Links ]
45. Zarrok H, Zarrouk A, Hammouti B, et al. Corros Sci. 2012;64:243. [ Links ]
46. Chen W, Luo H Q, Li N B. Corros Sci. 2011; 53:3356. [ Links ]
47. Gojic M. Corros Sci. 2001;43:919. [ Links ]
48. Growcock F B, Jasinski J H. J Electrochem Soc. 1989;136:2310. [ Links ]
49. Macdonald J R, Johanson W B. In: JR Macdonald (Ed.). Theory in impedance spectroscopy. New York:John Wiley& Sons;1987. [ Links ]
50. Lopez D A, Simison S N, de Sanchez S R. Electrochim Acta. 2003;48:845. [ Links ]
51. Stoynov Z B, Grafov B M, Savova-Stoynova B, et al. Electrochemical Impedance. Moscow:Nauka;1991. [ Links ]
52. Singh A K, Quraishi M A. Corros Sci 2010;52:1373. [ Links ]
53. Popova A, Christov M, Vasilev A. Corros Sci. 2007;49:3290. [ Links ]
54. Bentiss F, Lebrini M, Lagrenee M, et al. Electrochim Acta. 2007;52:6865. [ Links ]
55. Popova A, Christov M, Vasilev A. Corros Sci. 2011;53:1770. [ Links ]
56. Khaled K F, Al-Qahtani M M. Mater Chem Phys. 2009;113:150. [ Links ]
57. Bentiss F, Outirite M, Traisnel M, et al. Int J Electrochem Sci. 2012;7:1699. [ Links ]
58. Yuce A O, Kardas G. Corros Sci. 2012;58:86. [ Links ]
59. Lebrini M, Bentiss F, Chihib N, et al. Corros Sci. 2008;50:2914. [ Links ]
60. Kedam M, Mattos O R, Takenouti H. J Electrochem Soc. 1981;128:266. [ Links ]
*Corresponding author. E-mail address: hammoutib@gmail.com
Received 4 February 2014; accepted 26 February 2014


