Serviços Personalizados
Journal
Artigo
Indicadores
-
 Citado por SciELO
 -
 Acessos
Links relacionados
-
 Similares em
SciELO
Compartilhar
Portugaliae Electrochimica Acta
versão impressa ISSN 0872-1904
Port. Electrochim. Acta vol.32 no.3 Coimbra maio 2014
https://doi.org/10.4152/pea.201403233
Effect of Operating Parameters on Electrochemical Degradation of Alizarin Red S on Pt and BDD Electrodes
M. M. El Jamala,* , A. M. Mousaouia , D. M. Naoufala , M. A. Tabbarab and A. A. El Zantc
a Inorganic and Organometallic Coordination Chemistry Laboratory (LCIO), Faculty of Sciences (I), Lebanese University, Hariri Campus, El Hadath, Lebanon
b Faculty of Engineering (III), Lebanese University, Hariri Campus El Hadath, Lebanon
c Faculty of Sciences (III), Lebanese University, Tripoli, Lebanon
Abstract
The degradation of Alizarin Red S by electro-generated species using Pt and BDD electrodes was performed. The results were explained by the generation of OH•; radical, S2O82- at BDD electrode and active chlorine species at Pt electrode. The slow degradation is affected by the current density, initial pH, temperature, initial dye concentration and the nature of the supporting electrolyte. However, the ionic strength showed a negligible effect on both electrodes. In the presence of KCl, the intermediates produced during the degradation are similar at both electrodes. In the presence of sulfate (at BDD electrode), the rate and the mechanism of the degradation are different from those in the presence of KCl. TOC analysis showed total mineralization of AR S.
Keywords: BDD electrode; Pt electrode; Alizarin Red S; Electrodegradation.
Introduction
The textile and paper industries produce dye pollutants that are becoming a major source of environmental contamination. One of the problems of textile wastewater in addition to toxic and carcinogenic nature is the color of the effluent. It depletes sunlight penetration which reduces the photosynthetic activity in aquatic plants, thereby having undesirable impact on their growth. The more common chemical classes of dyes employed at industrial scale are the azo, xanthene, triphenyl methyl and anthraquinone dyes. Alizarin Red S was chosen as a model compound of anthraquinone dyes because it is used in textile dyeing since early antiquity. Alizarin Red S is used as stain microscopy, acid-base indicator, in determination of calcium in biological cell [1] and fluoride in aqueous solution [2]. The removal of dyes like Alizarin Red S is a necessary environmental process.
Biological treatments and physicochemical processes such as adsorption, filtration, coagulation/ flocculation, photocatalysis and electrocoagulation have been used to remove dyes from water [3-5]. Oxidative electrochemical processes are among the new technologies for the treatment of wastewaters, particularly when they are charged with toxic and bioresistant compounds.
Anodic oxidation is an advanced oxidation process with many advantages compared to other known chemical and photochemical ones. The mineralization of pollutants via anodic oxidation involves the direct and indirect electrochemical oxidation [6-8, 24]. In indirect oxidation, the reaction between the oxidant (Cl2, OH•solution) and the dye occurred in the bulk of the solution, as in the case with Pt electrode [9-11] and BDD electrode [24], whereas in direct oxidation, the reaction between the oxidant (OH•ads) and the dye occurred at the surface of the electrode, as in the case with BDD electrode [12]. The efficiency of the electrochemical oxidation of dyes is a function of the electrode and the supporting electrolyte [11-18]. Many electrode materials have been tested: noble metals, different forms of carbon, BDD and metal oxides [9]. BDD electrode which is the boundary of the new electrode materials technology provides total mineralization of different organic dyes due to the generation of OH• and SO4•- [12, 13, 15, 16]. BDD electrode possesses interesting properties such as an inert surface with low adsorption properties, considerable corrosion stability and an extremely wide potential window in aqueous medium. Also high O2 overvoltage is another characteristic of BDD anode. The generation of OH•ads at the anode surface from oxidation of aqueous solution occurred as follows [17]:

The generation of SO4•- and S2O82- in aqueous solution of sulfate could be represented as follows [18, 19]:

Many studies have been carried out to investigate the degradation of AR S on BDD electrode [12, 20, 21], on graphite-felt cathode [22], and on activated carbon fiber anode [23]. Also the removal of AR S has been studied by electro- Fenton process using a gas-diffusion cathode [24].
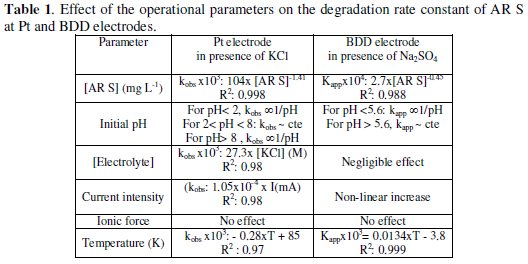
Nevertheless, to the best of our knowledge, the effect of the operating parameters on electrochemical degradation of AR S on BDD and Pt electrodes has not been studied deeply in literature. Thus, it is of interest to study the effect of some experimental parameters such as pH, temperature, current intensity, and others, on the degradation of Alizarin Red S with Pt and BDD anodes.
Experimental
Alizarin Red S was purchased from BDH company (C14H7O7NaS, MW: 342.26 g). In order to study the degradation of the dye with Pt and BDD electrodes, 100 mgL-1 of AR S solution were prepared in distilled water. The concentration of the dye in the reaction mixture was selected in such a way that the absorbance of the dye followed Beer's law. The majority of the experiments were done at 293 K, in the presence of 12 mg L-1 of AR S, 0.06 M KCl or 0.06 M sulfate, at pH 1.7 (by addition of H2SO4), and 10 mA, with a total volume equal to 90 mL. Experiments were carried out in a single combined electrolytic cell. The distance between the anode and the cathode was 5 cm. The electrolysis was done in Chrono- Amperostat, type CEAMD-6, from Taccusel. The Pt electrodes are wires (l:15 mm, d:1.5 mm) from Taccusel (France) and the immersed part of the BDD electrodes are bipolar plates (30×25×2 mm) from NeoCoaT (Switzerland). In order to determine the degradation rate of the dye and the effect of the experimental parameters, the UV-Vis spectra of the solution were recorded on a double beam UV-Visible Specord 200 spectrophotometer (Analytic Jena, AG Germany) at various times of the electrolysis. Schott Gerate CG 819 pH-meter was used to measure pH. TOC of initial and treated solutions was determined with a FormacsHT CA-16 TOC/TN Analyser, Skalar. The experimental parameters studied are the concentration of dye, the initial pH, the nature and the concentration of the strong electrolyte, the intensity of the current, the ionic strength, and the temperature.
Results and discussions
Electrolysis with Pt/Pt electrodes
Visible spectroscopy analysis
The chemical structure and UV-visible spectrum of ARS is given in Fig. 1a.
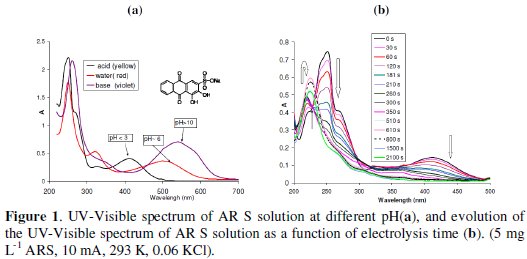
The degradation of AR S was not observed in the presence of sulfate at any pH and even at high current (50 mA). No direct or indirect reaction of the dye at Pt electrode. However, in the presence of 0.06 M KCl (at pH 1.7, 10 mA), 12 mg L-1 of AR S ∼12 min was sufficient for total discoloration (Fig. 1b), but a longer time is needed for total degradation (∼12 h). At Pt electrode the sulfate is not electroactive, whereas the chloride can be oxidized to Cl2, which in turn oxidizes AR S, and discolors it. The time required for total discoloration or degradation was a function of the operational parameters which will be discussed later. In acidic medium, the acidic form of AR S (yellow color) predominates. It presents one broad band with λmax at 412 nm (due to quinonoid π -π* transition), a strong narrow band at 254 nm due to π-π* transition in the benzoid system (characteristic band of anthraquinone [25-27], and a shoulder at 222 nm and 270 nm (Fig. 1). The electron-attracting substituent (-HSO3-) does not appreciably alter the absorption spectrum of anthraquinone. During the electrolysis, the bands at 412, 270, and at 254 nm decrease, but in the first period, the shoulder at 222 nm increases with a small red shift (228 nm), then begins to decrease. The increase in the absorbance at 222 nm is due probably to the formation of phthalic, and benzoic acid (λmax ∼ 222 nm) [21, 27, 28], since benzene and phthalic acid are the reactants used to prepare anthraquinone by Friedel Crafts reaction. These intermediates (which have negligible absorbance at 254 nm with respect to that of AR S) are the result of the cleavage at the C-C bond in the central ring near the C=O) [27]. We observed also an isobestic point at 230 nm during the first period of electrolysis.
The addition of AR S solution to a freshly saturated solution with electrogenerated chlorine species leads to a sudden discoloration, and to a partial degradation of AR S. This means that the discoloration of AR S by chlorine species is very fast (direct oxidation). Therefore, the measure of the absorbance at 412 nm vs. time is not compatible (within the experimental conditions) for the determination of the order of the reaction. As the band at 254 nm is more intense and more indicative concerning the AR S degradation, this band was selected to have an idea about the degradation rate.
The degradation at Pt electrode did not follow a simple order, since the functions A254, ln A254 and that of 1/A254 did not remain linear with time (Fig. 2a).
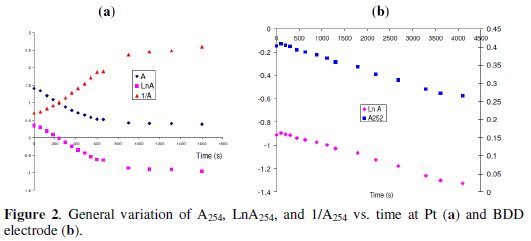
For this reason, the constant (kobs) is defined as the slope of the linear part of the functions listed above vs. time (it gives a good estimation of the degradation rate). Concerning the linear part of these functions, there is competition between order zero and order one, but in general, order one is the best order whatever the conditions of the experiments (pH, temperature,...).
Effect of AR S concentration
The effect of AR S concentration is studied at 10 mA, 0.06 M KCl, and 293 K and 5 mg L-1 ≤ [AR S] ≤ 35 mg L-1. The degradation rate constant (kobs) increases from 0.64×10⁻³ to 9×10⁻³ with the decrease of the dye concentration from 35 mg L-1 to 5 mg L-1. A similar behavior is observed with others dyes [14, 22]. The relation between kobs and the concentration of AR S (mg L-1) is not linear (kobs ×103: 104 × [AR S]-1.41, R: 0.998) (Fig. 3a).
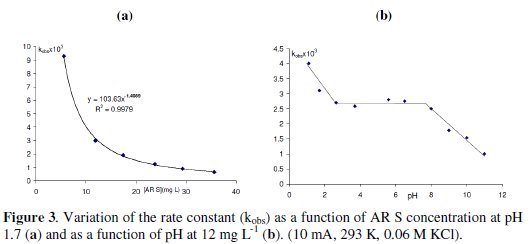
The increase in the initial AR S concentration increases the chlorine species needed for total degradation. Under the same operating conditions, the amounts of generated OH• should be similar, the ratio of the number of moles of AR S/ number of moles of OH• produced by a second, increases with the increase of AR S concentration in the medium, leading to a decrease in the degradation efficiency (decrease in kobs).
It is well understood that pH is one of the important factors that affect the performance of the electrochemical process. AR S has acid-base property, so the general shape of the spectrum and the absorbance of the dye is a function of the pH of the solution (Fig. 1a). The pKa of the two phenolic hydroxyl groups in AR S are 5.49 and 10.85 [31]. The acidic form (yellow) presents two maxima at 254 and 412 nm (A254: 0.056× [AR S] in mg L-1 , R2: 0.998). The monoacidic form (red) presents three maxima at 254, 324 and 506 nm (A254: 0.07 × [AR S] in mg L-1, R2: 0.997), and the basic form (violet) presents two maxima at 262 and 540 nm [30] (Fig. 1a).
The oxidant strength of chlorine is also a function of pH. Electrolysis at different initial pH (pH0) shows that the degradation rate constant (kobs) varies linearly for pH lower than 2 and higher than 8, but remained constant between these two values (Fig. 3b).
Effect of KCl concentration
The effect of KCl concentration on the degradation rate was undertaken in the following conditions: 0 M ≤ [KCl] ≤ 0.11 M, 12 mg L-1 of AR S, pH0: 1.7, 293 K, with 10 mA. The degradation increases linearly with the increase in KCl concentration (kobs × 103: 27.3 × [KCl] (M), R2: 0.98). The reason is that more amount of chlorine/hypochlorite will be generated while increasing the chloride concentration due to increased mass transport of chloride ions to the anode surface [10]. This result confirms the discoloration and the degradation of the organic compounds via the electro-generated halide species [15, 16].
Effect of ionic strength
The effect of the ionic strength on the degradation rate was investigated with 12 mg L-1 of AR S, at pH0: 1.7, 0.06 M KCl, at 10 mA, and by varying the concentration of Na2SO4 from 0.03 M to 0.2 M (spectator ions in the medium). The amount of chlorine species produced in these experiments is constant since the KCl concentration is hold constant. The results obtained showed no effect of the ionic strength on the degradation rate (kobs ∼ constant). The effect of this parameter is negligible, may be because the dye and the oxidants (HOCl, Cl2) are both neutral at the pH of the experiment (pH0: 1.7). Similar results are obtained with the xanthene dyes [15, 16].
Effect of current intensity
Current intensity is an important parameter in electrolysis. The generation of chlorine species by electrolysis was done in acidic medium (pH0: 1.7) in presence of 12 mgL-1 of AR S and 0.06 M KCl, at several constant currents ranging from 2 mA to 20 mA. As expected, the degradation rate constant increases linearly with the increase of the current intensity (kobs: 1.05×10⁻⁴ × I(mA), R2: 0.98). The increase in the degradation rate is related to the increase in the production rate of chlorine species. Similar results are obtained with other compounds [14, 15, 16, 29].
Effect of temperature
In general, any increase in temperature decreases the solubility of Cl2 in water and therefore decreases the discoloration rate constant of the dyes [10, 16]. The effect of the temperature on the degradation rate was investigated with 6 mg L-1 of AR S, pH0: 1.7, 10 mA, and 0.06 M KCl. For the range of temperature between 280 and 303 K, kobs decreases linearly with the increase of temperature (kobs : -2.8×10⁻⁴ × T(K) + 0.085, R2: 0.97).
Electrolysis with BDD/BDD electrodes
In the presence of KCl, the replacement of the Pt electrode by the BDD electrode gave approximately the same intermediate compounds since the evolution of the UV-visible spectra at BDD electrode are similar to those obtained with Pt electrode (Fig. 4a, Fig. 1b).
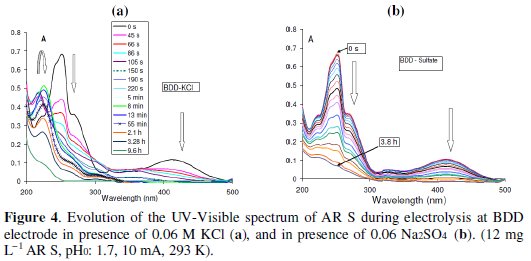
The slope of the function A254 and that of ln(A254) vs. time decrease during the electrolysis time as was the case with Pt electrode (Fig. 2a). The value of kobs is ∼ equal to that obtained with Pt electrode. The behaviors of BDD and Pt electrode are similar because Cl2 is generated at the surface of the two electrodes.
In the presence of sulfate, the slope of the function A254 and that of ln(A254) vs. time remain constant during the electrolysis time (Fig. 2b). There is a strong competition between zero order and one, and basing on the R2 value, the order of the degradation is rather zero, but to facilitate the comparison between the Pt and BDD electrodes, order one is selected [32]:

Order one is also observed by other authors [12, 32]. The degradation rate constant (kapp) in the presence of sulfate is slower than those in the presence of chloride (kobs), but the overall degradation rate is faster with sulfate (Fig. 4a, 4b). In the presence of sulfate, the electrolysis has the advantage to break down the dye directly into small compounds having absorbance below 200 nm.
Apparently, there is not formation of intermediates such as phthalic and benzoic acid, since there is decrease in the whole spectrum (Fig. 4a, 4b). The degradation mechanism in this case is different from that with chloride, but the overall reaction in both cases (Pt, BDD) can be written as follows:

The addition of the AR S solution after electrolysis for 3 h did not lead to a decrease in A254 so no reaction between solution OH and the dye (no indirect oxidation of the dye at BDD electrode).
The increase in the AR S concentration has a moderate effect on the rate constant. The increase in ARS concentration from 5 mg L-1 to 20 mg L-1 decreases the rate constant from 1.37×10⁻⁴ to 0.73×10⁻⁴, respectively. The decrease is not linear (kapp × 104: 2.7×[AR S]-0.45, R2:0.988). Similar effect is observed with other organic compounds on BDD electrode [33-35]. The increase in the sulfate concentration from 0.04 M to 0.12 M has negligible effect on the degradation rate constant (kapp-: 9.1 × 10⁻⁵). The independency of the rate constant with this parameter has already been observed with other organic compounds [15, 16, 18]. The behaviors of the two electrodes toward the AR S concentration and the ionic force are similar.
The increase in the current intensity from 0.5 mA to 20 mA increases the degradation rate constant from 0.55 × 10⁻⁵ to 12 × 10-5 (Fig. 5a).
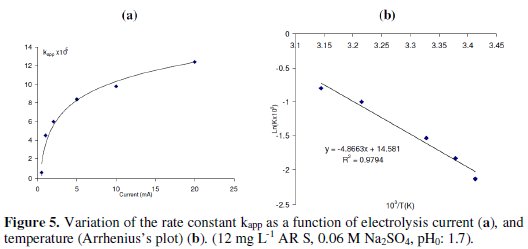
The non-linearity between the rate constant and the current can be explained as follows: with the increase of current, the part of OH• consumed by a side reaction increases, leading to a decrease in kobs with respect to the value expected from the linear relation.
Acidic medium has a moderate effect on the degradation rate constant. For the same experimental conditions, the rate constant decreases from 2.40×10⁻⁴ to 1.31×10⁻⁴, when the pH increases from 1.3 to 5.6. After that it remained constant. TOC analysis of AR S solution (12 mg L-1 ) before and after 3.5 h of electrolysis (at 318 K) shows a decrease in TOC value from 4.4 mg L-1 to 0 mg L-1. The comparison between the UV spectra and TOC analysis showed that a longer time is needed to have total mineralization than to have transparent spectrum in the UV (aliphatic carboxylic acids have absorbances below 200 nm). Similar result is obtained with higher AR S concentration [12].
Finally, the increase in temperature increases the degradation rate because the reaction between AR S and OH• becomes faster. Similar effect is observed with other organic compounds on BDD electrode [33-35]. Total transparency is obtained after 1.5 h at 318 K, while at 293 K, 4 h are needed (12 mg L-1 , 10 mA, pH: 1.7). kapp increases three times when the temperature increases from 293 K to 318 K. The effects of the different parameters on the electro degradation of AR S are summarized in Table 1.
The activation energy Ea value deduced from Arrhenius's plot is 40 kJ mol-1 (Ln(kobs) = 4.87×10³/T + 7.67 , R2: 0.979 ) (Fig. 5b). Also the activation enthalpy (ΔH‡) and the activation entropy (ΔS‡) deduced from Eyring equation are 37.8 kJ mol-1 and -0.19 kJ mol-1 K-1 respectively. ( Ln(k/T) = -4.56×10³/T + 0.95 , R2: 0.98). The free activation enthalpy (ΔG‡) is equal to 94.4 kJ moL-1 (at 298 K).
Conclusion
At BDD electrode, the mineralization of AR S in the presence of sulfate is faster than in the presence of KCl, but the discoloration is slower. In the presence of chloride, the behaviors of the BDD and Pt electrodes with respect to the degradation rate and degradation mechanism are similar. The increase of the current intensity, the dye concentration, and the ionic force on BDD electrode (in the presence of sulfate) and on Pt electrode (in the presence of KCl) follow the same attitudes, but their behaviors with respect to the temperature are opposite. TOC analysis confirms total mineralization of the dye on BDD electrode.
References
1. Miller JH, Kotenko JL. Stain Technol. 1987;62:237. [ Links ]
2. Sathish RS, Ravi KM, Nageswara RG, et al. Spectrochim Acta A Mol Biomol Spectrosc. 2007;66:457. [ Links ]
3. Rafatullah M, Sulaiman O, Hashima R, et al. J Hazard Mat. 2010;177:70. [ Links ]
4. Perez-Estrada LA, Aguera A, Hernando MD, et al. Chemosphere. 2008;70:2068. [ Links ]
5. Ashour E, Ahmed A-M, Al-Mesha AS, et al. Int J Cur Micobl Ap Sci. 2013;2:359. [ Links ]
6. Wu M, Zhao G, Li M, et al. J Haz Mat. 2009;163:26. [ Links ]
7. Abu Ghalwaa N M, Abdel-Latif M S. J Iranian Chem Soc. 2005;2:238. [ Links ]
8. Santos V, Morão A, Pacheco M-J, et al. J Environ Eng Manag. 2008;18:193.
9. Panizza M, Barbucci A, Ricotti R, et al. Sep Purif Technol. 2007;54:382. [ Links ]
10. Rajkumar D, Jong GK. J Haz Mat. 2006;B136:203. [ Links ]
11. El Hajj Hassan MA, El Jamal MM. Port Electrochim Acta. 2012;30:351. [ Links ]
12. Ammar S, Asma M, Oturan N, et al. Curr Org Chem. 2012;16:1978. [ Links ]
13. Peralta-Hernandez J M, Mendez-Tovar M, Guerra-Sanchez R, et al. Int J Electrochem. 2012;15:4316. [ Links ]
14. Zaviska F, Drogui P, Blais J-F, et al. J Appl Electrochem. 2009;39:2397. [ Links ]
15. Tabarra MA, Mallah HA, El Jamal MM. J Chem Technol Metall (Sofia). 2014;49:12. [ Links ]
16. Mallah HA, Naoufal DM, Safa AI, et al. Port Electrochim Acta. 2013;31:185. [ Links ]
17. Enache TA, Chiorcea-Paquim A-M, Fatibello-Filho O, et al. Electrochem Comm. 2009;11:1342. [ Links ]
18. Alencar de Souza RB, Martins Ruotolo LA. Int J Electrochem Sci. 2013;8:643. [ Links ]
19. Serra A, Domenech X, Peral J, et al. J Environ Eng Manag. 2008;18:173. [ Links ]
20. Ahmadi MF, Bensalah N, Gadri AL. Dyes Pigments 2007;73:86. [ Links ]
21. Abdessamad NH, Akrout H, Hamdaoui G, et al. Chemosphere. 2013;93:1309. [ Links ]
22. Panizza M, Oturan MA. Electrochimica Acta. 2011;56:7084. [ Links ]
23. Yi F, Chen S, Yuan C. J Haz Mat. 2008;157:79. [ Links ]
24. Panizza M, Cerisola G. Water Res. 2009;43:339. [ Links ]
25. El Ezaby MS, Salem TM, Zewail AH, et al. Chem Soc B. 1970;1923. [ Links ]
26. Markovic Z, Manojlovic N, Zlatanovic S. J. Serb Soc Comput Mechanics. 2008;2:73. [ Links ]
27. Wang A, Wu C-H, Biehl E. ARKIVOC. 2002;80. [ Links ]
28. Liu U, Wu T, Zhao J, et al. Environ Sci Technol. 1999;33:2081. [ Links ]
29. Gao J, Yu J, Lu Q, et al. Dyes and Pigments 2008;76:47. [ Links ]
30. Turcanu A, Bechtold T. Dyes Pigments. 2011;91:324. [ Links ]
31. Cordoba A, Magario I, Ferreira ML. J Molec Catalysis A: Chem. 2012;355:44. [ Links ]
32. Khataee A, Khataee A, Fathinia M, et al. J Ind Eng Chem. 2013;19:1890. [ Links ]
33. El Mouden OI, Errami M, Salghi R, et al. J Chem Pharm Res. 2012;4:3437. [ Links ]
34. Chen T-S, Kuo Y-M, Chen J-L, et al. Int J Electrochem Sci. 2013;8:7625. [ Links ]
35. Chen T-S, Huang K-L. Int J Electrochem Sci. 2013;8: 6343. [ Links ]
*Corresponding author. E-mail address: mjamal@ul.edu.lb
Received 13 June 2014; accepted 28 June 2014


