Serviços Personalizados
Journal
Artigo
Indicadores
-
 Citado por SciELO
 -
 Acessos
Links relacionados
-
 Similares em
SciELO
Compartilhar
Portugaliae Electrochimica Acta
versão impressa ISSN 0872-1904
Port. Electrochim. Acta vol.32 no.4 Coimbra jul. 2014
https://doi.org/10.4152/pea.201404259
Nano Analyses of Adsorbed Film onto Carbon Steel
T. Kasilingama,* , C. Thangavelub and V. Palanivelaa
a PG & Research Department of Chemistry, Periyar E. V. R. College (Autonomous), Tiruchirappalli, Tamilnadu, India
b Department of Chemistry, Govt. Arts College for Women, Nilakkottai, Dindugul, Tamilnadu, India
Abstract
The inhibition performance of a non-oxidising surfactant, namely cetyl trimethyl ammonium bromide (CTAB), and its co-adsorption behaviour with zinc ion on carbon steel in well water was studied by potentiodynamic polarization, electrochemical impedance spectroscopy (EIS), weight loss, as well as atomic force microscopy (AFM) and scanning electron microscopy. Results indicated that the formulation acted as an anodic inhibitor. Adsorption of the used inhibitor led to a reduction in the double layer capacitance and an increase in the charge transfer resistance. A synergistic effect was also observed for the studied inhibitor with Zn2+ in weight loss measurements and electrochemical studies.
Keywords: Weight loss, Electrochemical studies, AFM, SEM.
Introduction
A district heating system provides high temperature for the inhabitants of large cities [1]. There are many advantages from a district heating system, including increased energy and performance efficiencies achieved through implementing advanced equipment and maintaining them professionally, reduced life cycle costs, and augmented control over environmental impacts [2,3]. A district heating system has three main elements: the heat sources, the distribution system and the customer interfaces [4]. District heating system and corrosion of the pipelines are relevant issues. The customer interface uses well water, therefore quite extensive corrosion of steel and iron occurs, even after lime treatment [5]. There will be numerous problems such as corrosion of pipelines, space heating networks, and other equipment of the systems. All these disadvantages dramatically reduce the service time of the whole district heating system [6]. Many methods such as coating [7], phosphating [8], anodic or cathodic controls [9] and use of inhibitors [10] are adopted to minimize the corrosion problems. Among them only the use of inhibitors is convenient and economic [11-13].
Surfactant corrosion inhibitors have many advantages such as high inhibition efficiency, low price, low toxicity, and simple production. Surfactants are molecules composed of a polar hydrophilic group, the ''head'', attached to a non-polar hydrophobic group, the ''tail''. Generally, in aqueous solution the inhibitory action of surfactant molecules may also be due to physical (electrostatic) adsorption or chemisorption onto the metallic surface, depending on the charge of the solid surface and the free energy change of transferring a hydrocarbon chain from water to the solid surface.
The adsorption of a surfactant markedly changes the corrosion resisting property of a metal. For these reasons, studying the relation between adsorption and corrosion inhibition is significantly important [14-23]. Somewhat recently, the corresponding research has also demonstrated that quaternary ammonium salt surfactants are efficient corrosion inhibitors for iron and steel [24-29].
This article investigates the inhibition of corrosion of carbon steel in well water using CTAB and Zn2+ by using different techniques. The effectiveness of the formulation is explained on the basis of electrochemical parameters obtained from Tafel and Nyquist curves. In the present work the use of Scanning Electron Microscopy has been made to obtain a clear understanding of the protective film onto carbon steel surface without and with an inhibitor formulation.
Experimental details
Materials
The composition of carbon steel used for corrosion inhibition studies was (Wt %): 0.026% S, 0.06% P, 0.4% Mn, 0.1% C and balance being Fe. The specimens of size 1.0 cm × 4.0 cm × 0.2 cm were press cut from the carbon steel sheet, were machined and abraded with a series of emery papers. This was followed by rinsing in acetone and bidistilled water and finally dried in air. Before any experiment, the substrates were treated as described and freshly used with no further storage. The inhibitors CTAB, molecular mass 364.45g mol-1, Zn2+ ions were used as received.
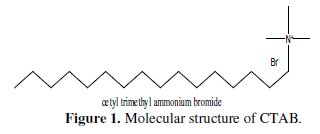
A stock solution of 1000 ppm of CTAB was prepared with bidistilled water and the desired concentration was obtained by appropriate dilution. The concentration of CTAB used for the study ranges from 10 to 150 ppm. All solutions were prepared using well water (Tiruchirappalli, Tamil Nadu, India). The study was carried out at room temperature. The molecular structure of CTAB is given in Fig. 1.
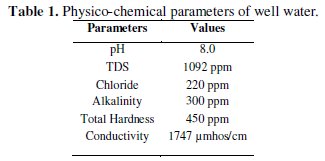
The chosen environmental well water and its physicochemical parameters are given in Table 1.
Weight-loss measurements
The freshly prepared carbon steel specimens were suspended in 150 mL beakers containing 100 mL of test solution maintained at room temperature with the aid of glass rods and hooks. The weight loss taken was the difference between the weight at a given time and the original weight of the specimens. The measurements were carried out for the uninhibited solution and the solution containing CTAB and CTAB - Zn2+ mixture. Weight loss experiments were performed for the duration of seven days. The specimens were immersed in triplicate and the average corrosion rate was calculated.
These uncertainties or RSD for three replicate measurements were less than 5%.
The corrosion rates (CR) were determined using the equation:

where W = corrosion weight loss of carbon steel (mg); A = area of the coupon (cm2); T = exposure time (h); D = density of the carbon steel (g cm-3).
The inhibition efficiency (IE) of CTAB and Zn2+ mixture was calculated by using the following equation:

where CRo = corrosion rate of carbon steel in the absence of the inhibitor; CRi = corrosion rate of carbon steel in the presence of the inhibitor.
Surface analysis by FTIR spectroscopy
After the immersion period of one day in various environments, the specimens were taken out of the test solution and dried. The film formed on the surface was scratched carefully and it was thoroughly mixed so as to make it uniform throughout. FTIR spectrum of the powder (KBr Pellets) was recorded using a Perkin-elmer-1600 FTIR spectrophotometer with resolving power of 4 cm-1.
Electrochemical studies
Both the potentiodynamic polarization studies and electrochemical impedance spectroscopic (EIS) studies were carried out using the electrochemical workstation model CHI-760d and the experimental data were analysed by using the electrochemical software (Version: 12.22.0.0).
The measurements were conducted in a conventional three electrode cylindrical glass cell with a platinum electrode as auxiliary electrode and a saturated calomel electrode as reference electrode.
The working electrode was carbon steel embedded in epoxy resin of polytetrafluoroethylene so that the flat surface of 1 cm 2 was the only surface exposed to the electrolyte. The three electrodes set up was immersed in a control solution of volume 100 mL both in the absence and presence of the inhibitors formulations and allowed to attain a stable open circuit potential (OCP). The pH values of the solution were adjusted to 7.0 and the solutions were unstirred during the experiments.
Polarization curves were recorded in the potential range of -750 to -150 mV with a resolution of 2 mV. The curves were recorded in the dynamic scan mode with a scan rate of 2 mV s-1 in the current range of -20 mA to +20 mA. The Ohmic drop compensation has been made during the studies. The corrosion potential (Ecorr), corrosion current (Icorr), anodic Tafel slope (βa) and cathodic Tafel slope (βc) were obtained by extrapolation of anodic and cathodic regions of the Tafel plots. The inhibition efficiency (IEp) values were calculated from the Icorr values using the equation

where Icorr and I'corr are the corrosion current densities in case of control and inhibited solutions, respectively.
Electrochemical impedance spectra in the form of Nyquist plots were recorded at OCP in the frequency range from 60 KHz to 10 MHz with 4 to 10 steps per decade. A sine wave, with 10 mV amplitude, was used to perturb the system. The impedance parameters viz., charge transfer resistance (Rct), double layer capacitance (Cdl) were obtained from the Nyquist plots. The inhibition efficiencies (IEi) were calculated using the equation,

where Rct and R'ct are the charge transfer resistance values in the absence and presence of the inhibitor, respectively.
Scanning Electron Microscopy
The surface morphology of the corroded steel sample surface in the presence and absence of the inhibitors was studied using SEM (Model: TESCAN vega3 USA). To study the surface morphology of carbon steel, polished specimens prior to initiation of any corrosion reaction, were examined in optical microscope to find out any surface defect, such as prior noticeable irregularities like cracks, etc. Only those specimens, which had a smooth pit-free surface, were subjected to immersion. The specimens were immersed for 24h at 30 °C. After completion of the tests the specimens were thoroughly washed with bidistilled water and dried and then subjected to SEM examination.
Atomic Force Microscopy (AFM)
Atomic force microscopy is a powerful method for the gathering of roughness statistics from a variety of surfaces. This exciting new technique allows the surface to be imaged at higher resolutions and accuracies than ever before. The protective films are examined for a scanned area. AFM is becoming an accepted technique of roughness investigation [30-33].
All the AFM images were recorded on a Pico SPM2100 AFM instrument operating in contact mode in air. The scan size of all the AFM images are 40 μm × 40 μm and 5 μm × 5 μm areas at a scan rate of 0.20(Hz) lines per second.
Results and discussion
Weight-loss measurements
Table 2 shows corrosion rates, inhibition efficiencies and synergism parameters of the carbon steel determined by the weight loss tests in well water without and with an inhibitor, and in 25 ppm Zn2+ inhibitor + CTAB different concentrations during seven days at 303 K.
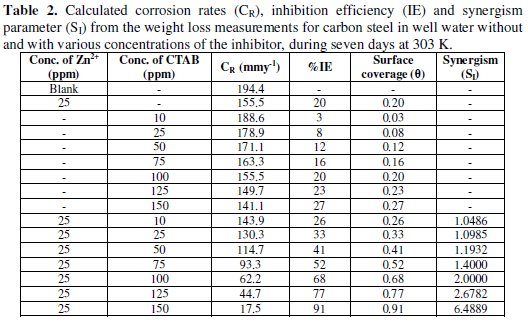
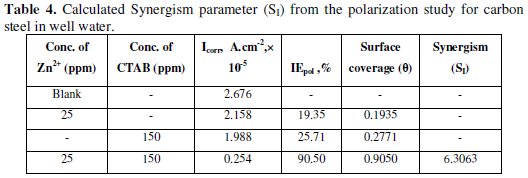
It can be observed that the addition of the inhibitor suppressed effectively the carbon steel corrosion in well water. The inhibition efficiency increased with increasing concentrations of the inhibitor and also increases the synergism parameter and then reached the maximum value when the inhibitor concentration was 150 ppm CTAB, indicating that the inhibition effect depends on the amount of the inhibitor. This trend can be attributed to an increase in the adsorption amount of inhibitor onto carbon steel surface with increasing inhibitor concentrations, separating the carbon steel surface from the corrosion medium and retarding corrosion via forming an inhibitor adsorption film. Besides, it can be seen from Table 2 that after addition of Zn2+ ions into the well water with 150 ppm CTAB, corrosion rates decreased significantly in comparison with singular inhibitor in well water, as well as the inhibition efficiency increased. For example, when 25 ppm Zn2+ was added into the well water containing 150 ppm CTAB, the corrosion rate reduced from 141.1 mm y-1 to 17.5 mm y-1 . Accordingly, the percentage of inhibition efficiency increased from 27% to 91%. These results suggest that there is a synergistic effect between inhibitor molecules and Zn2+ ion synergism parameter (SI) [34,35] values shown in Table 2. This is defined as,

where I1+2 = (I1 + I2)-(I1 × I2); I1 = surface coverage of inhibitors (CTAB); I2 = surface coverage of inhibitors (Zn2+); I'1+2 = combined surface coverage of inhibitors (CTAB) and (Zn2+).
Polarization study
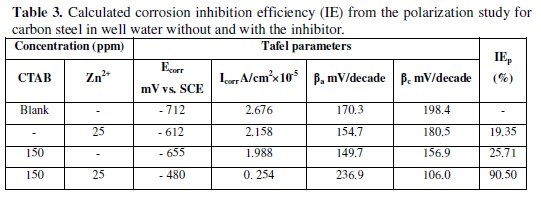
Fig. 2 shows the Tafel curves of carbon steel in well water without and with an inhibitor, respectively.
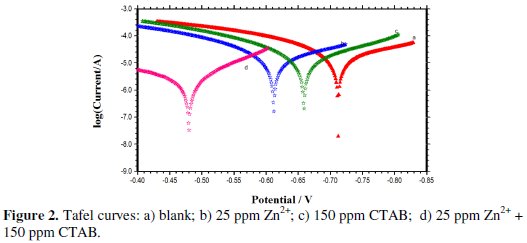
The Tafel curve for the (CTAB + Zn2+) inhibitor formulation indicates a shift of the corrosion potential toward a more positive value potential compared toward with the blank assess (from -712 mV to -480 mV). This corrosion potential shift was a result of the anodic inhibition effect of the inhibitor formulation. The anode Tafel curve obtained with the inhibitor indicates a greater trend toward passivity than without the inhibitor. Also, the cathodic zone showed the limiting current decreased for oxygen reduction. However, according to the corrosion potential the inhibitor formulation tended toward the anode inhibition.
From the Tafel curves, the corrosion current density (icorr) was determined by the Tafel extrapolation method; they were (2.676 A cm-2) (without) and 0.254 A cm-2 (with), respectively. The corrosion current density in well water decreased gradually with the inhibitor. The inhibition efficiency (IEpol %) of the inhibitor formulation for the corrosion of carbon steel was calculated using icorr [36].
The synergism parameters (SI) of the inhibitor formulation were calculated using the equation given below:

where I1+2 = (I1 + I2)-(I1 × I1); I1 = surface coverage of inhibitors (CTAB); I2 = surface coverage of inhibitors (Zn2+); I'1+2 = combined surface coverage of inhibitors (CTAB) and (Zn2+).
Table 3 and Table 4 show the calculated results of inhibition efficiency and synergism results corroborating the results of the weight loss measurement and electrochemical impedance studies.
AC impedance
Fig. 3 shows the Nyquist plots for carbon steel in well water with and without the inhibitor of OCP.
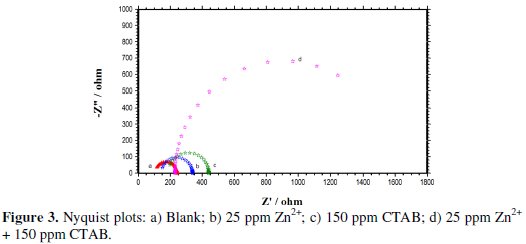
It can be observed that the impedance reaction of the electrode was significantly changed after the addition of co-adsorption of the inhibitor in the blank solution. In comparison with the blank solution, in the presence of the inhibitor, the diameters of the semi-circles in Nyquist plots increased with addition of co-adsorption inhibitor.
These results indicate that the impedance of the carbon steel electrode increased with addition of co-adsorption of the inhibitor, consequently resulting in an increase in inhibition effect, and that the carbon steel corrosion was effectively retarded due to the formation of a protective film onto the metal surface. In addition, the impedance spectra did not present semi circles; this phenomenon can be attributed to the frequency dispersion [37-38].
It is also evident that the Nyquist plots are composed of two slightly depressed capacitive loops: the one at the high frequencies can be attributed to the charge transfer resistance (Rct), and to the double layer capacitance (Cdl). The fitted electrochemical parameters are listed in Tables 5 and 6.


It is apparent from these tables that by increasing addition of co-adsorption of the inhibitor, the Cdl value tended to decrease, whereas the Rct value increased. The significant decreased in the capacitance values can be ascribed to a decrease in the dielectric constant or an increase in the double electric layer thickness due to the adsorption of the inhibitor molecule onto the carbon steel surface [39]. The results as obtained by electrochemical impedance studies are consistent with the results of the polarization study and weight loss measurements.
FTIR Spectra
FTIR spectra were recorded to understand the interaction of inhibitor molecules with the metal surface [40-43]. The FTIR spectrum of pure CTAB is shown in Fig 4a.
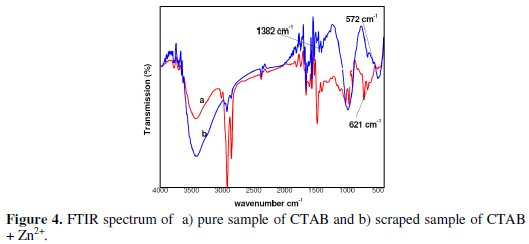
The C-Br stretching frequency of the cetyl trimethyl ammonium bromide appears at 621 cm-1. The FTIR spectrum of the protective film formed onto the carbon steel surface after immersion in the solution containing 25 ppm Zn2+ and 150 ppm CTAB is shown in Fig 4b. The C-Br stretching frequency of CTAB shifted from 621 cm-1 to 572 cm-1.
These results revealed that the C-Br coordinated with Fe2+ on the anodic mode of the metal surface also resulted in the formation of Fe2+-CTAB complex. The peak appearing at 1382 cm-1 is due to Zn(OH)2 formed on the cathodic regions of the metal surface.
Evidence of surface
In order to further confirm the corrosion resistance ability of the formulation as a good corrosion inhibitor in well water, the surface morphology of carbon steel in well water without and with the inhibitor Zn2+ + CTAB for one day exposure (Fig. 5) was investigated using scanning electron microscope (SEM).
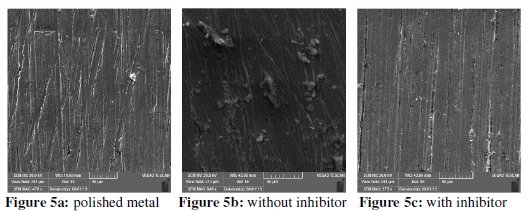
Fig. 5a: polished metal surface before immersion, good surface properties; Fig. 5b demonstrates strongly damaged metal surface in the absence of the inhibitor formulation, due to dissolution of the metal in the bulk of the environment. The surface is highly porous with large uneven oxides formed over it. Nevertheless, from Fig. 5c the dissolution rate of carbon steel suppressed and smoother surface was observed due to formation of a protective film onto the metal surface when compared to the treated one without the inhibitor in well water. This phenomenon showed that the presence of a protective film can protect the carbon steel surface from corrosion efficiently.
Atomic force microscopy
AFM is a powerful technique to probe the surface morphology at nano-to micro- scale and has developed into a new option to study the influence of inhibitor formulations on the generation and progress of the corrosion at the metal/solution interface. The three dimensional AFM morphologies for polished carbon steel surface immersed in without and with an inhibitor formulation are shown in Fig. 6.
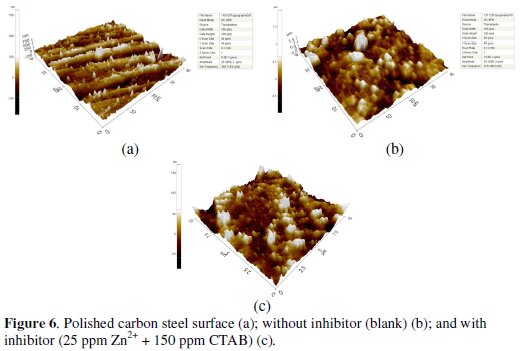
The root mean square (rms) roughness measurements were carried out for polished carbon steel, uninhibited and inhibited carbon steel surface. The vertical lines in the polished carbon steel sample are due to the fine scratches obtained during the polishing process [44]. The rms roughness and maximum peak - to peak height data's suggest the carbon steel surface immersed in well water has a greater surface roughness than the inhibited metal surface (Table 7).

The presence of inhibitor formulation in well water significantly reduces to 88.8 nm, when compared with 235.7 nm and 133.1 nm of carbon steel surface immersed in well water and polished carbon steel surface. These parameters confirm that the surface appears smoother; the smoothness of the surface is due to the formation of a protective film of (CTAB + Zn2+) on the metal surface thereby inhibiting the corrosion of carbon steel.
Conclusions
The following conclusions are drawn from the present study:
1. The formulation (Zn2+ + CTAB) was found to be a good inhibitor for carbon steel in well water.
2. Inhibition efficiency (91%) obtained from weight loss data and synergism parameter is comparable with those obtained from polarization and AC impedance measurements and they are in good agreement.
3. Tafel curves revealed that the formulation is an anodic inhibitor.
4. FTIR spectra show that the protective film consists of F2+-CTAB complex and Zn(OH)2 and oxides of Fe. Nyquist curves indicate that a protective film is formed onto the metal surface.
5. SEM and AFM studies support that the inhibitor molecules form a good protective film onto the metal surface.
References
1. Choi SY, Yoo KY, Lee JB, et al. Appl Therm Eng. 2010;30:2067. [ Links ]
2. Ghafghazi S, Sowlati T, Sokhansanj. S, et al. Appl Energy. 2010;87:1134. [ Links ]
3. Harvey D. A Handbook on Low Energy Buildings and District Energy Systems: Fundamentals, Techniques and Examples. London: Earthscan Publications; 2006. [ Links ]
4. Skagestad B, Mildenstein P. District Heating and Cooling Connection Handbook. IEA District Heating and Cooling; 1999. [ Links ]
5. Cohen M. J Electrochem Soc. 1946;89:11. [ Links ]
6. Eliseev K. District Heating System in Finland and Russia. Mikkeli University of Applied Sciences; 2011. [ Links ]
7. Galliano, Landolt FD. Prog Org Coat. 2002;44:217. [ Links ]
8. Lin B, Lu J, Kong G. Surf Coat Technol. 2008;202:1831. [ Links ]
9. Kim JG, Kim YW. Corros Sci. 2001;43:2011. [ Links ]
10. El-Etre AY, Abdallah M. Corros Sci. 2000;42:731. [ Links ]
11. Rezenfeld IL. Corrosion Inhibitors. New York: McGraw-Hill; 1981. [ Links ]
12. Boffardi BP. Metals Handbook: Corrosion. 9th ed. Vol. 13. OH: American Society for Metals, Metals Park; 1987. [ Links ]
13. Ali MR, Mustafa CM, Habib M. J Sci Res. 2009;1:82. [ Links ]
14. Badawi AM, Hegazy MA, El-Sawy AA, et al. Mater Chem Phys. 2010;124:458. [ Links ]
15. Bastidas JM, Pinilla P, Polo JL, et al. Corros Sci. 2003;45:427. [ Links ]
16. Stipnisek-Lisac E, Gazivoda A, Madzarac M. Electrochim Acta. 2002;47:4189. [ Links ]
17. Sahin M, Bilgic S, Yilmaz H. Appl Surf Sci. 2002;195:1. [ Links ]
18. Sing DN, Dey AK. Corrosion. 1993;49:594. [ Links ]
19. Banerjee G, Mahotra SN. Corrosion. 1992;48:10. [ Links ]
20. Arab ST, Noor EA. Corrosion. 1993;49:122. [ Links ]
21. Raspi LA. Nickel Corros. 1993;49:821. [ Links ]
22. Chen Y, Wang Y, Zhang G. Daily Chem Ind. 1986;2:56. [ Links ]
23. Shi L, Song H. Daily Chem Ind. 1987;1:9. [ Links ]
24. Wang XM, Yang HY, Wang FH. Corros Sci. 2011;53:113. [ Links ]
25. Wang XM, Yang HY, Wang FH. Corros Sci. 2010;52:1268. [ Links ]
26. Qiu LG, Wu Y, Wang YM, et al. Corros Sci. 2008;50:576. [ Links ]
27. Saleh MM, Atia AA. J Appl Electrochem. 2006;36:899. [ Links ]
28. Hegazy MA. Corros Sci. 2009;51:2610. [ Links ]
29. Huang W, Zhao J. Col Surf A. 2006;278:246. [ Links ]
30. Dumas Ph, Butffakhreddine B, Am C, et al. Europhys Lett. 1993;22:717. [ Links ]
31. Bennett JM, Jahannir J, Podlesny JC, et al. Appl Opt. 1995;43:213. [ Links ]
32. Duparre A, Kaiser N, Truckenbrodi H, et al. Proceedings of SPIE. 1993;1995:181. [ Links ]
33. Amra C, Deumie C, Torricini D, et al. Proceedings of SPIE. 1994;2253:614. [ Links ]
34. Aramaki K, Hackerman N. J Electrochem Soc. 1969;116:568. [ Links ]
35. Larabi L, Harek Y, Traisnel M, et al. J Appl Electrochem. 2004;34:833. [ Links ]
36. Touhami F, Aouniti A, Abed Y, et al. Corros Sci. 2000;42:929. [ Links ]
37. Juttner K. Electrochem Acta. 1990;35:1501. [ Links ]
38. Muralidharam S, Phani KLN, Pitchumani S, et al. J Electrochem Soc. 1995;142:1478. [ Links ]
39. Popova A, Sokolova E, Raicheva S, et al. Corros Sci. 2003;45:33. [ Links ]
40. Selvi ST, Raman V, Rajendran N. J Appl Electrochem. 2003;33:1175. [ Links ]
41. Thangavelu C, Patric Raymond P, Rajendran S, et al. Asian J Research Chem. 2011;4:402. [ Links ]
42. Thangavelu C, Umarani M, Sekar M, et al. RASAYAN J Chem. 2011;4:245. [ Links ]
43. Thangavelu C, Patric Raymond P, Rajendran S, et al. Asian J Research Chem. 2011;4:1033. [ Links ]
44. Kleber C, Hilfrich U, Schreiner M. Appl Surf Sci. 2007;253:3712. [ Links ]
*Corresponding author. E-mail address: thavankasi@gmail.com
Received 30 July 2014; accepted 23 August 2014


