Serviços Personalizados
Journal
Artigo
Indicadores
-
 Citado por SciELO
 -
 Acessos
Links relacionados
-
 Similares em
SciELO
Compartilhar
Portugaliae Electrochimica Acta
versão impressa ISSN 0872-1904
Port. Electrochim. Acta vol.34 no.6 Coimbra nov. 2016
https://doi.org/10.4152/pea.201606407
Modeling of Corrosion Kinetics of Mild Steel in Hydrochloric Acid in the Presence and Absence of a Drug Inhibitor
Salah H. Aljbour*
Department of Chemical Engineering, College of Engineering, Mutah University, Karak, 61710, Jordan
Abstract
Cefixime was investigated as a corrosion inhibitor for mild steel in an hydrochloric acid solution. The results revealed that the order of reaction is 0.427, with activation energy found to be 41.7 kJ/mol. Cefixime was effective in increasing the inhibition efficiency for all inhibition concentrations. The corrosion rate profile was found to be second- order kinetics with respect to corrosion activity.
Keywords: mild steel; hydrochloric acid; corrosion; cefixime; kinetics.
Introduction
Corrosion of metals is a major problem for the application of metals in many services. Acid solutions and, more specifically, hydrochloric acid, are used for the removal of rust and scale in industrial processes [1]. The contact between these acid solutions and metals used in industrial processes causes metal dissolution and corrosion. Corrosion causes plant shutdowns, waste of valuable resources, loss or contamination of product, reduction in efficiency, costly maintenance and expensive overdesign [2]. Because iron and steel are the backbone of industrial constructions, many attempts have been made to find methods of reducing the corrosion and wear costs of these metals. One of the most important methods in the corrosion protection of these metals is using inhibitors. Corrosion inhibitor is a chemical substance that is effective when added to a corrosive environment in very small amounts, to decrease the corrosion rate of the exposed metallic material [3]. Heterocyclic compounds containing both nitrogen and sulfur are of particular importance, as they often provide excellent inhibition [4-10]. Both synthetic and naturally-occurring materials have been proposed as potential inhibitors for metal corrosion [11-13]. Several methods have been proposed to evaluate the inhibition efficiency. The most widely used method is based on comparing the relative rate of corrosion under inhibition with and without inhibition. The calculated rates of corrosion with and without inhibitor use are based on fixed immersion time. Therefore, the reported inhibition efficiency is based on fixed values of corrosion rates. However, it is not guaranteed that the rate of corrosion is constant with time. It is well established that the inhibitor will progressively be adsorbed on the surface of the metal, thereby, simultaneously reducing the rate of corrosion. Consequently, meaningful calculations for the inhibition efficiency must be based on intrinsic corrosion rate parameters. Another important method to evaluate the inhibition efficiency is based on comparing the activation energy for inhibited and uninhibited corrosion processes. The Arrhenius relation is used to calculate the activation energy. However, numerous reported results regarding the calculation of activation energy are based on the assumption that the rate of corrosion is zero order kinetics. No attempts have been made to verify the zero- order kinetic assumption.
In this study, the intrinsic kinetics of corrosion is investigated. The objectives of this research are to determine the corrosion reaction order, specific corrosion reaction rate constant and the activation energy for the corrosion of mild steel in hydrochloric acid solution. In addition, the research involved studying the inhibition efficiency of a drug inhibitor called cefixime on the corrosion process of mild steel. Finally, modeling the rate of corrosion profile and its kinetics under different operating conditions is accomplished.
Experimental
Cefixime as corrosion inhibitor
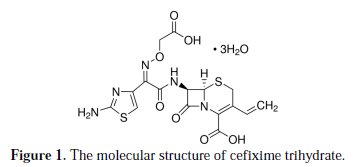
Cefixime trihydrate known commercially as Cefix (molecular weight of 507.50), from Pharma International (Amman, Jordan), was used for the study. Fig. 1 shows the molecular structure of cefixime trihydrate.
It is a broad spectrum semi-synthetic third generation cephalosporin for oral administration. It is active for several gram-positive and gram-negative organisms. It is indicated in the treatment of several infections such as pharyngitis, tonsillitis and sinusitis. Cefix is sold as capsules, each contain 400 mg cefixime trihydrate.
Specimen preparationn
The test specimens were rods made of dead mild steel alloy. The dead mild steel has a carbon content of 0.1-0.15 wt%, and it is widely used in the production of wires, nails, rivets, tubes and rolled sheets for the production of pressings. The test specimens were 75 mm length and 4.6 mm diameter. The specimens were first mechanically polished with 600, 800, 1000, and 1200 grade of emery paper, in order to obtain a smooth surface, afterwards were degreased in acetone, then rinsed in distilled water, and finally dried and weighed. The weights of the specimens before and after corrosion were determined by using an analytical balance (PW 124, Adam Equipment), with a linearity ± 0.0002 g.
Corrosion experiments
After accurately weighting, the specimens were immersed in a beaker containing 1000 mL HCl, with and without addition of different concentrations of cefixime. The concentrations of HCl used were 0.5, 0.25 and 0.1 M, while the concentrations of the inhibitor were: 400, 200, 100 and 50 ppm. The acid solutions were made from analytical grade 37% HCl and deionized water. All experimental were carried out at 296 K (except experiments for the effect of temperature). The temperature was controlled by a thermostat bath. After the required time of immersion, a triplicate of specimens was periodically taken out, dried and mechanically polished with a 1200 grade of emery paper, in order to remove all corrosion products and to obtain a smooth surface. The polished specimens were degreased in acetone, then rinsed in distilled water, and finally dried and weighted (W ). The rate of corrosion (g/cm2.hr) is calculated based on the difference in weights of the specimen, and using the relation:

where Wo is the weight of specimen before corrosion, whereas W is the weight of specimen after being subjected to corrosion and polished to remove all the corrosion product, t is the time of immersion in h and A is the surface area of the metal specimen in cm2.
Theoretical considerations
Kinetics of the corrosion process
The use of differential and integral methods to determine the reaction order and specific reaction constant for corrosion process is difficult, because it requires the concentration-time profile. In addition, the complex chemistry of corrosion could render the differential methods ineffective. In this case, the method of initial rates could be employed to determine the reaction order and the specific reaction constant. In this research, a series of experiments is carried out at different initial acid concentrations, (CHCl)0, and the initial rate of corrosion (rc)0 is determined for each run.
The rate law is assumed to be of the form:

A plot between ln (rc)and ln (CHCl)enabled finding the reaction order and specific reaction constants. The initial corrosion rate is determined by analyzing the corrosion rate-time data and extrapolating to zero time. However, improper extrapolation by adopting improper trend equation for the corrosion rate-time data will lead to under-or overestimation of the initial corrosion rate. It is believed that the rate of corrosion is not constant with respect to time, due to complex reaction chemistry, reduction in reactivity of the corrosive medium and effect of other phenomena like adsorption or coating on metal surface. Following the analysis of Levenspiel [14], in analyzing catalytic reaction under deactivation condition, the experimental corrosion rate-time data were modeled by defining a time dependent variable a(t) , called activity. The activity is defined as:

Based on the above activity definition, the rate of change can be written as:

The rate of change in activity is assumed to be of a second order kinetics, that is:

At t = 0, a(t) equals 1, therefore the integral form of Equation 5 is given as:

Substituting Equation 6 in Equation 4 yields:

The linearized form of Equation 7 is given as

To check the validity of the proposed model in describing the kinetics of corrosion, a plot between 1/rc(t) versus t must result in a straight line with a slope equal to k2/(rc)0 and an intercept equal to 1/(rc)0.
The Arrhenius equation can be used to calculate the intrinsic activation energy for the corrosion process E (kJ/mol) as it follows:

where k(T1) and k(T2) are the specific corrosion rate constants at T1and T2, respectively and R is the universal gas constant (8.314 J/mol.K).
Inhibition efficiency
It is a common practice to evaluate the promotion effect of the inhibitor by defining the inhibition efficiency (IE) based on the following equation:

where, rc is the rate of corrosion without inhibition and rc,i is the rate of corrosion with inhibition.
The rate of corrosion is changing with time; hence, the inhibition efficiency will change with time. The inhibition efficiency profile can be obtained by substituting Equation 7 in Equation 10, to get:

Results and discussion
The kinetics of the corrosion of mild steel in an HCl solution
The corrosion of mild steel in different concentrations of HCL is studied at a temperature of 296 K. The rate of the corrosion profile is determined by using Equation 1 under different initial HCl concentrations, namely: 0.5, 0.25 and 0.1 M. The rate of corrosion profiles is modeled in terms of an activity function that takes into account the corrosivity of the system and its decay with time. A second order kinetic model is proposed for the rate of activity decay with time. The profile of the rate of corrosion is plotted in a linearized form based on the proposed model (Equation 8). The results are shown in Fig. 2.
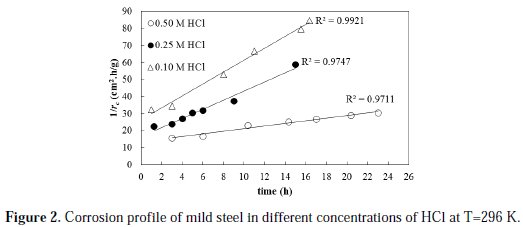
The results clearly show that the proposed model is satisfactorily fitting the behavior of the corrosion rate profile with a high coefficient of determination (R2 value) for the three set of data. The R2 values are found to be 0.971, 0.974 and 0.992 for the 0.50, 0.25, and 0.10 M HCl fitted experimental data, respectively. The initial rates of corrosion, as obtained from the reciprocal of intercept of trend lines, are found to be 0.075, 0.061 and 0.038 g/cm2.h for 0.50, 0.25 and 0.10 M initial acid concentration, respectively. Based on the above results, it is evident that increasing the initial acid concentration increased the initial metal corrosion rate.
To obtain the order of corrosion rate and specific rate constant, a linearized plot between ln (r )and ln (C )is constructed, and the results are shown in Fig. 3.
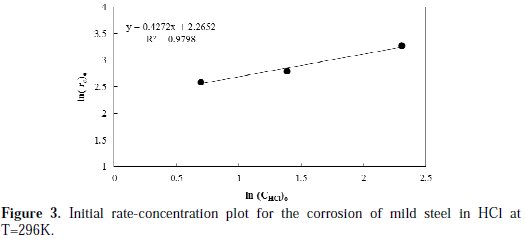
A linear fitted line is obtained with R2 value, which equals to 0.979. The slope value of the line used to calculate the order of reaction is found to be 0.427, while the intercept is used to calculate the specific reaction rate constant, and is found to be 0.104 g.L0.427/cm2.h.mol0.427, at a temperature of 296 K.
To obtain the activation energy of the corrosion process, the corrosion rate profiles at various temperatures and initial acid concentration of 0.25 M are experimentally determined and linearly fitted, as shown in Fig. 4.
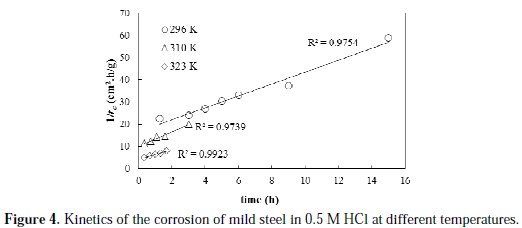
The profiles of the corrosion rate at all the studied temperatures are satisfactorily linearly fitted with high R2 values. The initial rates of corrosion, as obtained from the reciprocal of intercept of the trend lines, are found to be 0.061, 0.100 and 0.240 g/cm2.h, at temperatures of 296, 310 and 323 K, respectively. Obviously, increasing the temperature resulted in an increase in the initial rate of corrosion. Based on the initial rate values and the reaction rate form proposed in Equation 2, an estimate of the specific reaction constant can be obtained. The calculated values of the specific reaction rate constants are found to be 0.104, 0.181, 0.433 g.L0.427/cm2.h.mol0.427, at temperatures of 296, 310 and 323 K, respectively. To determine the activation energy, Arrhenius plot is constructed and shown in Fig. 5.
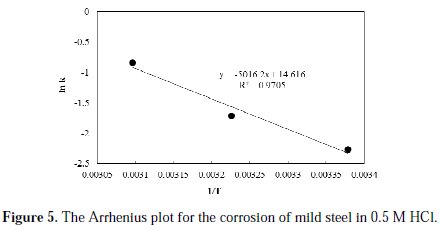
From the slope of the fitted line of the Arrhenius plot, the activation energy of the reaction is found to be 41.7 kJ/mol. As reported in literature, several values have been determined for the value of the activation energy for the corrosion of mild steel in hydrochloric solutions. Oguzie [15] reported a value of 49.3 kJ/mol; Behpour et al. [16] reported a value of 53.6 kJ/mol; Benabdellah et al. [17] reported a value of 59.39 kJ/mol; Naqvi et al. [18] reported a value of 36.8 kJ/mol; Abdel Hameed [19] reported a value of 40.37 kJ/mol; Singh [20] reported a value of 42 kJ/mol; while Yousefi et al. [21] reported a value of 60.94 kJ/mol. These variations in the reported activation energy values could be attributed to the assumptions of zero order kinetics of the corrosion process, as well as to variations in the metallurgical properties of the used mild steel.
Inhibition efficiency
The drug inhibitor ''cefixime'' was utilized to inhibit the corrosion of mild steel in a 0.5 M HCl solution at 296 K. Several inhibitor doses were employed, namely: 50, 100, 200 and 400 ppm. The corrosion rate profiles are shown in Fig. 6, based on the proposed kinetic model.
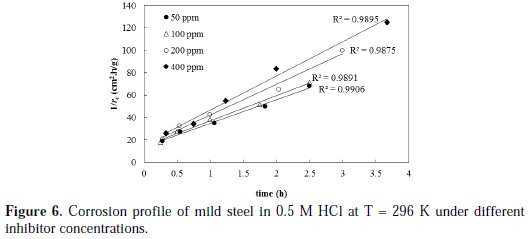
The rate of corrosion profiles for all inhibitor concentrations is satisfactory fitted by the linearized form given by equation with high R2 values. The initial rates of corrosion that are obtained from the reciprocal of the trend line intercepts are found to be 0.0.073, 0.070, 0.068 and 0.063 g/cm2.h for 50, 100, 200, and 400 ppm inhibitor concentrations, respectively.
As reported earlier in this paper, the initial rate of corrosion without inhibitor was 0.075 g/cm2.h. The results clearly show that increasing the inhibitor concentration is decreasing the initial rate of corrosion, which confirms the inhibition effect and the feasibility of cefixime as a possible inhibitor for mild steel corrosion.
Another insight can be made based on the 2nd order activity rate constant (k2), which is considered as a measure for the speed of decay in the system activity toward corrosion. The k2 values are obtained from the slopes of the trend lines shown in Fig. 6. The k2 values were found to be 1.5, 1.57, 1.88, 1.92 h-1 for 50, 100, 200, and 400 ppm inhibitor concentrations, respectively, and 0.048 h-1 for a blank solution. These research results clearly show that the use of inhibitor reduced the activity of the system towards metal corrosion by, at least, two orders-of-magnitude compared to conditions without inhibition. Maximum reduction in activity was obtained with 400 ppm inhibitor concentration. The inhibition efficiency of cefixime was calculated under different inhibitor concentrations by using Equation 11, and the results are plotted in Fig. 7.
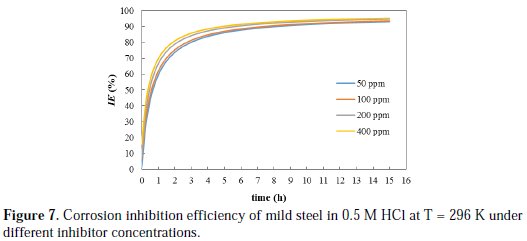
The inhibition efficiency of the inhibitor under different concentrations increased by increasing the immersion time up to 6 h, and thereafter it is barely increased. Long immersion time will ensure high loading of the adsorbed inhibitor on the surface of metal, which results in a persistent film that inhibits further corrosion. Similar trend was observed by other researchers. Singh and Quraishi [22] noticed that the inhibition efficiency of Mannich bases on the corrosion of mild steel in an HCl solution was found to increase with time up to 12 h, and thereafter remained almost constant.
Conclusions
The corrosion rate of mild steel in a hydrochloric solution is dependent on the acid concentration. The activation energy for mild steel corrosion in a hydrochloric solution is found to be 41.7 kJ/mol. Cefixime trihydrate is found to be efficient in increasing the inhibition efficiency for all inhibition concentrations. The corrosion rate profile follows second-order kinetics with respect to corrosion activity.
References
1. John S, Joseph A. RSC Adv. 2012;2:9944. [ Links ]
2. O.R. Adetunji. In: Corrosion and Materials in the Oil and Gas Industries. Javaherdashti R, Nwaoha C, Tan H (editors). CRC Press; 2013. pp. 375394. [ Links ]
3. Finsgar M, Jackson J. Corros Sci. 2014;86:17. [ Links ]
4. Quraishi M, Sardar R. Mater Chem Phys. 2003;78:425. [ Links ]
5. Quraishi MA, Sardar R. Indian J Chem Technol. 2004;11:103. [ Links ]
6. Bentiss F, Lebrini M, Lagrenée M, et al. Electrochim Acta 2007;52:6865.
7. Yadav DK, Quraishi MA. Ind Eng Chem Res. 2012;51:8194. [ Links ]
8. Saliyan RV, Adhikari AV. Indian J Chem Technol. 2009;16:162. [ Links ]
9. Mobin M, Parveen M, Khan MA. Recent Res Sci Technol. 2011;3:40. [ Links ]
10. Mistry BM, Patel NS, Jauhari S. Arch Appl Sci Res. 20113;3:300.
11. Ostovari A, Hoseinieh SM, Peikari M, et al. Corros Sci. 2009;51:1935. [ Links ]
12. Krishnegowda PM, Venkatesha VT, Krishnegowda PKM, et al. Ind Eng Chem Res. 2013;52:722. [ Links ]
13. Hamdy A, El-Gendy NS. Egypt J Pet. 2013;22:17. [ Links ]
14. O. Levenspiel. Chemical reaction engineering. 3rd ed. John Wiley & Sons; 1999. [ Links ]
15. Oguzie EE. Corros Sci. 2008;50:2993. [ Links ]
16. Behpour MS, Ghoreishi M, Gandomi-Niasar A, et al. J Mater Sci. 2009;44:2444. [ Links ]
17. Benabdellah M, Tounsi A, Khaled KF, et al. Arab J Chem. 2011;4:17. [ Links ]
18. Naqvi I, Saleemi AR, Naveed S. Int J Electrochem Sci. 2011;6:146. [ Links ]
19. Abdel Hameed RS. Port Electrochim Acta 2011;29:273. [ Links ]
20. Singh AK. Ind Eng Chem Res. 2012;51:3215. [ Links ]
21. Yousefi A. Javadian S, Neshati J. Ind Eng Chem Res. 2014;53:5475. [ Links ]
22. Singh AK, Quraishi MA. J Appl Electrochem. 2010;40:1293. [ Links ]
Acknowledgements
Lab engineer Ali Alzoubi of the chemical engineering department at Mutah University is acknowledged for laboratory assistance.
*Corresponding author. E-mail address: saljbour@yahoo.com
Received June 13, 2016; accepted October 6, 2016


